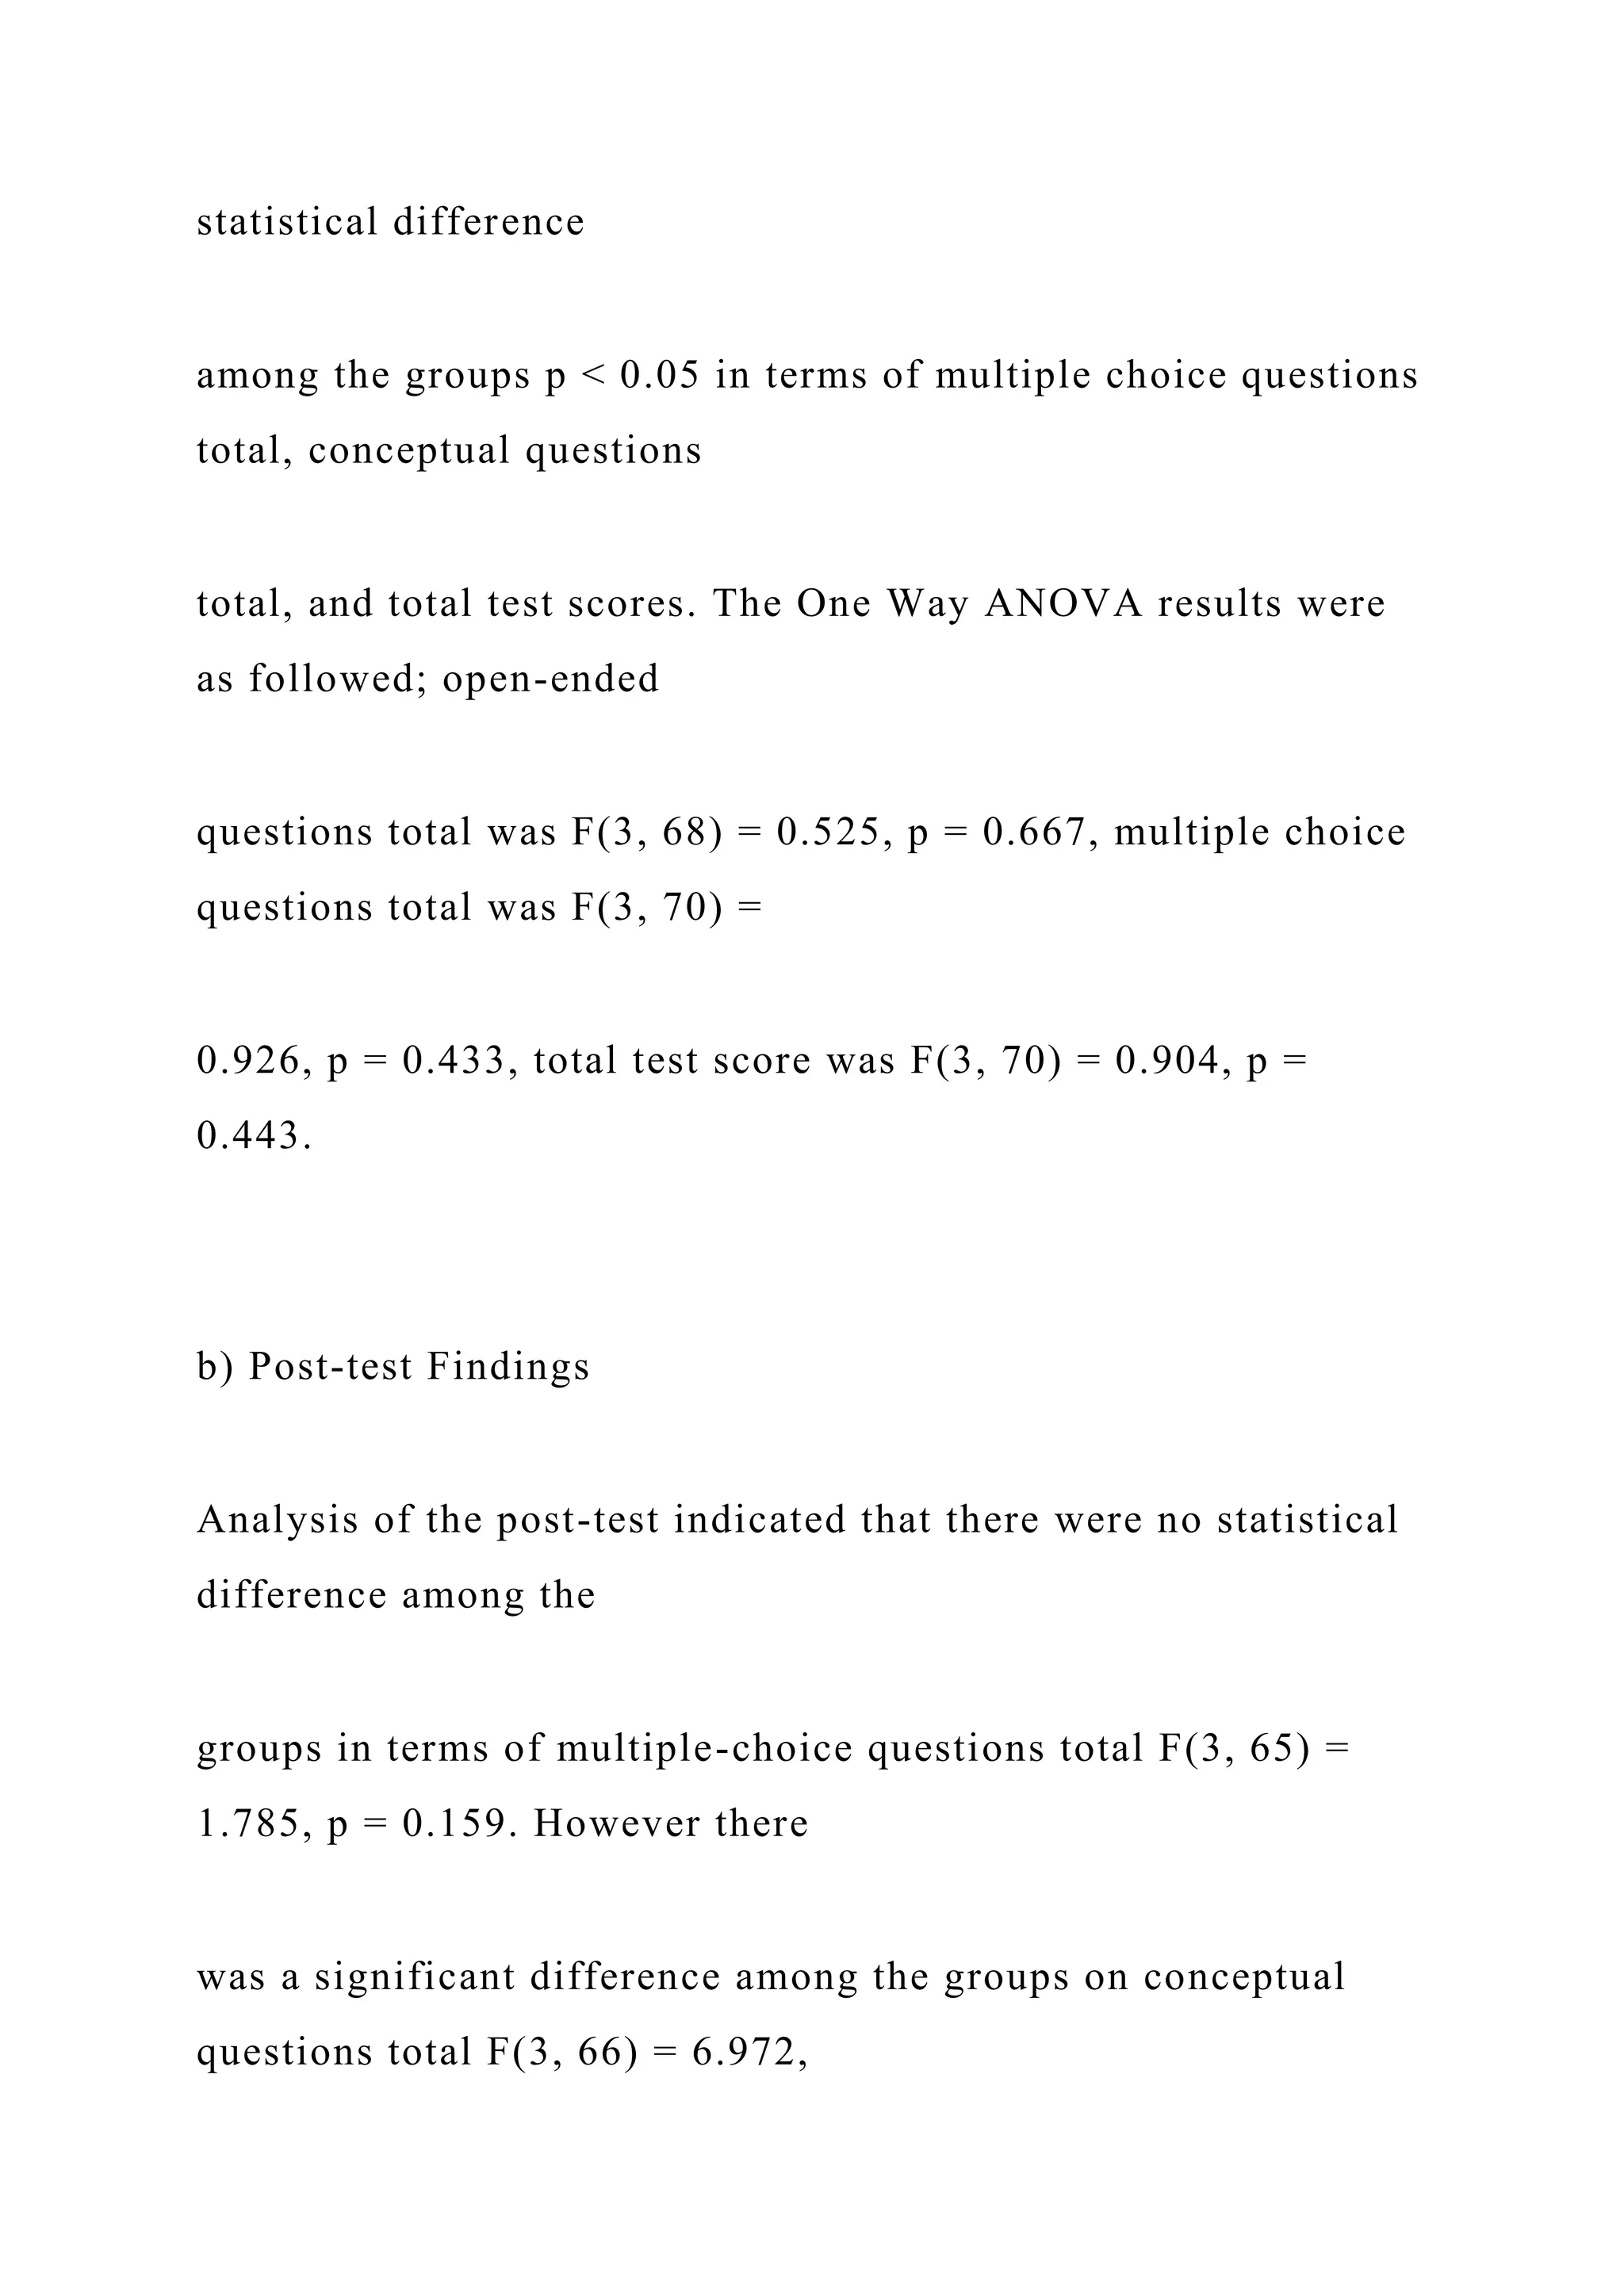
The document discusses the influence of politics on the healthcare system in the US, highlighting significant reforms from the 1930s to contemporary policies such as the Affordable Care Act. It explores how political agendas and competition have shaped healthcare legislation, affecting financing, insurance, delivery, and quality sectors. The analysis suggests that politicians often exploit healthcare gaps for electoral gains while noting the evolving nature of healthcare reforms against the backdrop of political strategies.
![i. Developing Health Maintenance Organizations
D. Jimmy carter
a. Supported national health insurance program
E. Clinton
a. He made changes in health insurance coverage
b. Introduced National Health Reform
F. Harris Wofford
a. He formed democratic debates
b. He insisted on health insurance
G. Barrack Obama
a. Introduced the Affordable Care Act
1. The purpose is creating more tax revenue
2. Condemning citizens to vote for their health care services
V. Introduction of the managed care plan
A. A way of containing health care costs
· [INCLUDE FINDINGS, ANALYSIS, DISCUSSION
SECTIONS HERE]Comment by James A Love: After you give a
solid review, you will need some additional sections to add in
your “new” contributions to the existing literature. Basically,
try to find some meaning from all of the research your studied
to support your thesis. This is typically in the “findings”
section. You may need to revise your thesis if research
indicates something else. That is okay. It is part of iteration
process of making your paper better. Then, a separate
“discussion” section, will include your interpretation of the
findings.
These sections are the important contributions that make this
paper more than simply a review paper. You can choose to
make the paper a “literature review” paper, but you will need to
have many citations and still synthesize some meaning from the
review in a “findings” and “discussion” sections.
VI. ConclusionComment by James A Love: The conclusion will
end up being a summary of what all you did in the previous](https://image.slidesharecdn.com/runningheadpoliticsandhealthcasesystemsinuspoliticsand-221111005934-8c790caa/75/Running-Head-POLITICS-AND-HEALTH-CASE-SYSTEMS-IN-USPOLITICS-AND-docx-3-2048.jpg)
![current practices in writing assessment. Multiple
suggestions are offered for clinical and educational
implications, and specific directions are provided for future
research.
S
peech-language pathologists (SLPs) working with
school-age children and adolescents have important
roles in prevention, identification, assessment, and
intervention for problems involving oral and written lan-
guage (American Speech-Language-Hearing Association
[ASHA], 2010). The school context is heavily influenced by
the established curricular standards, and SLPs contribute
their knowledge of language development to support stu-
dents who struggle with the prerequisite language skills to
achieve those standards. A majority of states have adopted
the Common Core State Standards (Common Core State
Standards Initiative, 2010), which include many rigorous
and integrated written language competencies across grade
levels and content areas. Given their specialized knowledge
base in the normal development of writing in the context
of the general education curriculum (ASHA, 2002), SLPs
can inform the assessment, instruction, and intervention of](https://image.slidesharecdn.com/runningheadpoliticsandhealthcasesystemsinuspoliticsand-221111005934-8c790caa/75/Running-Head-POLITICS-AND-HEALTH-CASE-SYSTEMS-IN-USPOLITICS-AND-docx-18-2048.jpg)
![aFlorida State University, Tallahassee
Correspondence to Shannon Hall-Mills: [email protected]
Kenn Apel is now at the University of South Carolina,
Columbia.
Editor: Marilyn Nippold
Associate Editor: Lynne Hewitt
Received April 5, 2014
Revision received August 21, 2014
Accepted April 6, 2015
DOI: 10.1044/2015_LSHSS-14-0043
Disclosure: The authors have declared that no competing
interests existed at the time
of publication.
Language, Speech, and Hearing Services in Schools • Vol. 46 •
242–255 • July 2015 • Copyright © 2015 American Speech-
Language-Hearing Association242
utilize this approach to eliciting student writing. In the basic](https://image.slidesharecdn.com/runningheadpoliticsandhealthcasesystemsinuspoliticsand-221111005934-8c790caa/75/Running-Head-POLITICS-AND-HEALTH-CASE-SYSTEMS-IN-USPOLITICS-AND-docx-20-2048.jpg)
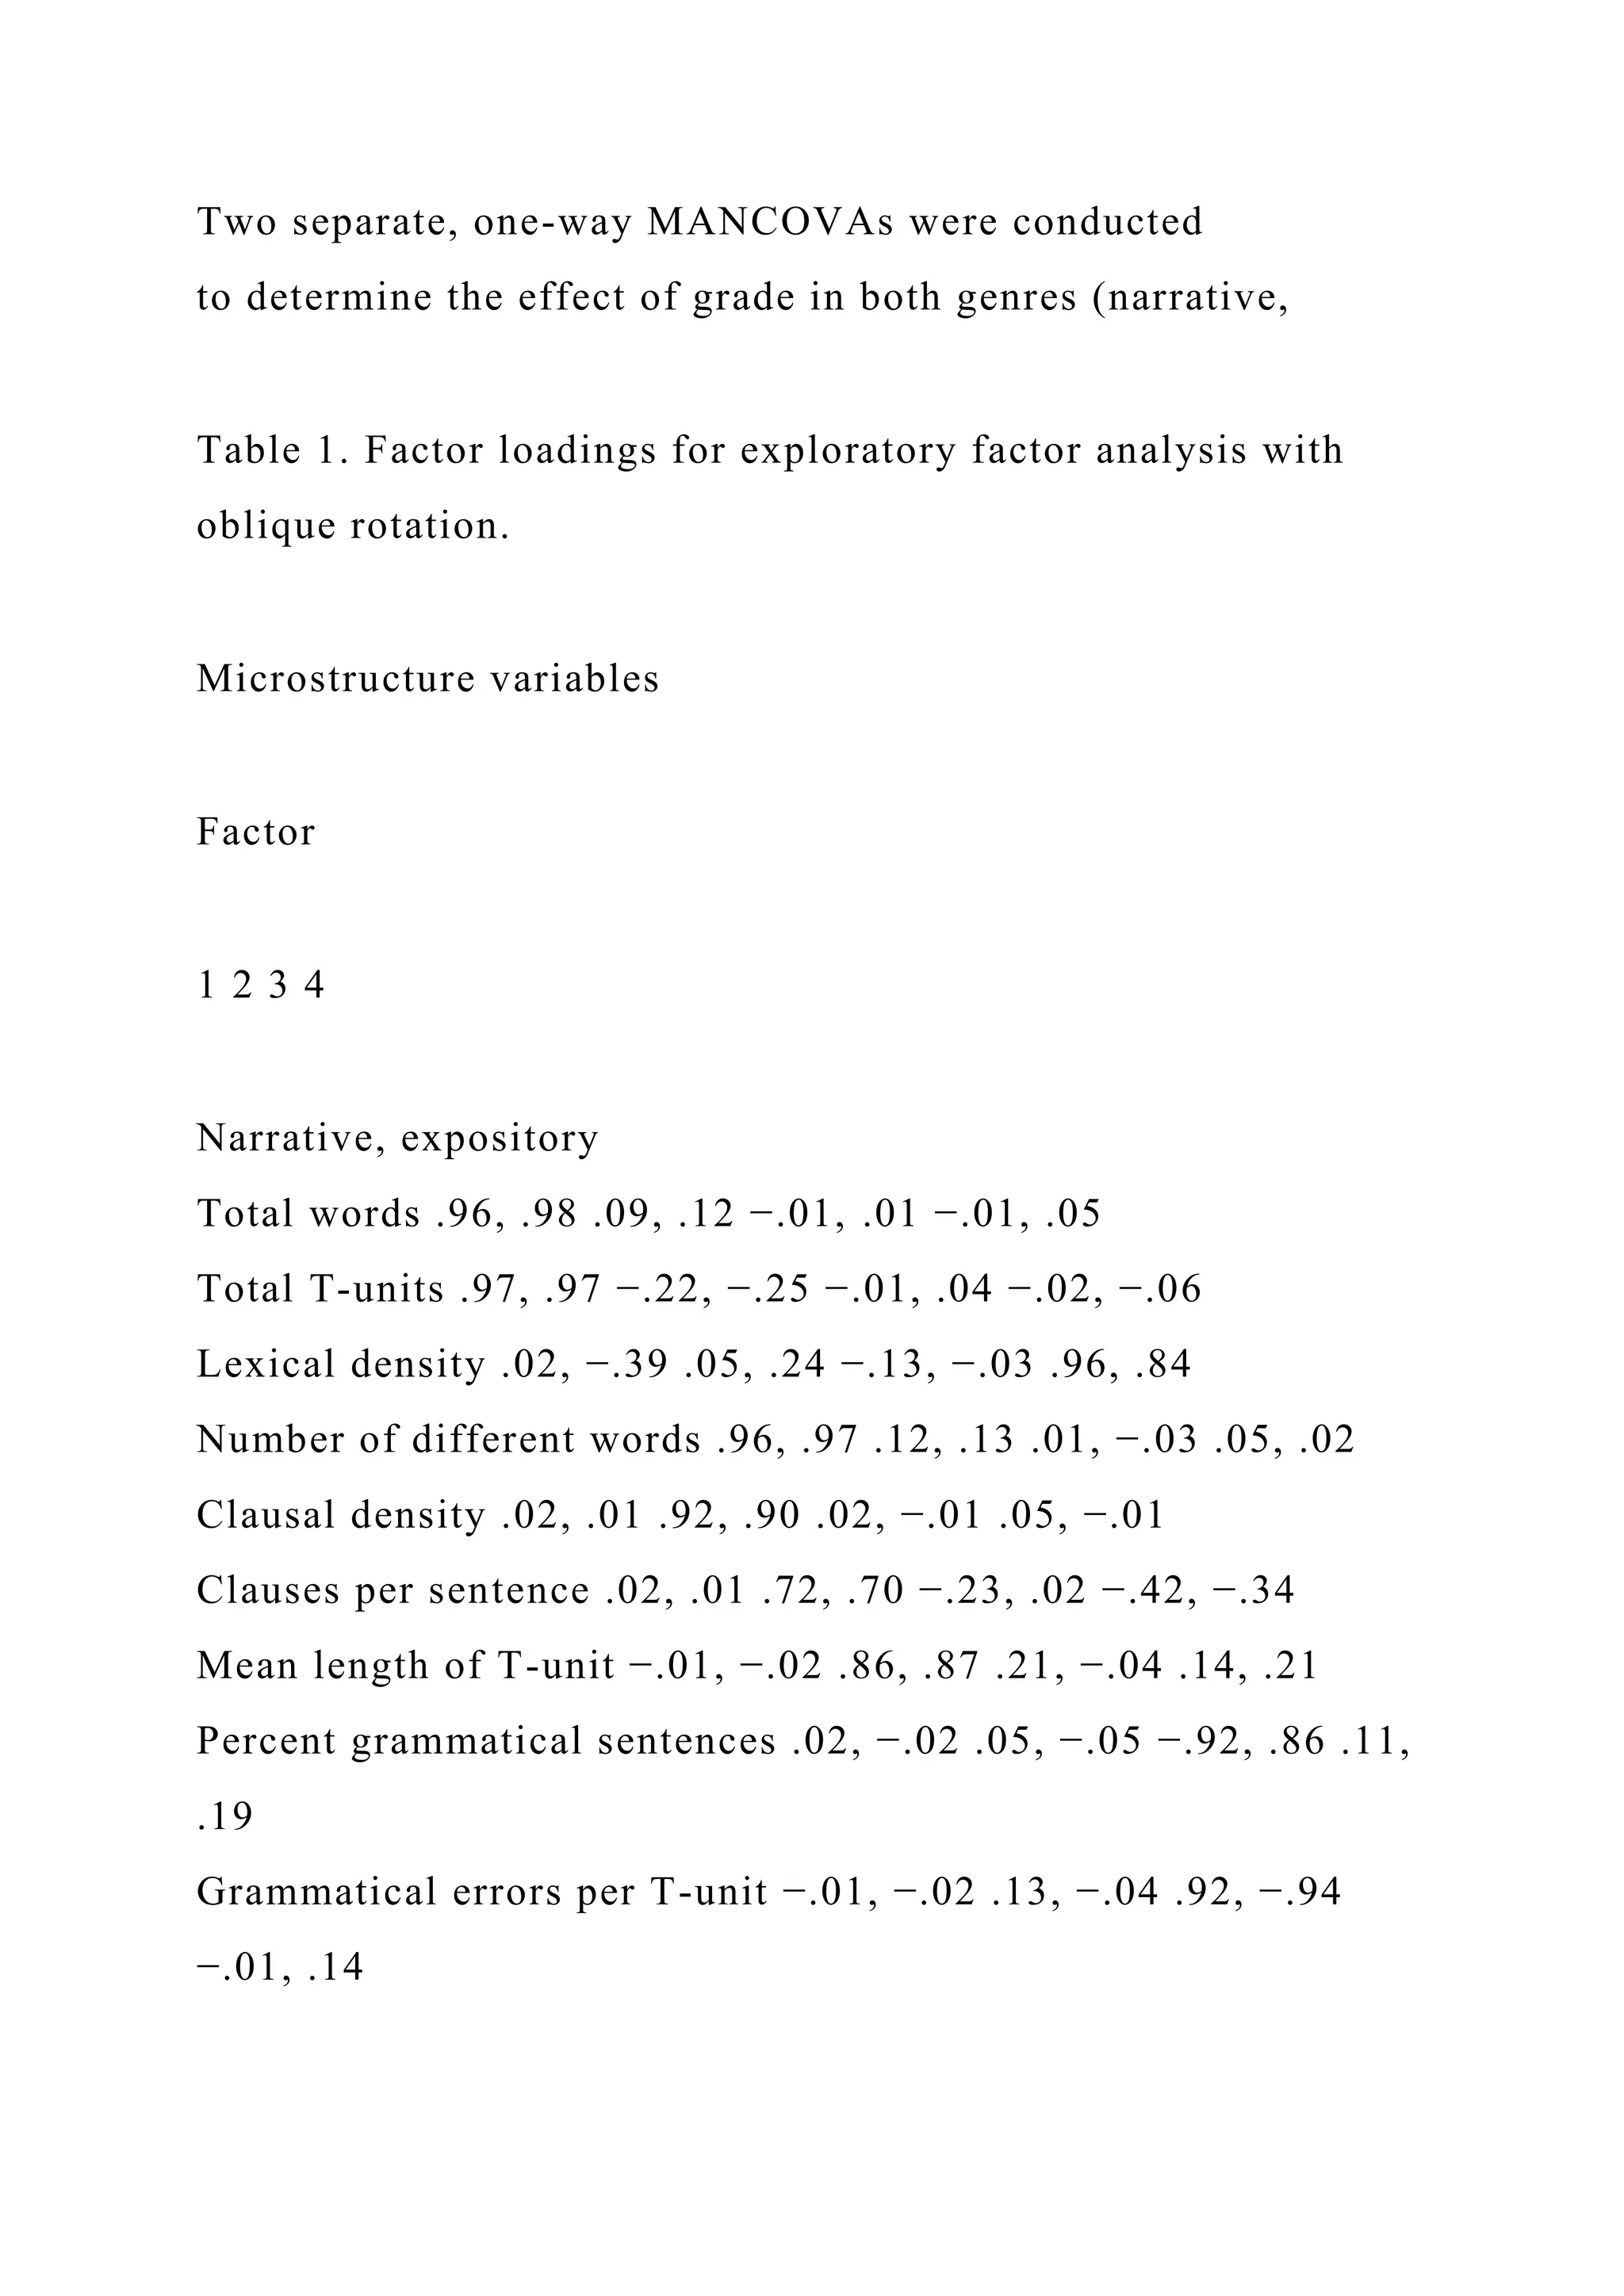
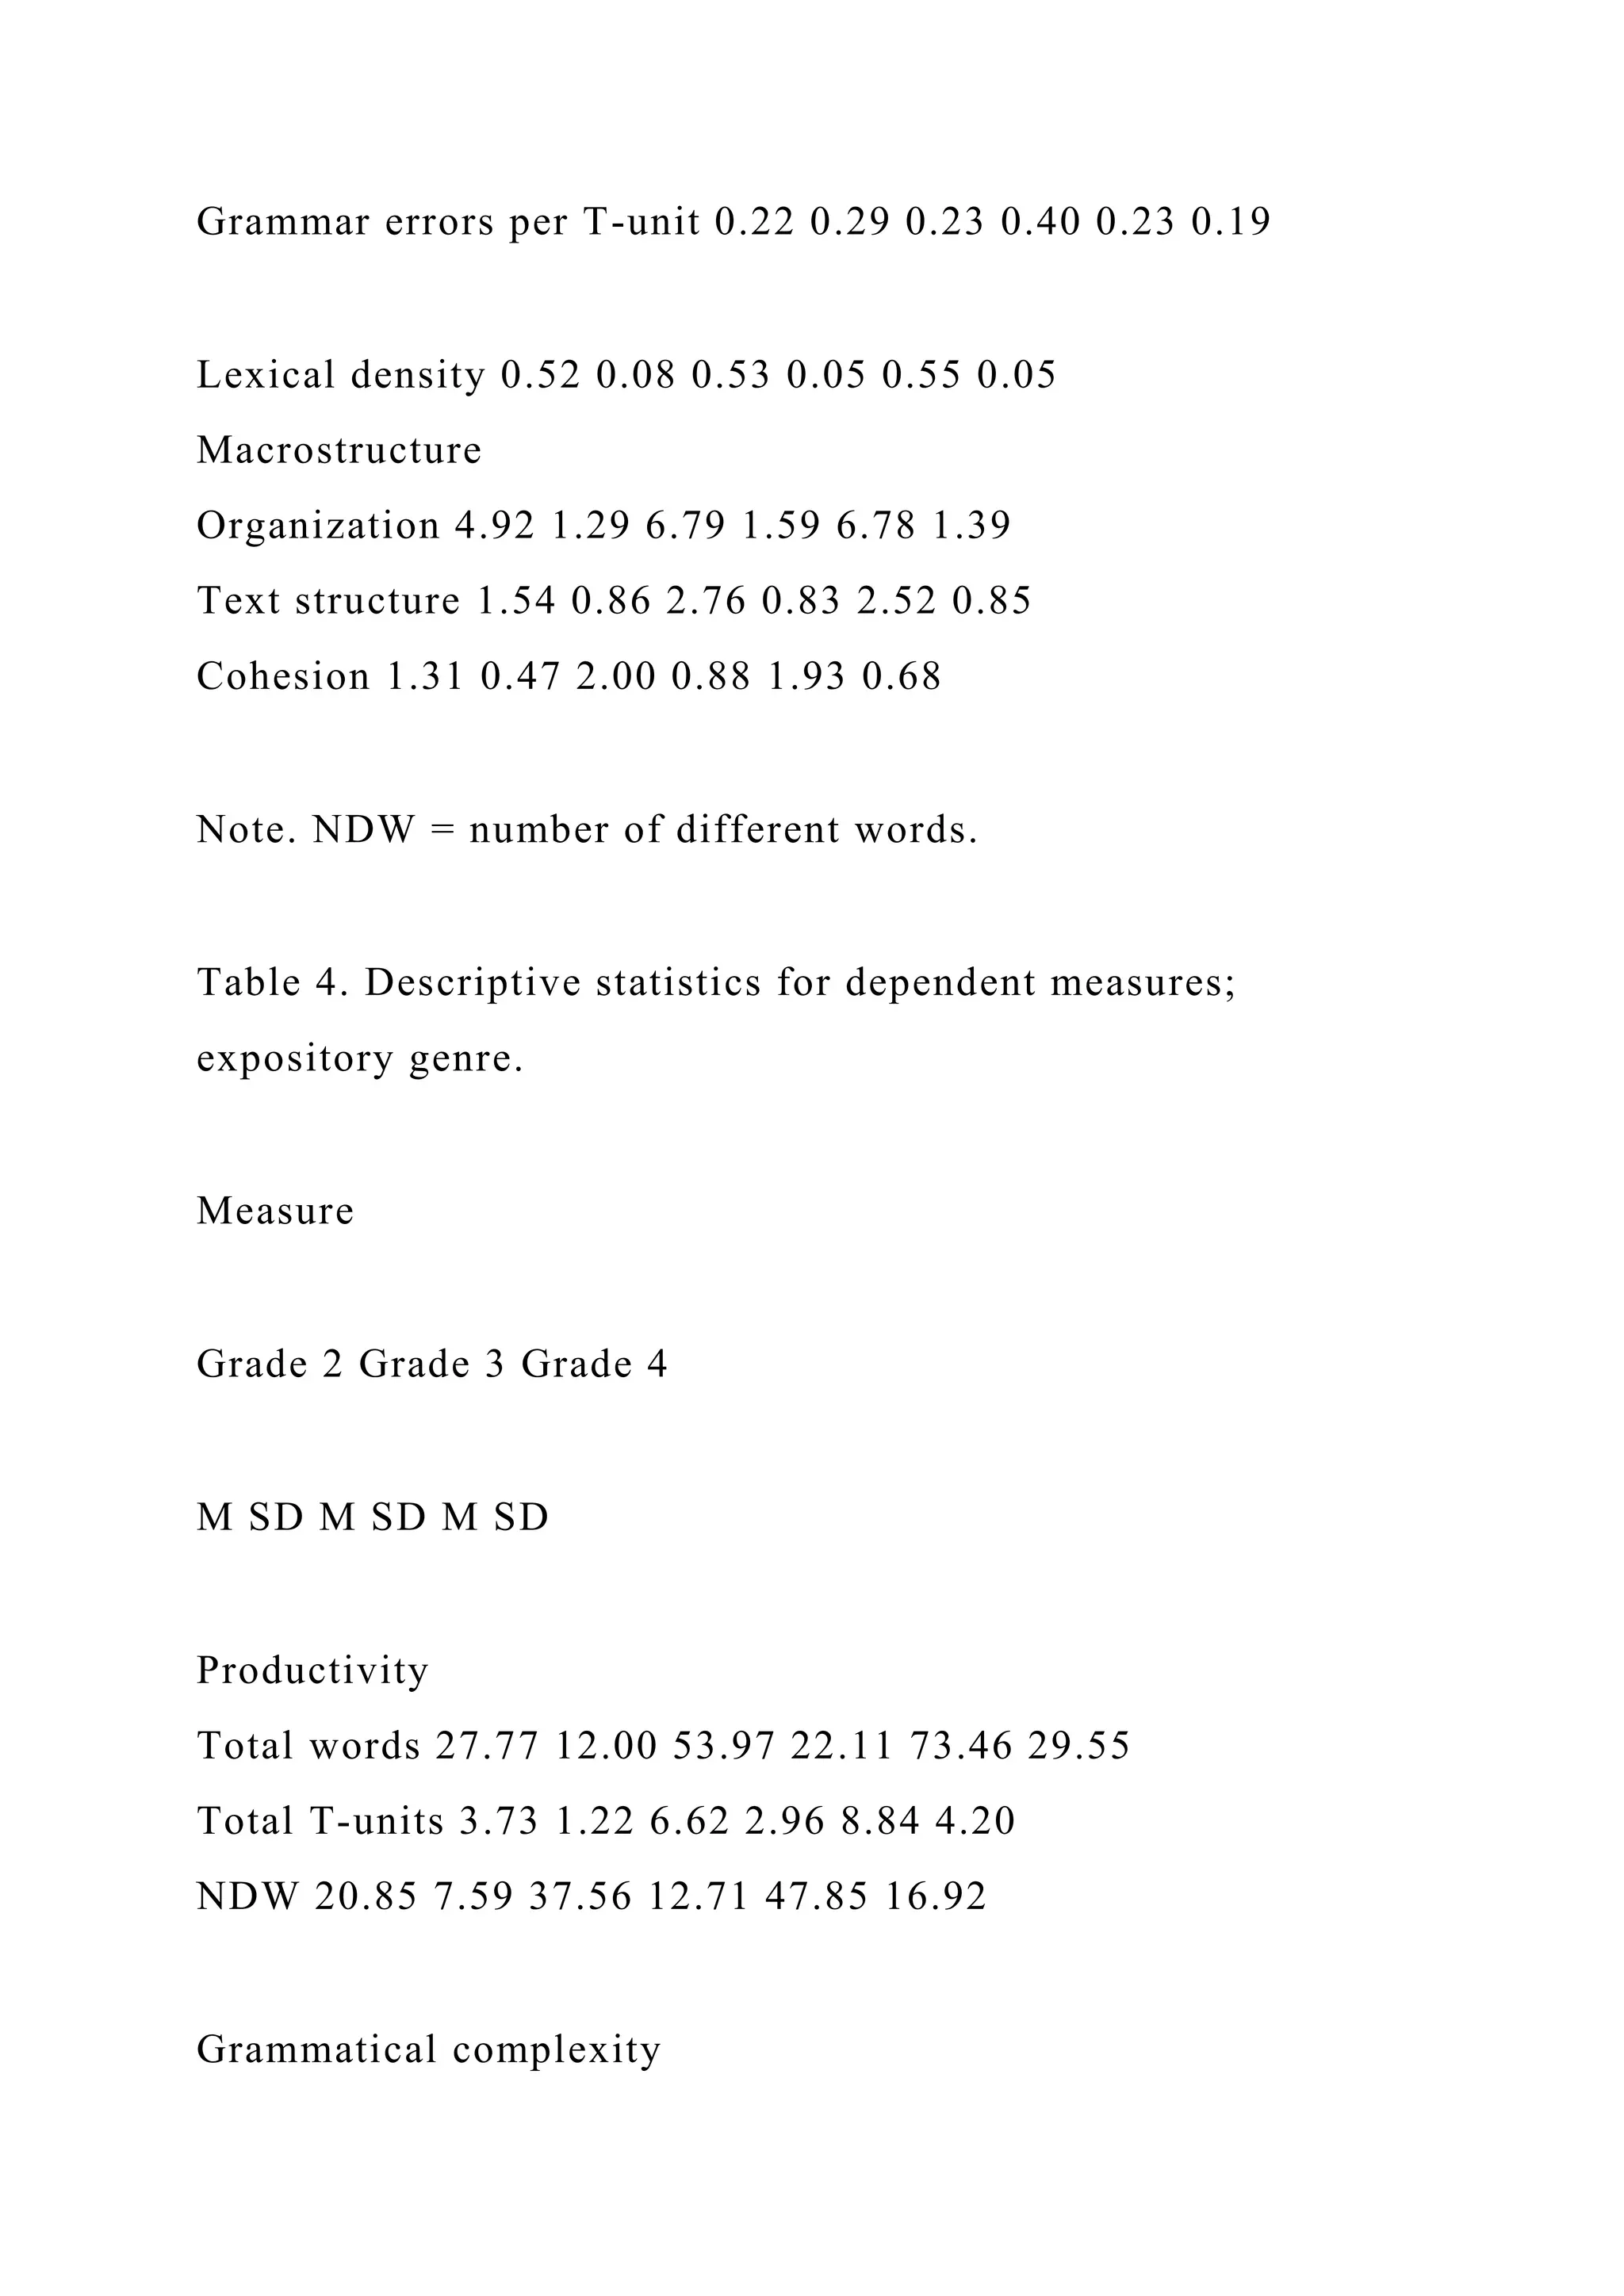
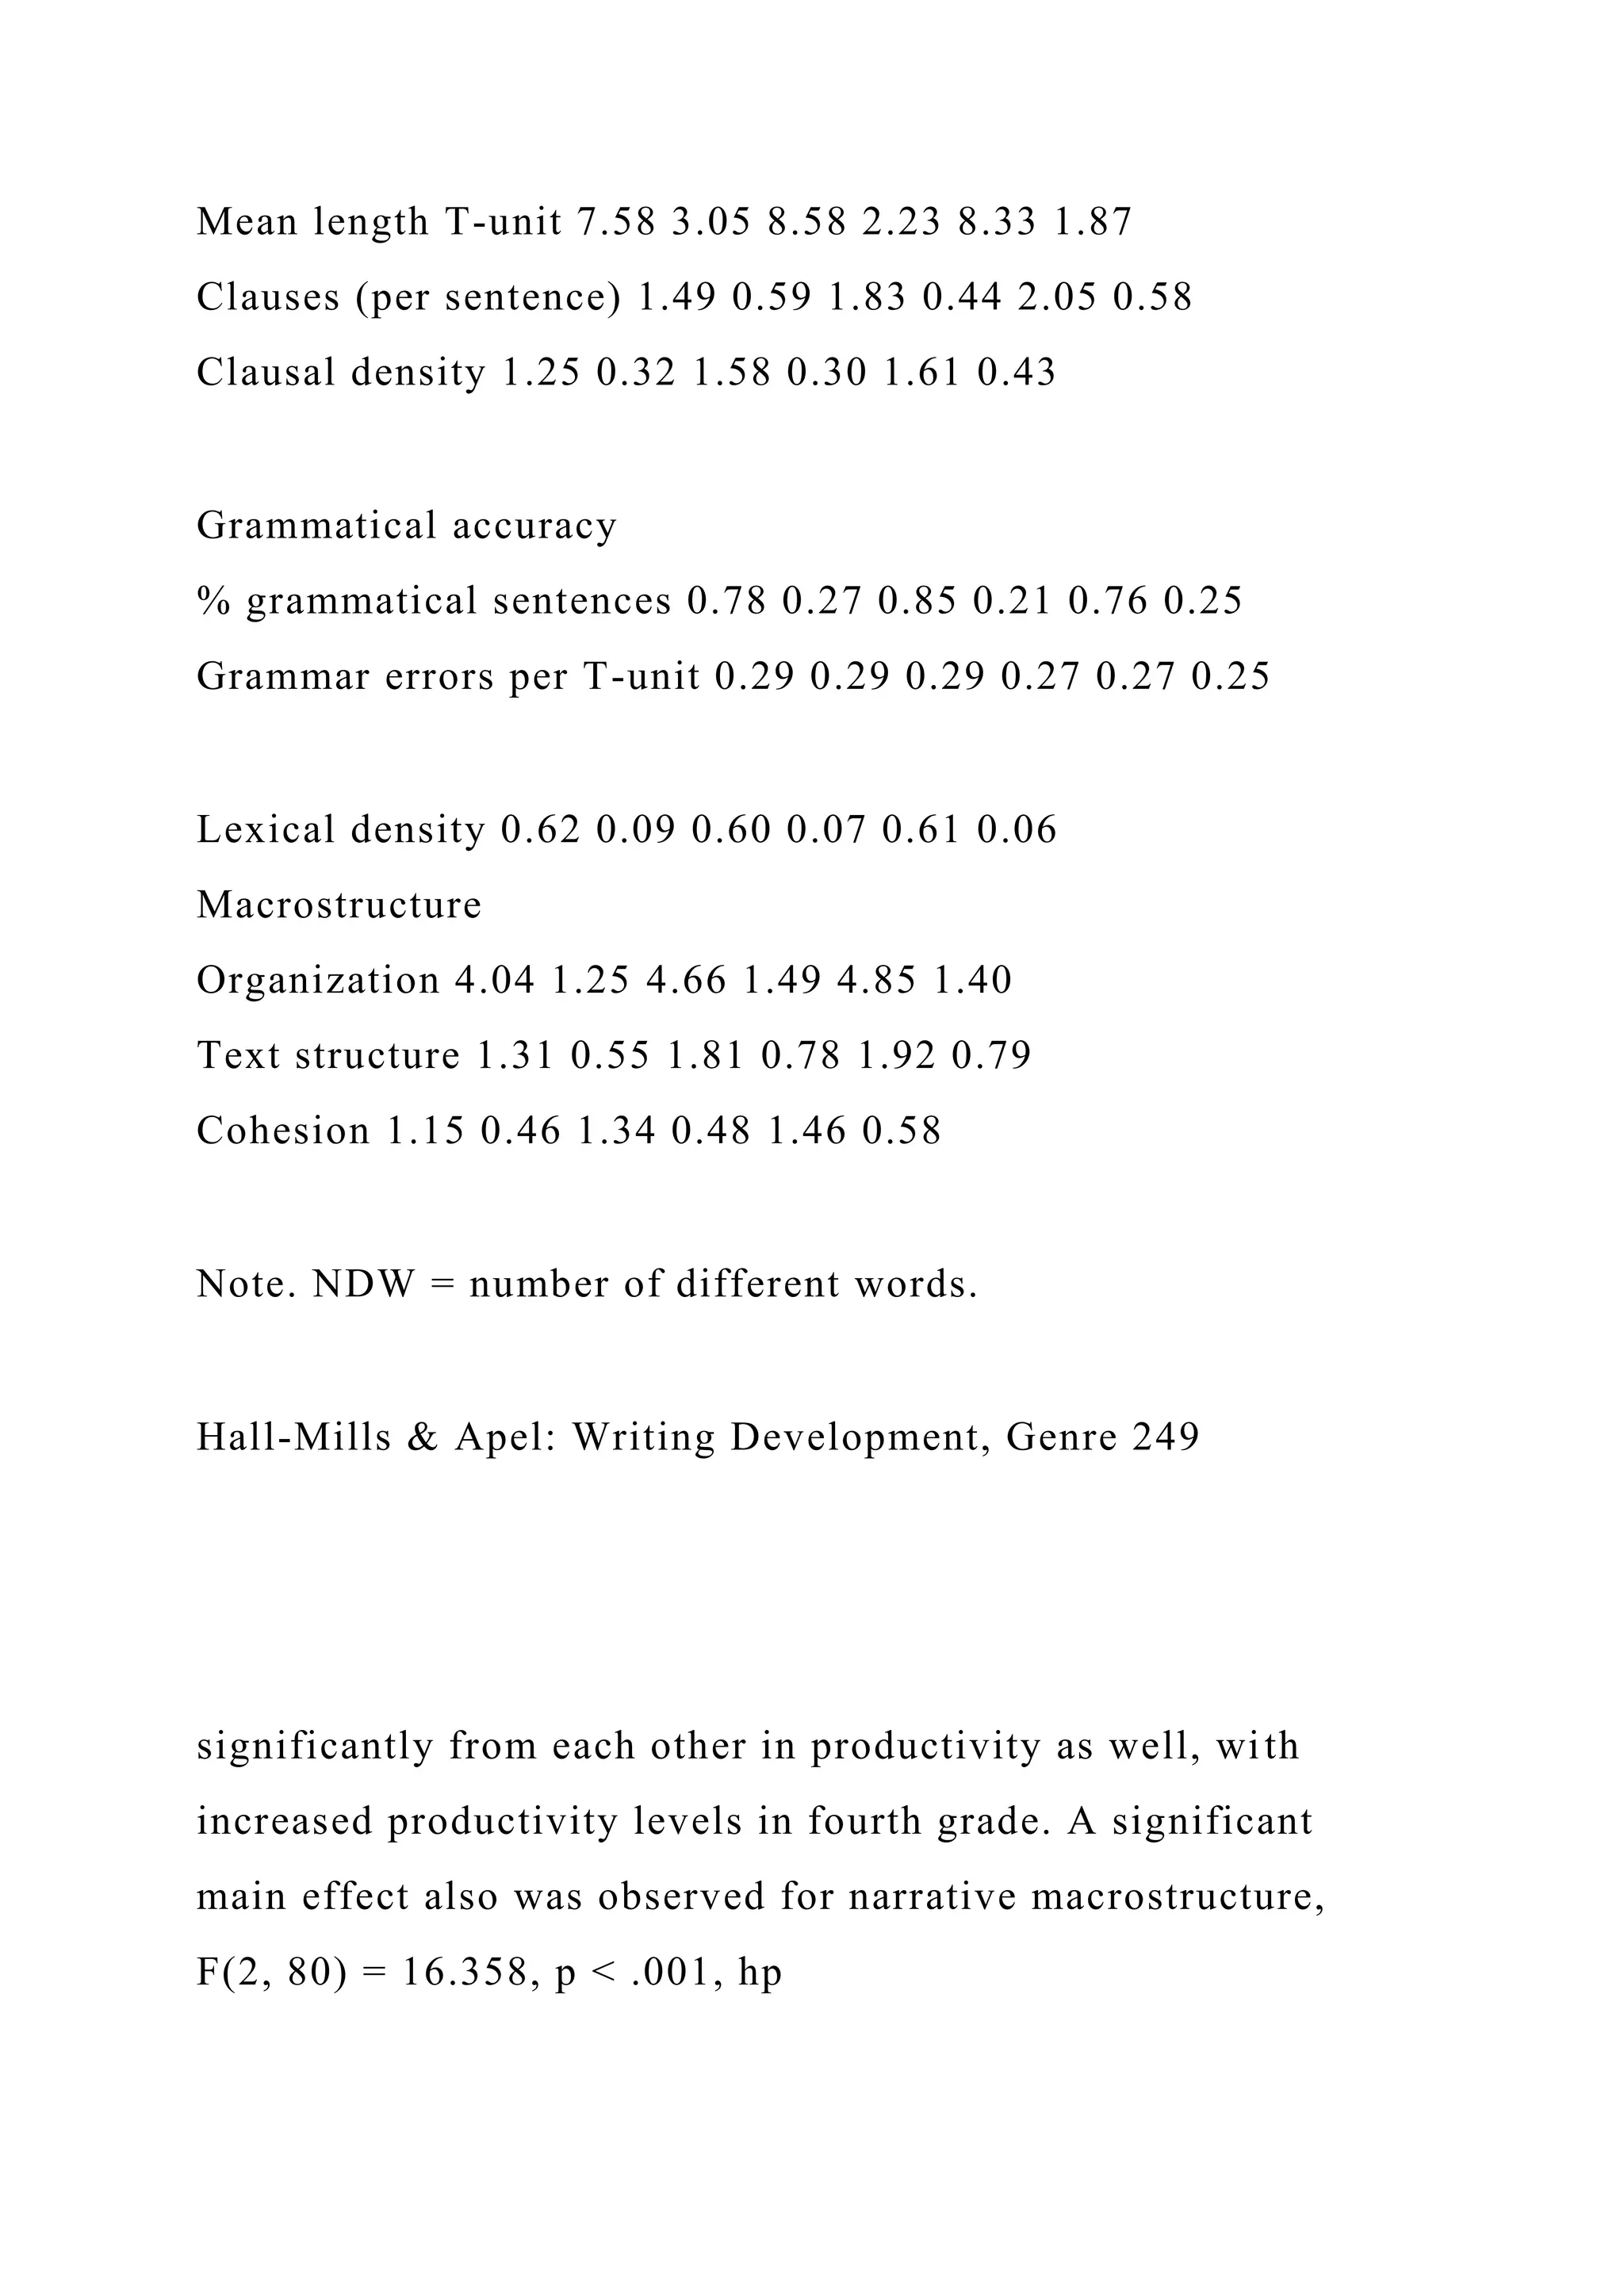
![In summary, analysis of elements of microstructure
in a written product can occur at the word, sentence, and
discourse levels. Microstructure analysis generally includes
measures of productivity (e.g., number of words, T-units, or
ideas), grammatical complexity (e.g., MLTU, clausal den-
sity [CD]), and lexical diversity (e.g., TTR, NDW; Nelson
et al., 2004; Puranik, Lombardino, & Altmann, 2007, 2008).
Taken together, the results of previous investigations sug-
gest that measures of productivity, grammatical complexity,
and lexical diversity are sensitive to age and grade-level dif-
ferences. However, less is known specifically about chil-
dren’s development of certain microstructure elements (e.g.,
productivity, grammatical complexity, lexical diversity) in
early grades (second through fourth), particularly across
genres (e.g., narrative, expository).
Macrostructure
In contrast to microstructure analysis, macrostructure
analysis occurs mainly at the discourse level (Scott, 2009).
Macrostructure is the “abstract representation of the global
meaning structure” which represents the “gist” of the text
(Sanders & Schilperood, 2006, p. 387). Macrostructure
analysis examines a writer’s expression of meaning at the](https://image.slidesharecdn.com/runningheadpoliticsandhealthcasesystemsinuspoliticsand-221111005934-8c790caa/75/Running-Head-POLITICS-AND-HEALTH-CASE-SYSTEMS-IN-USPOLITICS-AND-docx-27-2048.jpg)
![Sentence Comprehension, and Passage Comprehension
subtests were administered, and standard scores were cal-
culated. According to the test manual (Williams, 2001),
the GRADE has an internal consistency of .95 to .99
(coefficient alpha [a]), and test–retest reliability of .89 to .98.
Receptive Vocabulary Task
The PPVT-4 was administered to determine partici-
pants’ receptive vocabulary levels and to corroborate teacher
report of receptive language skills within typical limits. The
test manual indicates that the PPVT-4 has an internal consis-
tency (split-half reliability) of .94 and test–retest reliability of
.92 to .96 (M = .93).
Writing Tasks
Each participant produced one narrative and one ex-
pository writing sample (15 min each). Writing samples
were elicited during group sessions by the first author and
by trained research assistants. Prompts were selected in
accordance with parallel forms of the state-mandated writ-
ing assessment system protocol (Florida Comprehensive
Assessment Test [FCAT]; Florida Department of Educa-
tion, 2010) and the topical interests of the children enrolled](https://image.slidesharecdn.com/runningheadpoliticsandhealthcasesystemsinuspoliticsand-221111005934-8c790caa/75/Running-Head-POLITICS-AND-HEALTH-CASE-SYSTEMS-IN-USPOLITICS-AND-docx-37-2048.jpg)
![Rehabilitative Services (H8435D030046), awarded to the first
author, and a Florida State University Dissertation Research
Grant, also awarded to the first author.
References
American Speech-Language-Hearing Association. (2002).
Knowl-
edge and skills needed by speech-language pathologists with
respect to reading and writing in children and adolescents
[Knowledge and skills]. Available from www.asha.org/policy
American Speech-Language-Hearing Association. (2010). Roles
and responsibilities of speech-language pathologists in schools
[Professional issues statement]. Available from www.asha.org/
policy
Beers, S. F., & Nagy, W. E. (2011). Writing development in
four
genres from grades three to seven: Syntactic complexity and
genre differentiation. Reading and Writing, 24, 183–202.
doi:10.1007s/11145-010-9264-9
Berman, R. A., & Verhoeven, L. (2002). Cross-linguistic
perspec-](https://image.slidesharecdn.com/runningheadpoliticsandhealthcasesystemsinuspoliticsand-221111005934-8c790caa/75/Running-Head-POLITICS-AND-HEALTH-CASE-SYSTEMS-IN-USPOLITICS-AND-docx-75-2048.jpg)
![through
multivariate techniques. Los Angeles, CA: Sage.
Williams, G. J., Larkin, R. F., & Blaggan, S. (2013). Written
language skills in children with specific language impairment.
International Journal of Language and Communication
Disorders,
48(20), 160–171. doi:10.1111/1460-6984.12010
Williams, K. T. (2001). Group Reading Assessment and
Diagnostic
Exam (GRADE). Circle Pines, MN: AGS.
Williams, K. T. (2001). Group Reading Assessment and
Diagnostic
Exam—Technical Manual. Circle Pines, MN: AGS.
Appendix
Narrative and Expository Writing Samples
Second Grade Narrative
Once my sister Lily scared me by hiding on the walls when I
was in the restroom[3CL][CC].
When I came out she went “ROAR”![2CL][CC].](https://image.slidesharecdn.com/runningheadpoliticsandhealthcasesystemsinuspoliticsand-221111005934-8c790caa/75/Running-Head-POLITICS-AND-HEALTH-CASE-SYSTEMS-IN-USPOLITICS-AND-docx-85-2048.jpg)
![It was scary.
and I screamed[2CL][CC].
Then I started to laugh so hard I fell on the ground[2CL][CC].
Third Grade Narrative
One day a man went to McDonald’s to get something to eat
through the drive through[3CL][CC].
When he got his lunch the bag started to shake[2CL][CC].
The hamburger popped out.
and the french fries popped out.
and they grow[GE] and grow[GE] until they became
humongous[4CL][CI].
They took over the world[1CL][SC].
But in a matter of time they shrunk.
and the man had his lunch[2CL][CC].
Fourth Grade Narrative
When I got surprised it was when my cousin told me she broke
her wrist[4CL][CC].
it really happened yesterday[1CL][SC].
she was playing soccer and running backwards and tripped on
grass.
and her hand caught her and broke[5CL][CC].
she is[GE] getting a light green cast[1CL][SI].
Judith wished she broke her other hand.](https://image.slidesharecdn.com/runningheadpoliticsandhealthcasesystemsinuspoliticsand-221111005934-8c790caa/75/Running-Head-POLITICS-AND-HEALTH-CASE-SYSTEMS-IN-USPOLITICS-AND-docx-86-2048.jpg)
![so she didn’t have to write[3CL][CC].
But she broke her left hand[1CL][SC].
Second Grade Expository
I am a superhero.
and I have super powers[2CL][CC].
My power is to turn into lava[1CL][SC].
I can also turn invisible[1CL][SC].
I can use my powers to help save the world[2CL][CC].
When I see a villain, I turn invisible.
and then I burn them up like they are on a grill[4CL][CC].
That is how I save the world[1CL][SC].
Third Grade Expository
Hi my name is Gardenia[1CL][SC].
I have the powers to make things grow right after I plant the
seeds[3CL][CC]!
I would like to help the Earth by turning landfills into beautiful
gardens[2CL][CC].
That’s all I have to say for today, bye[2CL][CC].
Fourth Grade Expository
I am a superhero named Superman[1CL][SC].
My special powers are that I am very strong.
and I can beat up everyone.](https://image.slidesharecdn.com/runningheadpoliticsandhealthcasesystemsinuspoliticsand-221111005934-8c790caa/75/Running-Head-POLITICS-AND-HEALTH-CASE-SYSTEMS-IN-USPOLITICS-AND-docx-87-2048.jpg)
![and I can fly[4CL][CC].
I will help the world by beating up evil villains and arresting
people[3CL][CC].
I will help elderly people cross the road and give money to
banks, homeless shelters, nursing homes, and
orphans[2CL][CC].
That is who I am and how I will help the world[2CL][CC].
Note. CC = complex correct sentence; CL = clause for number
of clauses; SC = simple correct sentence; SI = simple incorrect
sentence.
Hall-Mills & Apel: Writing Development, Genre 255
Copyright of Language, Speech & Hearing Services in Schools
is the property of American
Speech-Language-Hearing Association and its content may not
be copied or emailed to
multiple sites or posted to a listserv without the copyright
holder's express written permission.
However, users may print, download, or email articles for
individual use.](https://image.slidesharecdn.com/runningheadpoliticsandhealthcasesystemsinuspoliticsand-221111005934-8c790caa/75/Running-Head-POLITICS-AND-HEALTH-CASE-SYSTEMS-IN-USPOLITICS-AND-docx-88-2048.jpg)
![2010 Levy Avenue, Suite 100, Tallahassee, FL 32310, USA
e-mail: [email protected]
Y. Petscher
Florida Center for Reading Research, Florida State University,
2010 Levy Avenue, Suite 100,
Tallahassee, FL 32310, USA
S. Al Otaiba
Simmons School of Education and Human Development,
Southern Methodist University, University
Park, TX, USA
123
Read Writ (2014) 27:1163–1188
DOI 10.1007/s11145-013-9480-1](https://image.slidesharecdn.com/runningheadpoliticsandhealthcasesystemsinuspoliticsand-221111005934-8c790caa/75/Running-Head-POLITICS-AND-HEALTH-CASE-SYSTEMS-IN-USPOLITICS-AND-docx-92-2048.jpg)


![(e.g., ‘‘I eat and play [STOP] and go outside and laugh [STOP]
and draw pictures.’’
counted as three sentences). For calculating the number of ideas
in a student’s
writing sample, only ideas that could be identified in the
writing were counted, Ideas
required a subject and a predicate, but could use a common
subject/verb (e.g., ‘‘I
like playing’’ would be scored as one idea; ‘‘I like playing and
writing’’ would count
as two ideas). Repeated ideas were only counted once. These
scoring measures for
writing fluency (i.e., production) have been utilized in previous
studies with students
in the earliest grades (Kim et al., 2011, in press).
In the spring of first grade, students were asked to compose a
brief narrative text](https://image.slidesharecdn.com/runningheadpoliticsandhealthcasesystemsinuspoliticsand-221111005934-8c790caa/75/Running-Head-POLITICS-AND-HEALTH-CASE-SYSTEMS-IN-USPOLITICS-AND-docx-130-2048.jpg)

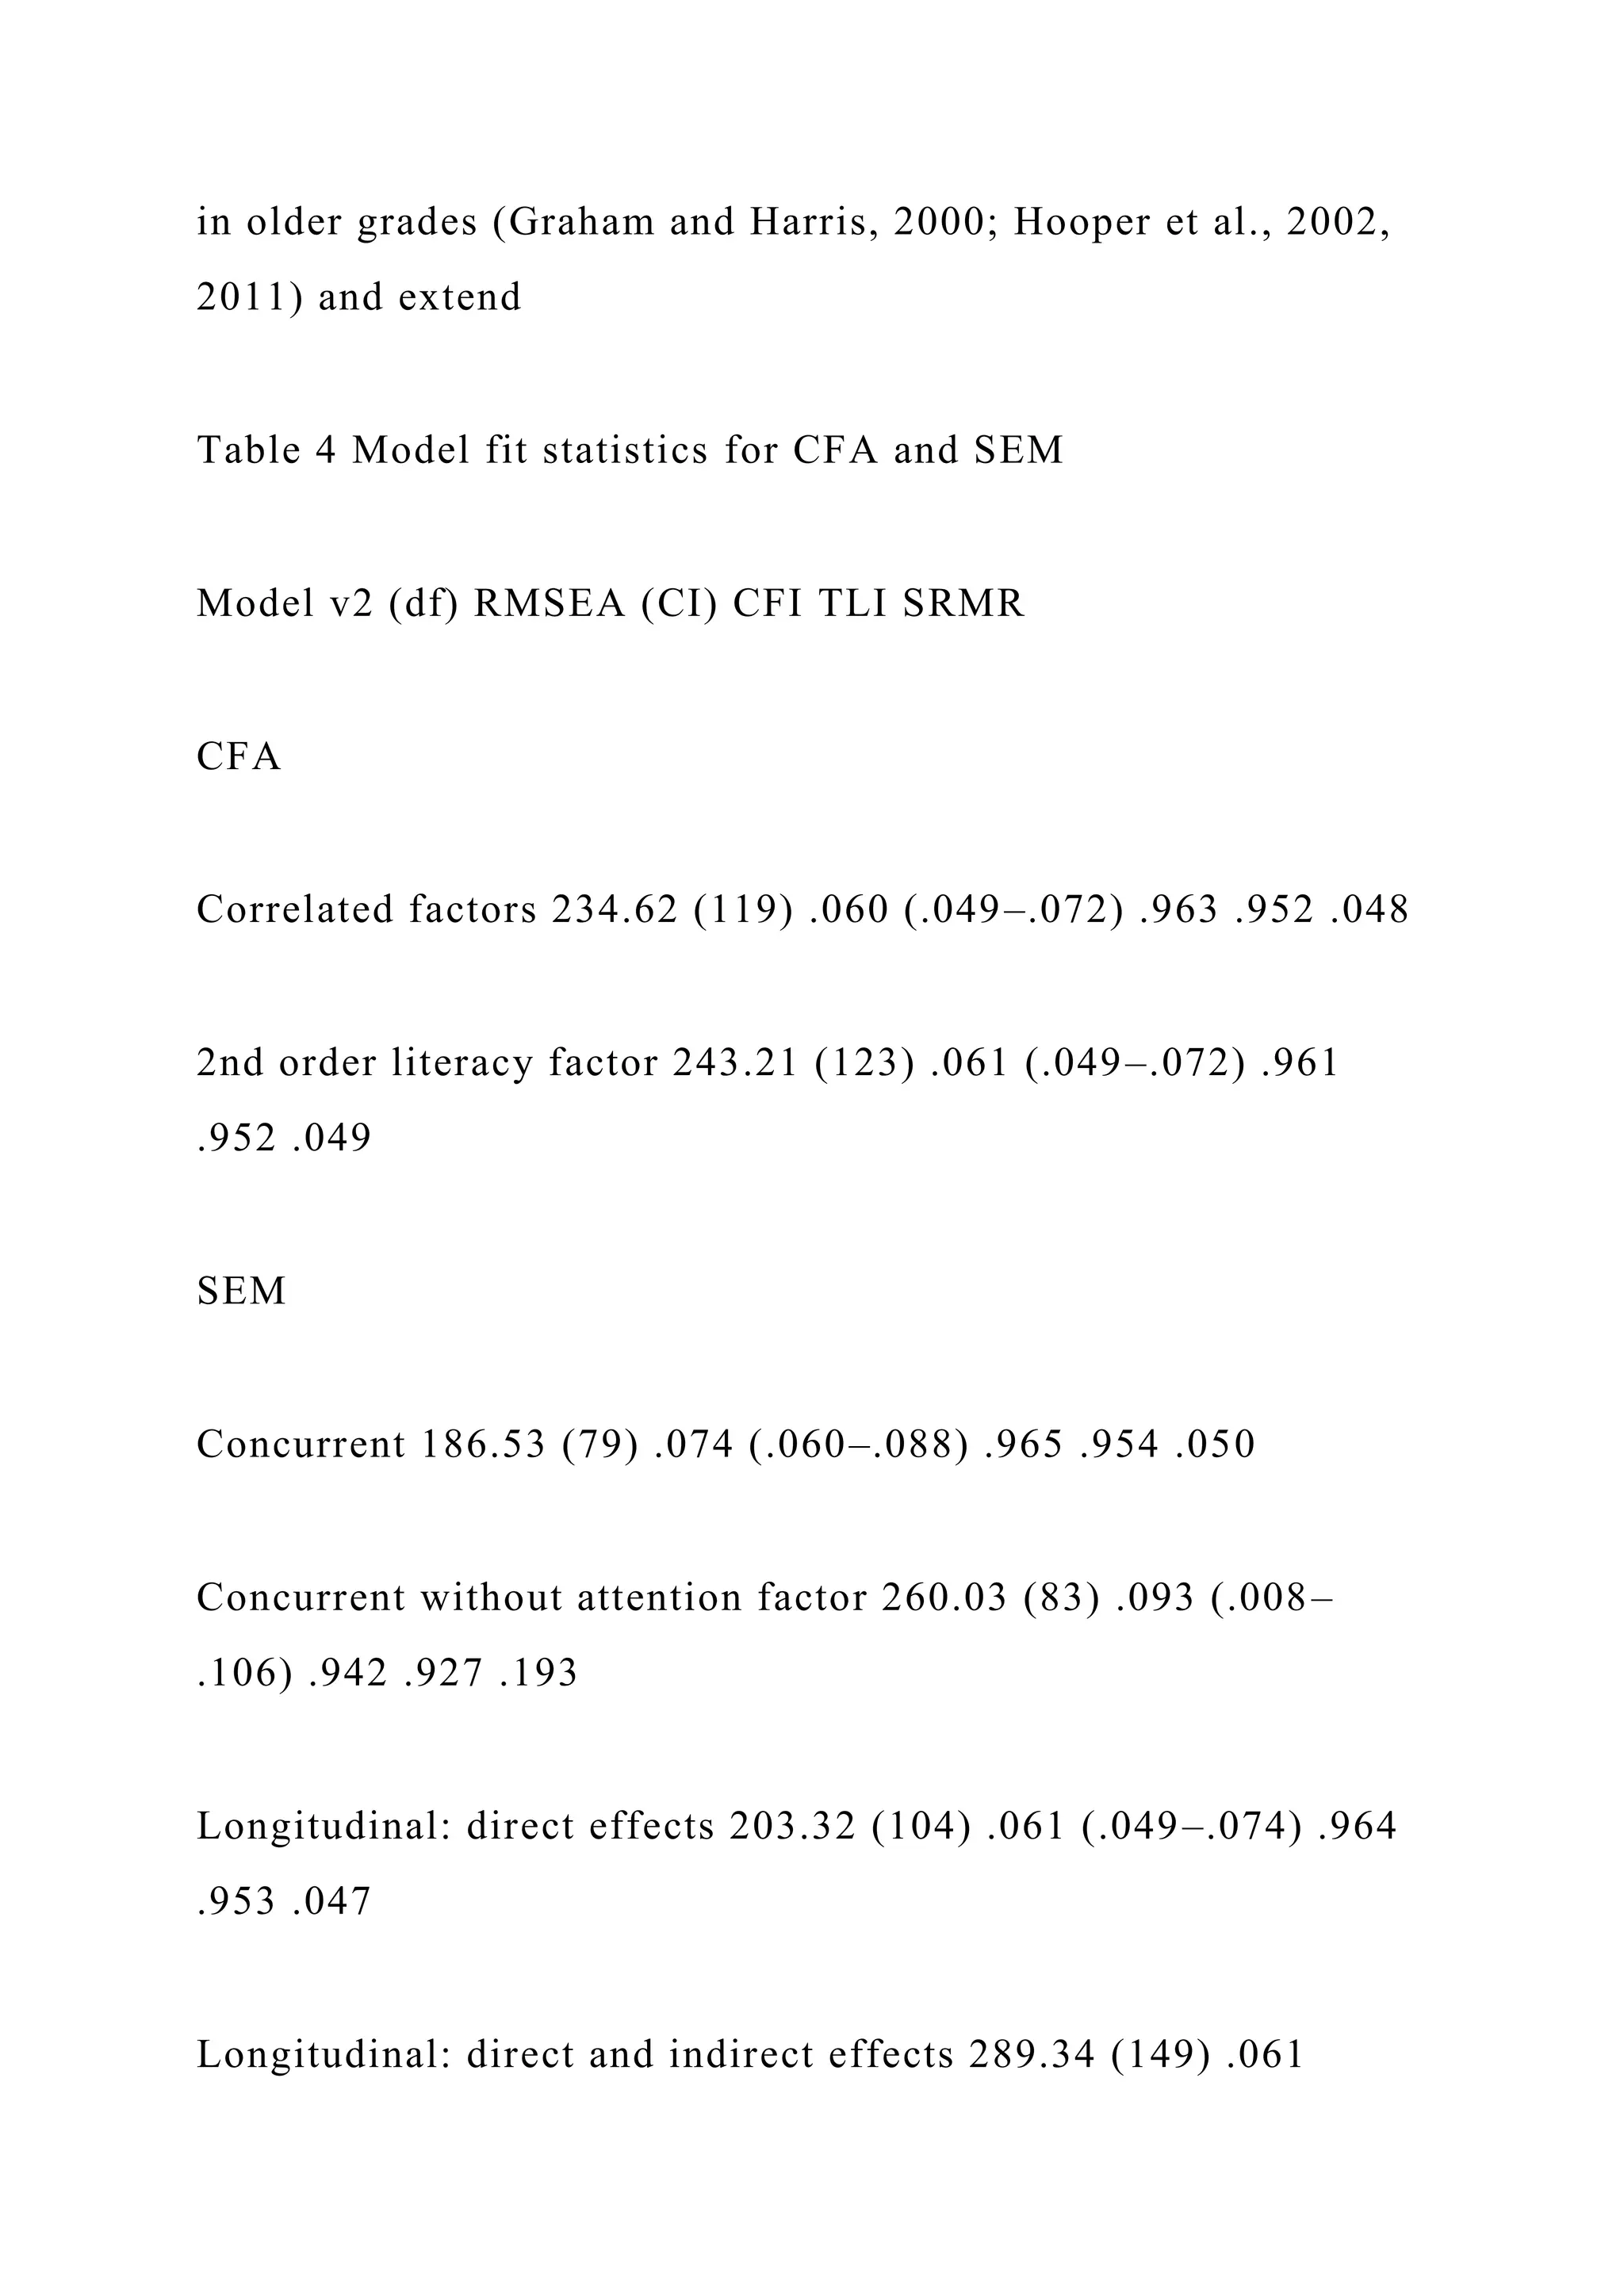
![each observed variable
1172 S. Kent et al.
123
(i.e., [1 - reliability] 9 r2). Multiple indices were evaluated to
assess model fit
including Chi square, root mean square error of approximation
(RMSEA),
comparative fit index (CFI), Tucker-Lewis Index (TLI), and
standardized root
mean square residuals (SRMR). Given that Chi square values
tend to be influenced
by sample size, RMSEA values below .085, CFI/TLI values
greater than .95, and
SRMR below .05 indicate excellent model fit (Kline, 2011).
To account for the non-independence of observations, cluster-](https://image.slidesharecdn.com/runningheadpoliticsandhealthcasesystemsinuspoliticsand-221111005934-8c790caa/75/Running-Head-POLITICS-AND-HEALTH-CASE-SYSTEMS-IN-USPOLITICS-AND-docx-139-2048.jpg)

![variables, all of which were statistically significant (p .01).
Measurement model
Initial evaluation of the fit indices for the proposed
measurement model indicated
excellent data fit: v2 (119) = 234.62, p = .000; CFI = .963; TLI
= .952;
RMSEA = .060 (CI [.049, .072]); and SRMR = .048. All
predictor factors were
significantly and positively related to one another (.33 B r B
.95) and with writing
in kindergarten and first grade, with generally moderate
correlations (see Table 3).
Predictors of kindergarten and first grade writing 1173
123](https://image.slidesharecdn.com/runningheadpoliticsandhealthcasesystemsinuspoliticsand-221111005934-8c790caa/75/Running-Head-POLITICS-AND-HEALTH-CASE-SYSTEMS-IN-USPOLITICS-AND-docx-143-2048.jpg)


![For this reason, CFA was used to examine whether an
alternative model with a
second-order ‘‘literacy’’ might better explain the data than the
existing correlated
factors model. The alternative model also demonstrated good fit
[v2 (123) = 243.21,
p = .000; CFI = .961; TLI = .952; RMSEA = .061 (CI [.049,
.072]); and
SRMR = .049]. Results from a Chi square difference test (Dv2 =
8.84, df = 4,
p = .065) suggest this more parsimonious model would be
preferred and thus, was
used in subsequent analyses.
1
Figure 1 displays factor loadings for each latent factor.
Research questions 1 and 2
The first research question addressed the unique and shared](https://image.slidesharecdn.com/runningheadpoliticsandhealthcasesystemsinuspoliticsand-221111005934-8c790caa/75/Running-Head-POLITICS-AND-HEALTH-CASE-SYSTEMS-IN-USPOLITICS-AND-docx-210-2048.jpg)
![relations of component
skills of writing fluency in kindergarten. Standardized
parameter estimates and
standard errors for the hypothesized SEM of writing production
in kindergarten, are
presented in Fig. 2a. Results suggested good model fit: v2 (79)
= 186.53, p = .000;
CFI = .965; TLI = .954; RMSEA = .076 (CI [.062, .090]); and
SRMR = .050.
Literacy (i.e., reading and spelling), letter-writing fluency, oral
language, and
attention were all positively related to one another (u range =
.35-.57, ps .01).
Attention-related skills (c = .16, p = .001) exhibited a unique
and statistically
significant relation to kindergarten composition fluency after
controlling for
literacy, handwriting fluency, and oral language. Early literacy
skill in reading](https://image.slidesharecdn.com/runningheadpoliticsandhealthcasesystemsinuspoliticsand-221111005934-8c790caa/75/Running-Head-POLITICS-AND-HEALTH-CASE-SYSTEMS-IN-USPOLITICS-AND-docx-211-2048.jpg)
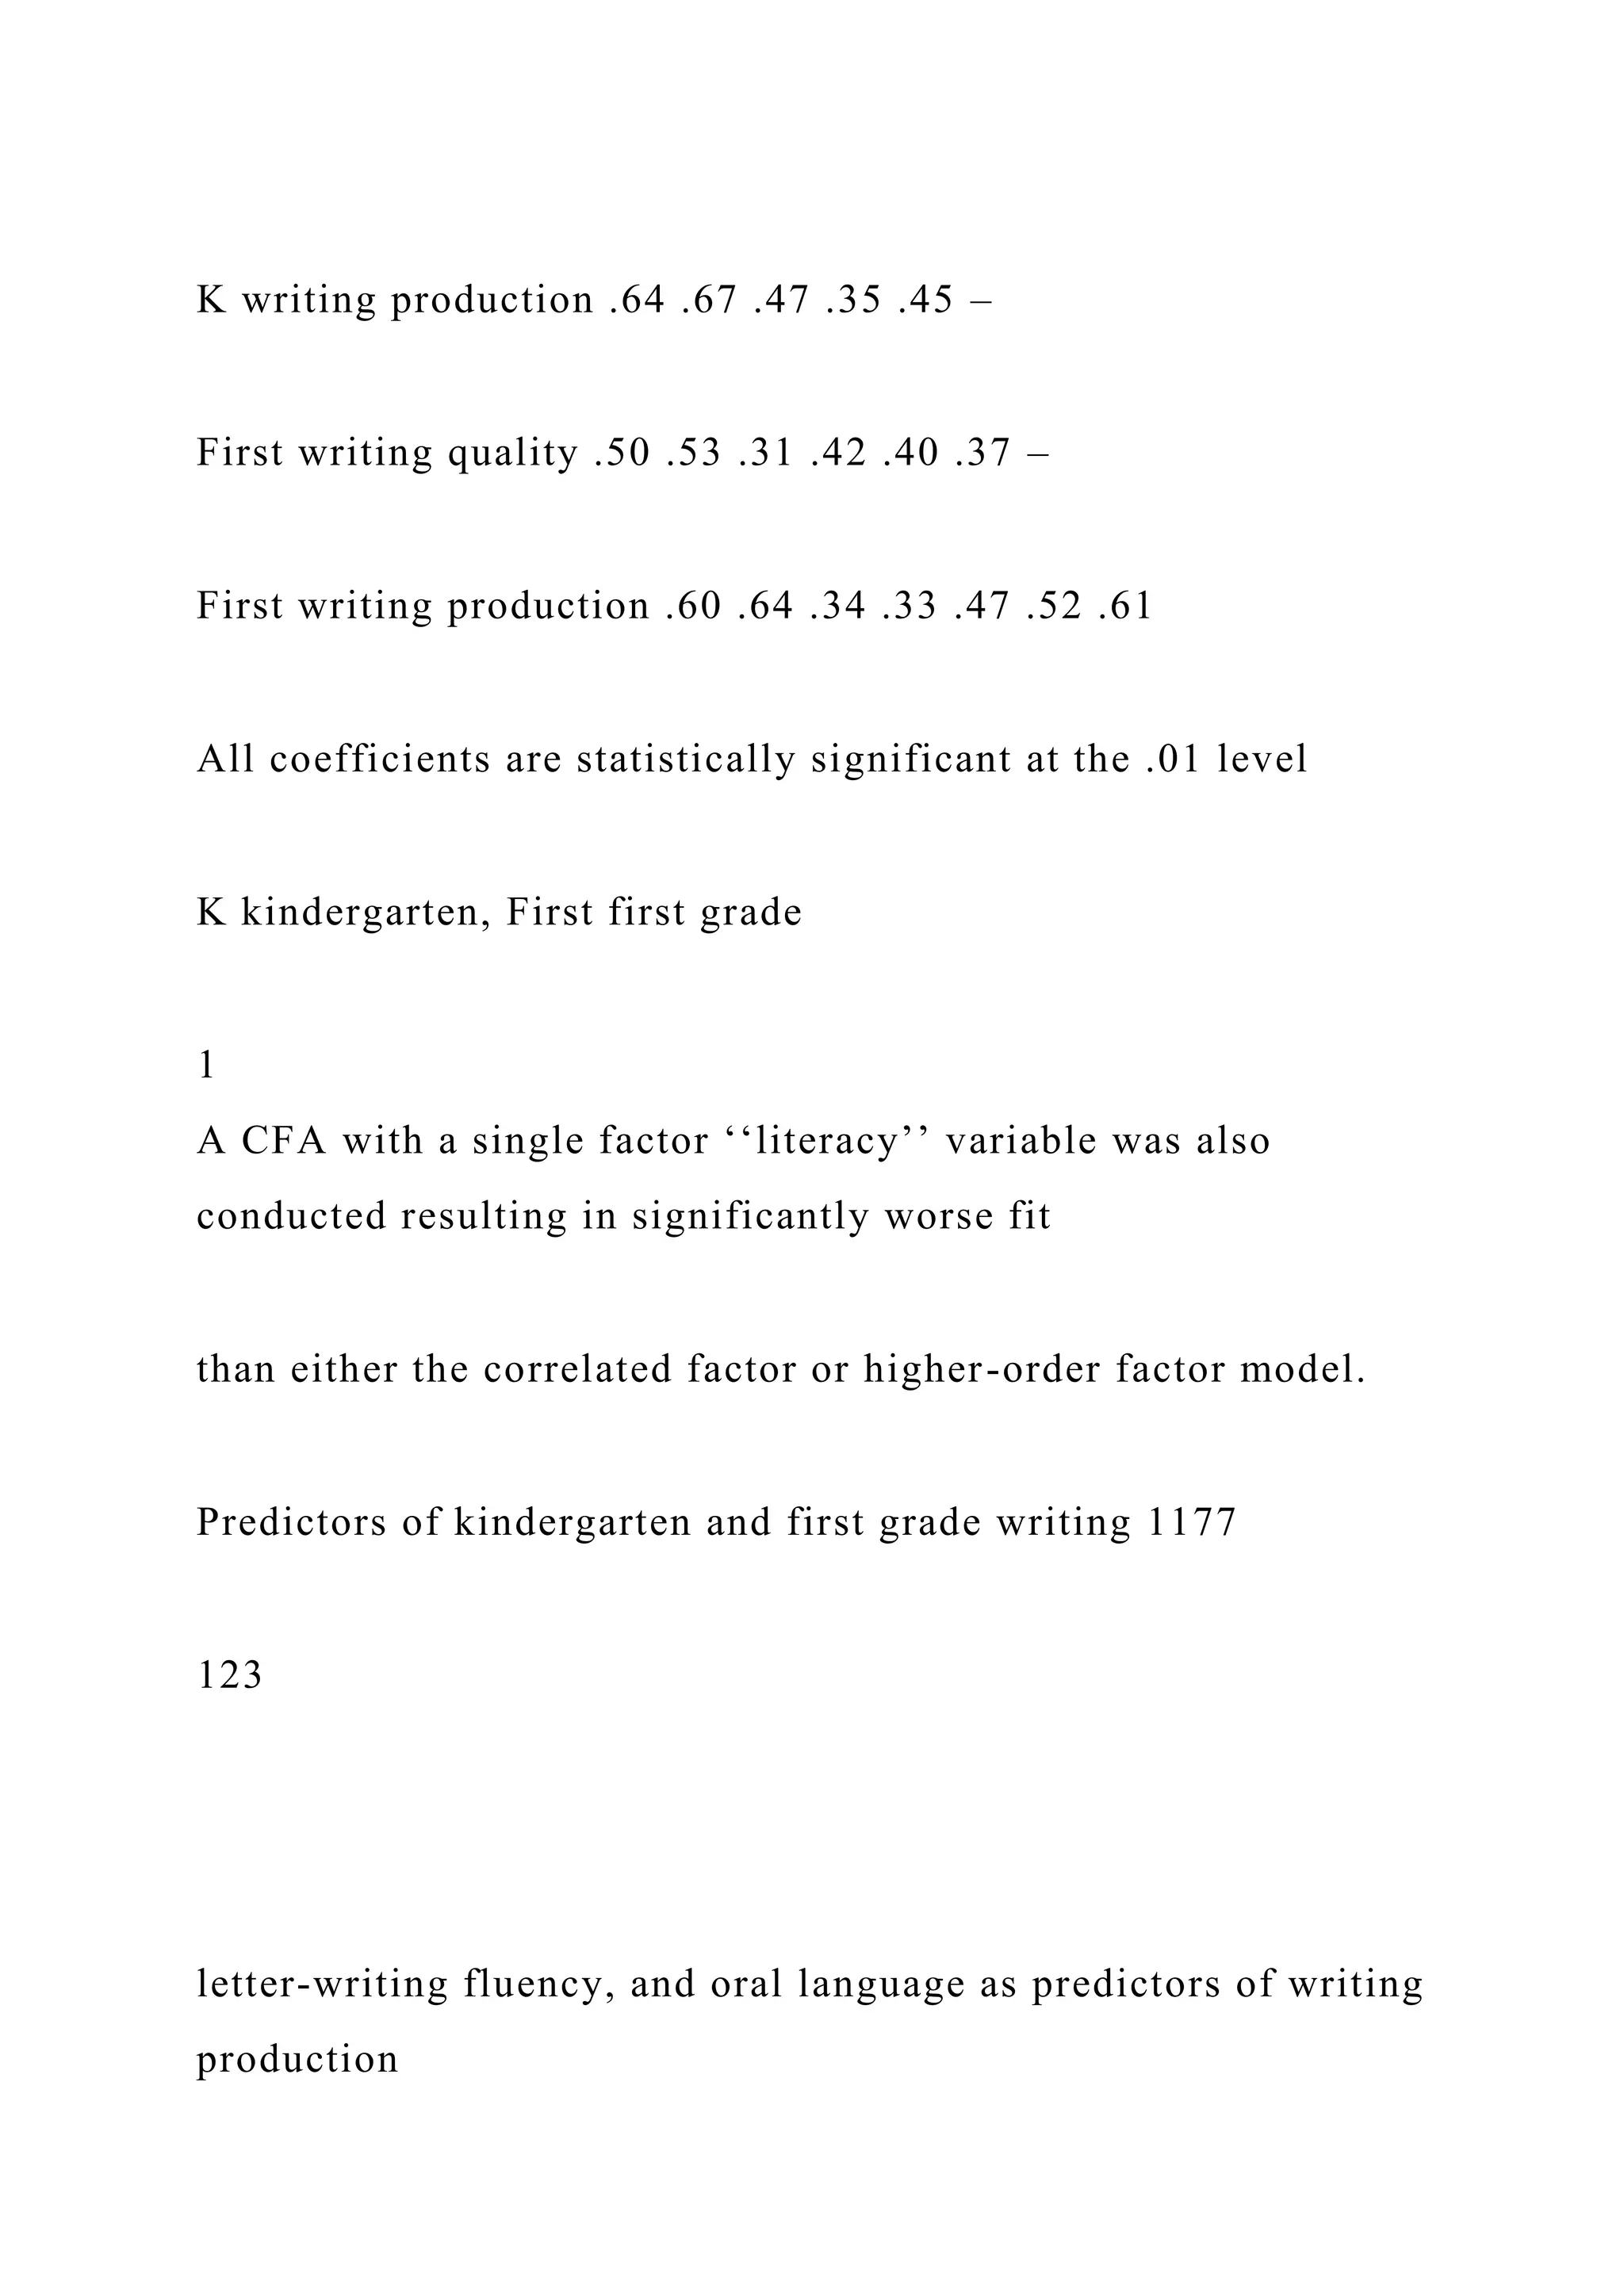
![(Fig. 2b). The model including attention had a statistically
significant better fit than
a model without this factor (Dv2 = 73.5, df = 4, p .001)
supporting its inclusion.
Research question 3
The third research question considered the longitudinal relations
of kindergarten
component skills to first grade writing. As presented in Fig. 3, a
SEM predicting
compositional fluency and quality in first grade from
kindergarten component skills
exhibited excellent fit: v2 (104) = 203.32, p = .000; CFI = .964;
TLI = .953;
RMSEA = .061 (CI [.049, .074]); and SRMR = .047. In this
longitudinal model,
attention in kindergarten was uniquely related to both
compositional fluency](https://image.slidesharecdn.com/runningheadpoliticsandhealthcasesystemsinuspoliticsand-221111005934-8c790caa/75/Running-Head-POLITICS-AND-HEALTH-CASE-SYSTEMS-IN-USPOLITICS-AND-docx-215-2048.jpg)
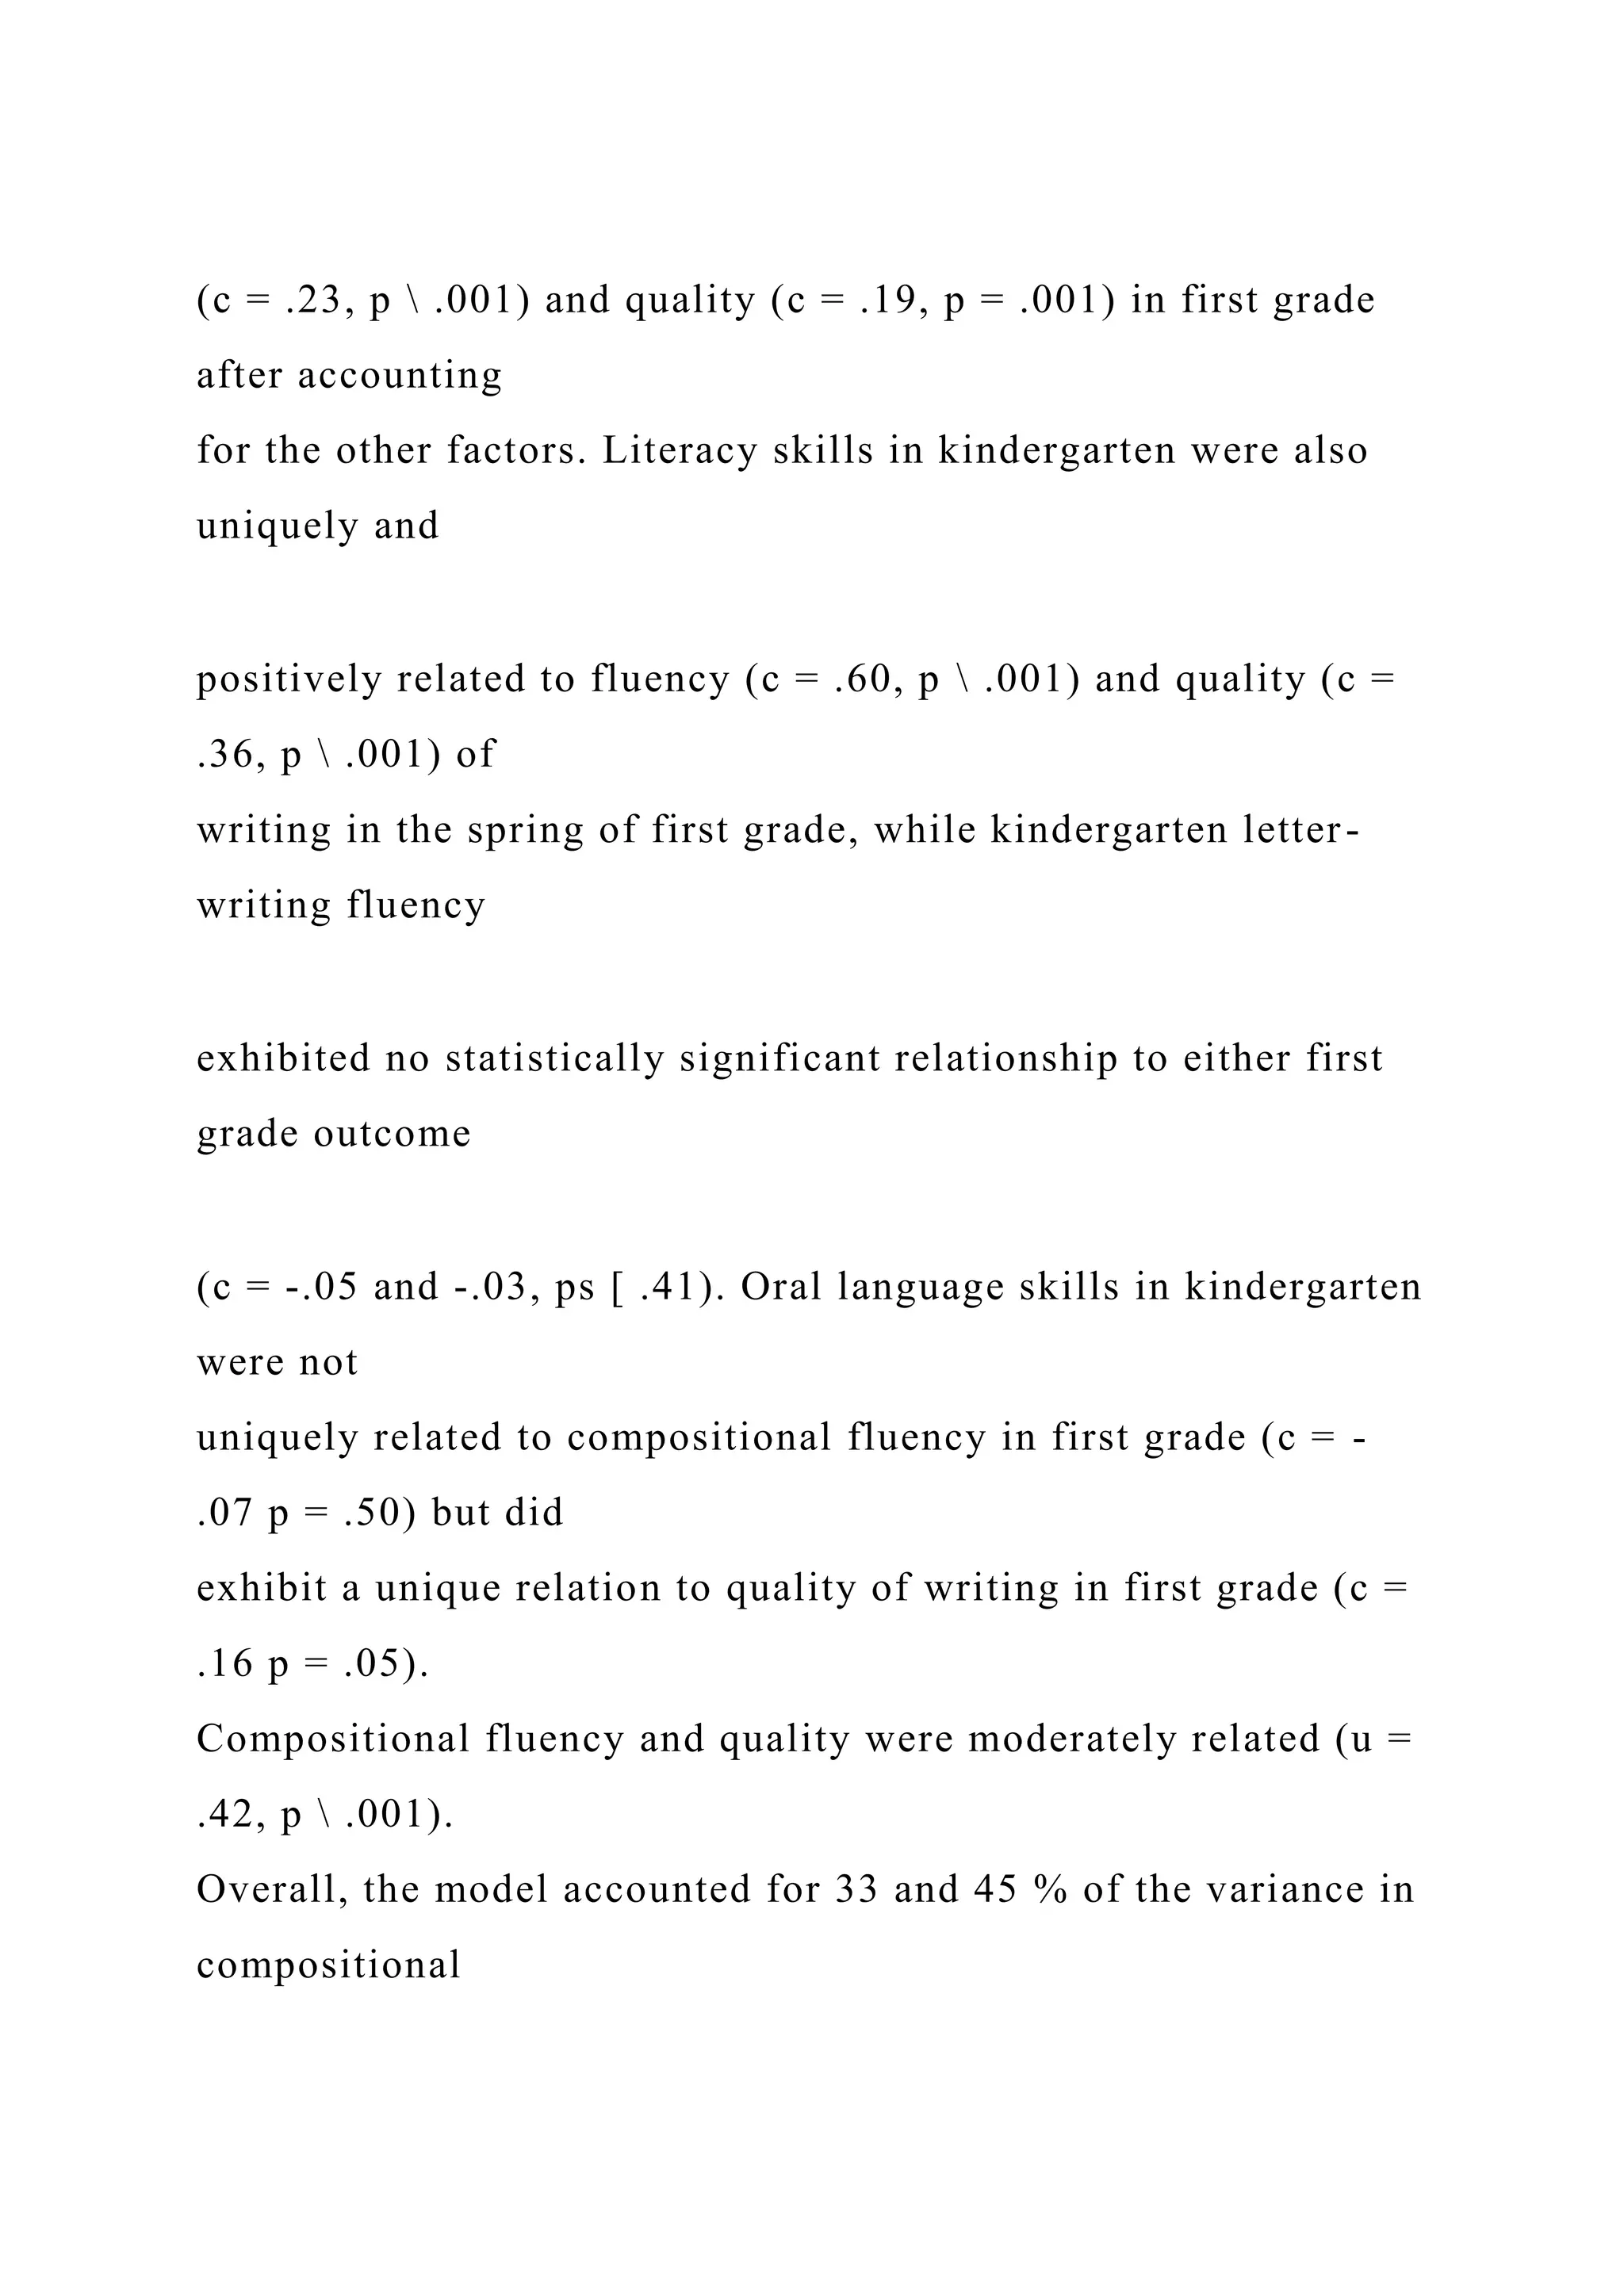
![quality and fluency respectively, in first grade.
Fig. 1 Factor loadings for kindergarten and first grade latent
variables
1178 S. Kent et al.
123
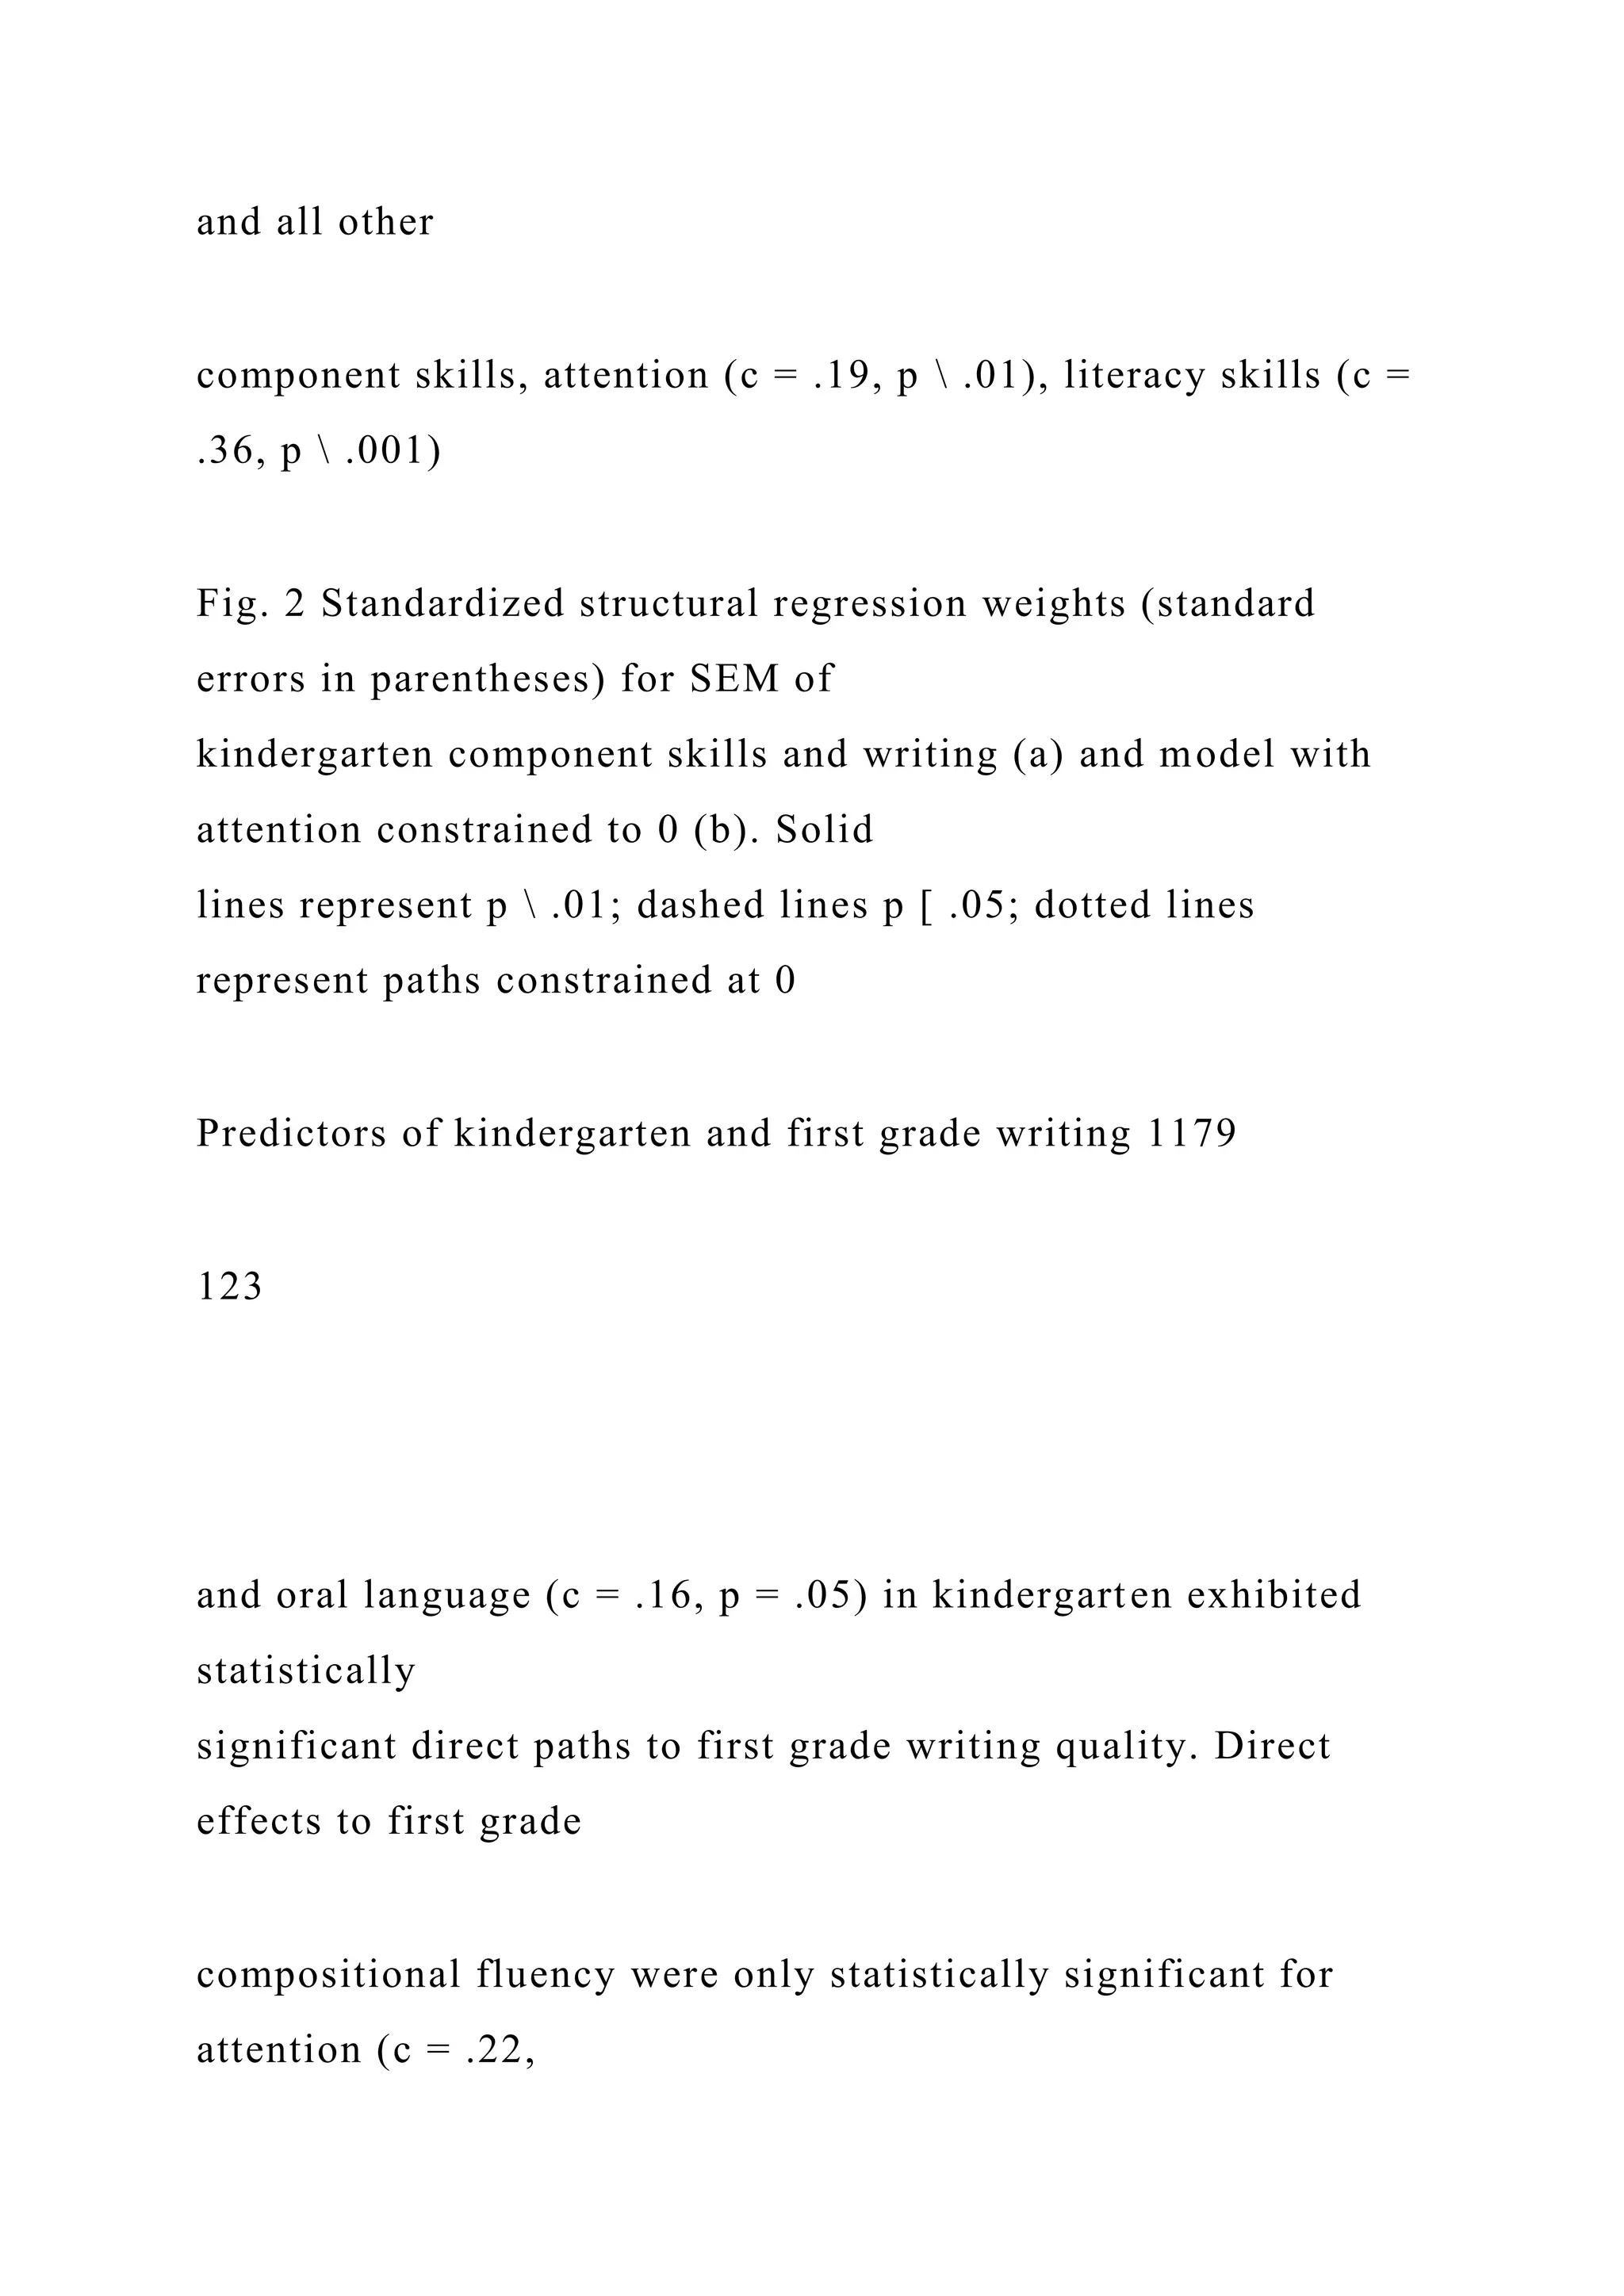
Research question 4
The final question examined whether kindergarten component
skills had a direct or
indirect effect on first grade writing quality and fluency. The
resulting model (see
Fig. 4) again demonstrated excellent model-data fit: v2 (149) =
289.34, p = .000;
CFI = .962; TLI = .951; RMSEA = .061 (CI [.050, .071]); and
SRMR = .046.
After accounting for both compositional fluency in kindergarten](https://image.slidesharecdn.com/runningheadpoliticsandhealthcasesystemsinuspoliticsand-221111005934-8c790caa/75/Running-Head-POLITICS-AND-HEALTH-CASE-SYSTEMS-IN-USPOLITICS-AND-docx-217-2048.jpg)


![and express their ideas of
science through use of writing. Aligned with the research
findings in their theoretical
framework, Prain and Hand concluded that in writing to learn
activities in the area of science,
writing should include five critical elements. These elements
include writing objectives,
writing types, the audience, subject matter containing concept
clusters and method of text
production (Hand & Prain, 2002). Critical combination of those
elements can yield
Corresponding Author email: [email protected] ©
ISSN:1304-6020
TÜRK FEN EĞİTİMİ DERGİSİ
Yıl 7, Sayı 4, Aralık 2010](https://image.slidesharecdn.com/runningheadpoliticsandhealthcasesystemsinuspoliticsand-221111005934-8c790caa/75/Running-Head-POLITICS-AND-HEALTH-CASE-SYSTEMS-IN-USPOLITICS-AND-docx-272-2048.jpg)
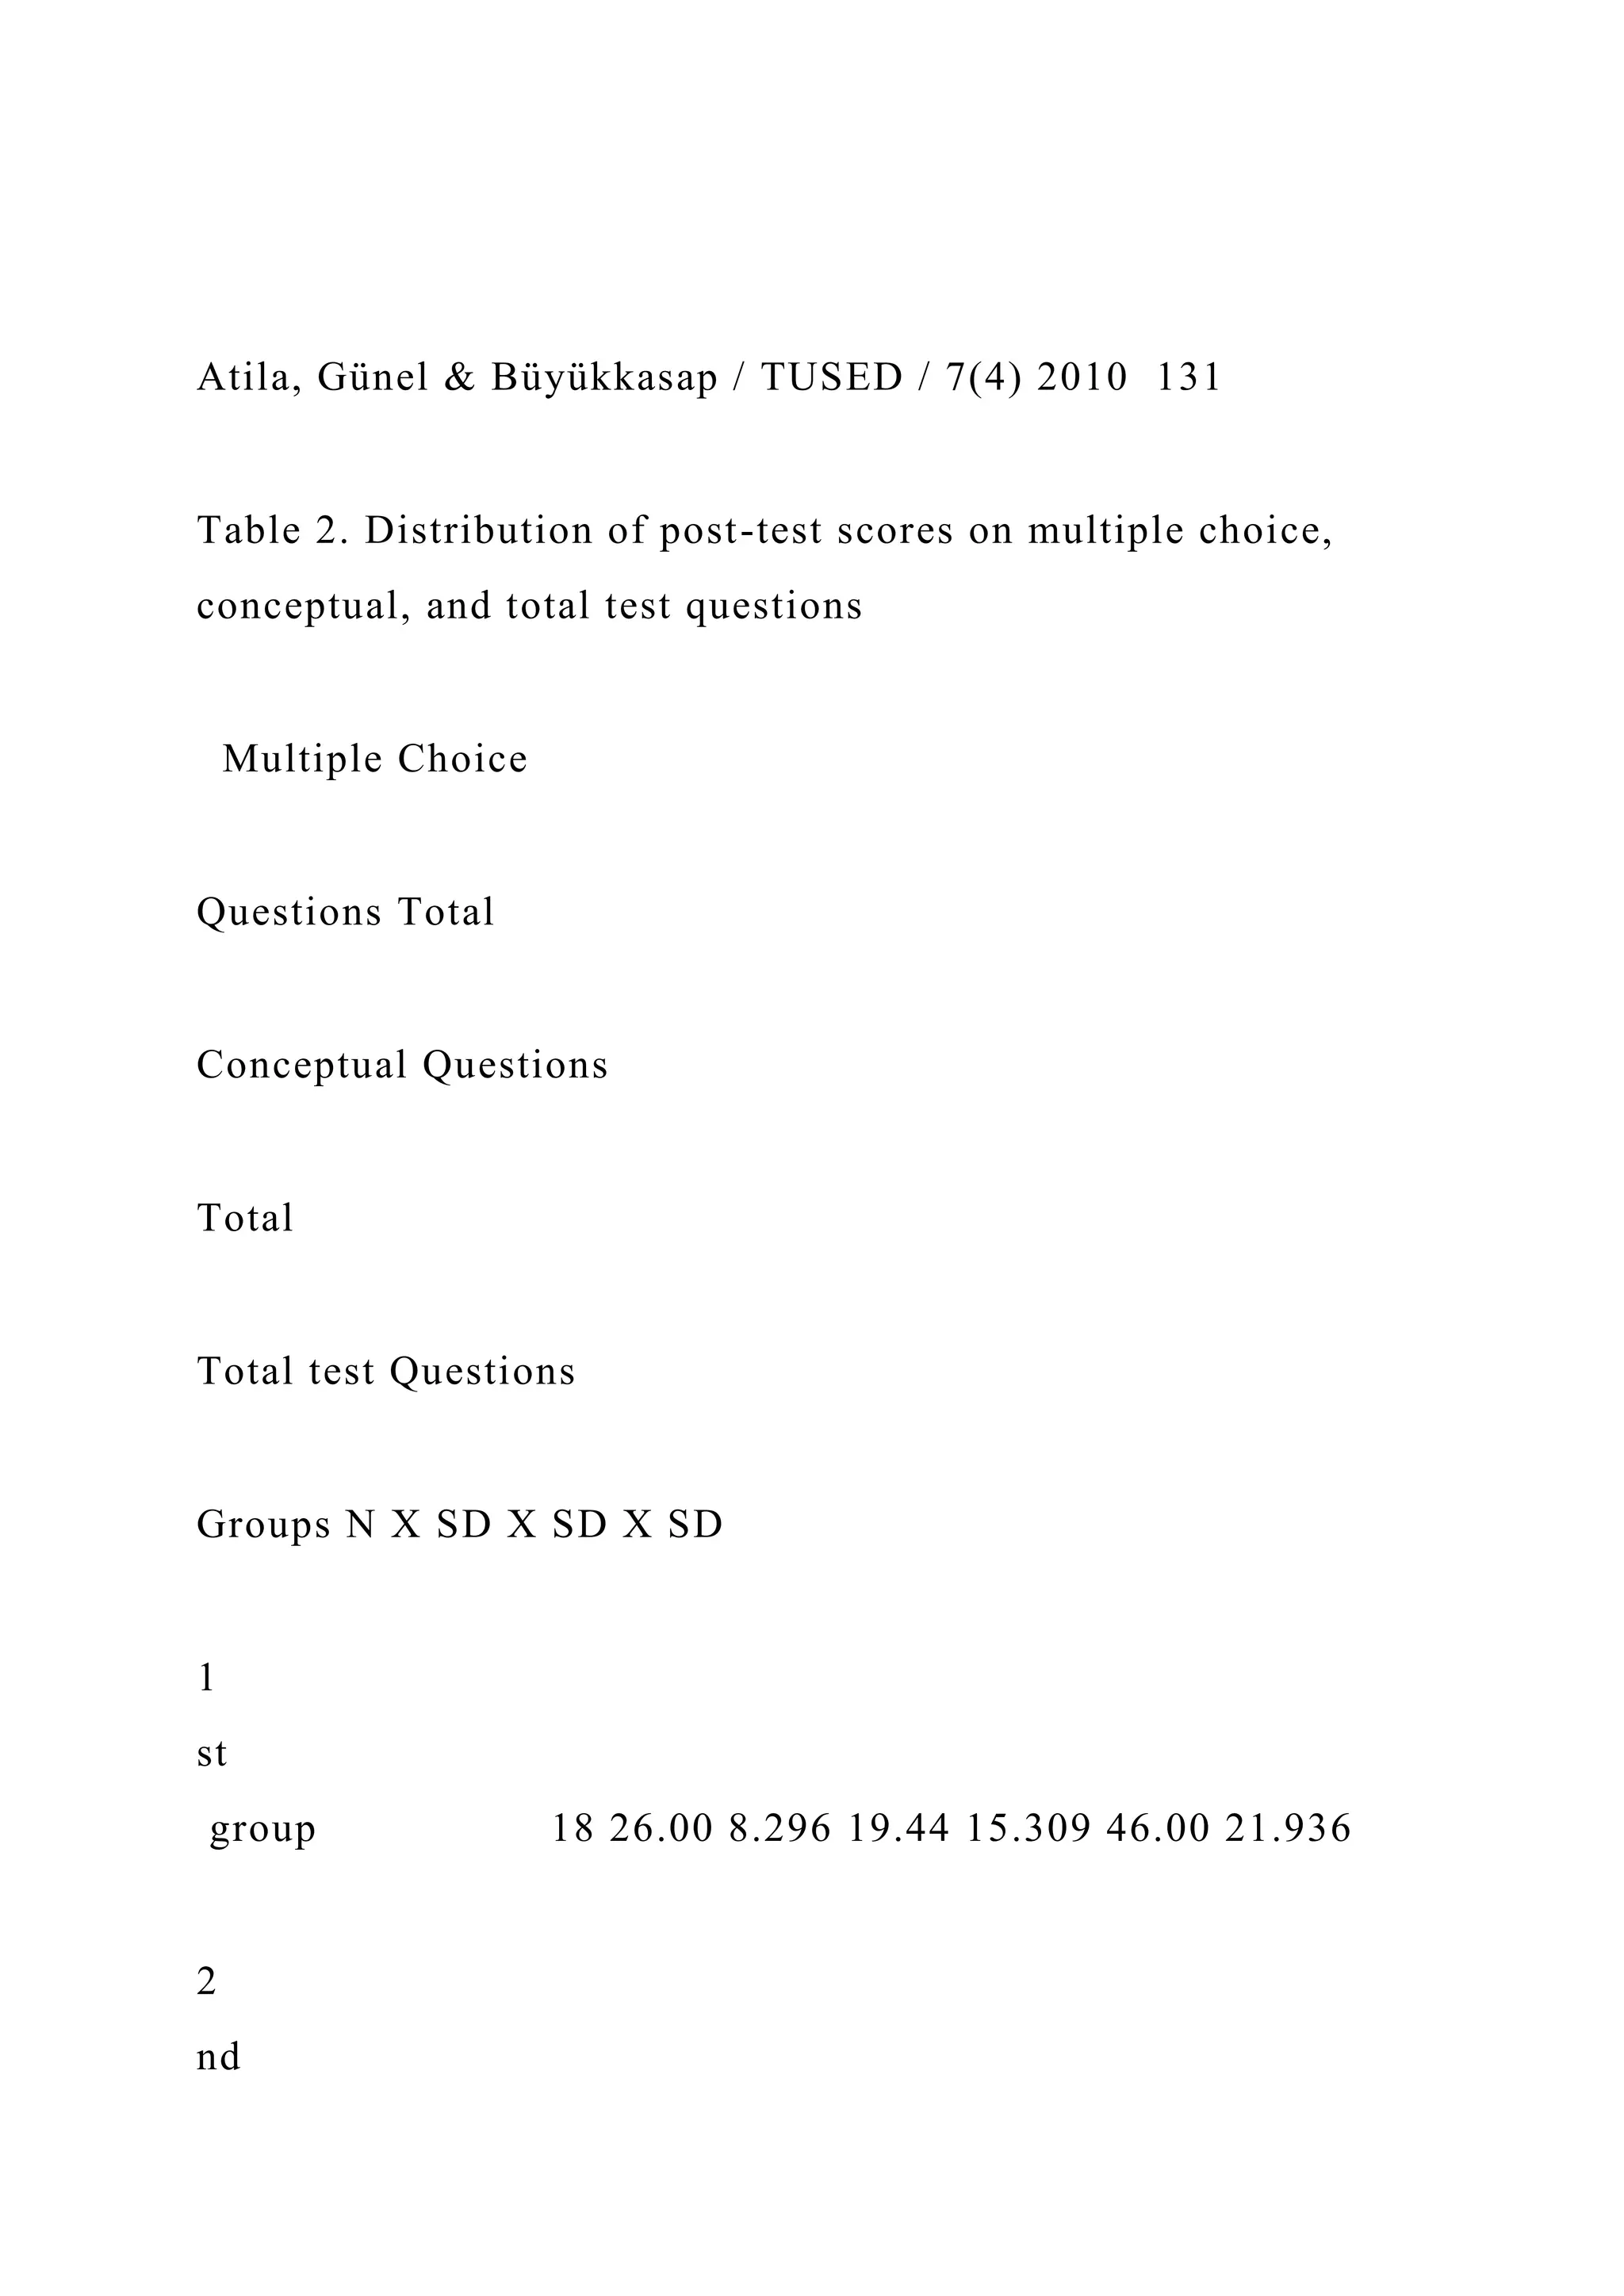
![Journal of
TURKISH SCIENCE EDUCATION
Volume 7, Issue 4, December 2010
http://www.tused.org
mailto:[email protected]
Atila, Günel & Büyükkasap / TUSED / 7(4) 2010 129
meaningful science learning. Further, they argued that language
especially writing has an
essential role in doing science as well as learning science.
Norris and Phillips (2003) reported that language has two main
roles in science literacy.](https://image.slidesharecdn.com/runningheadpoliticsandhealthcasesystemsinuspoliticsand-221111005934-8c790caa/75/Running-Head-POLITICS-AND-HEALTH-CASE-SYSTEMS-IN-USPOLITICS-AND-docx-273-2048.jpg)


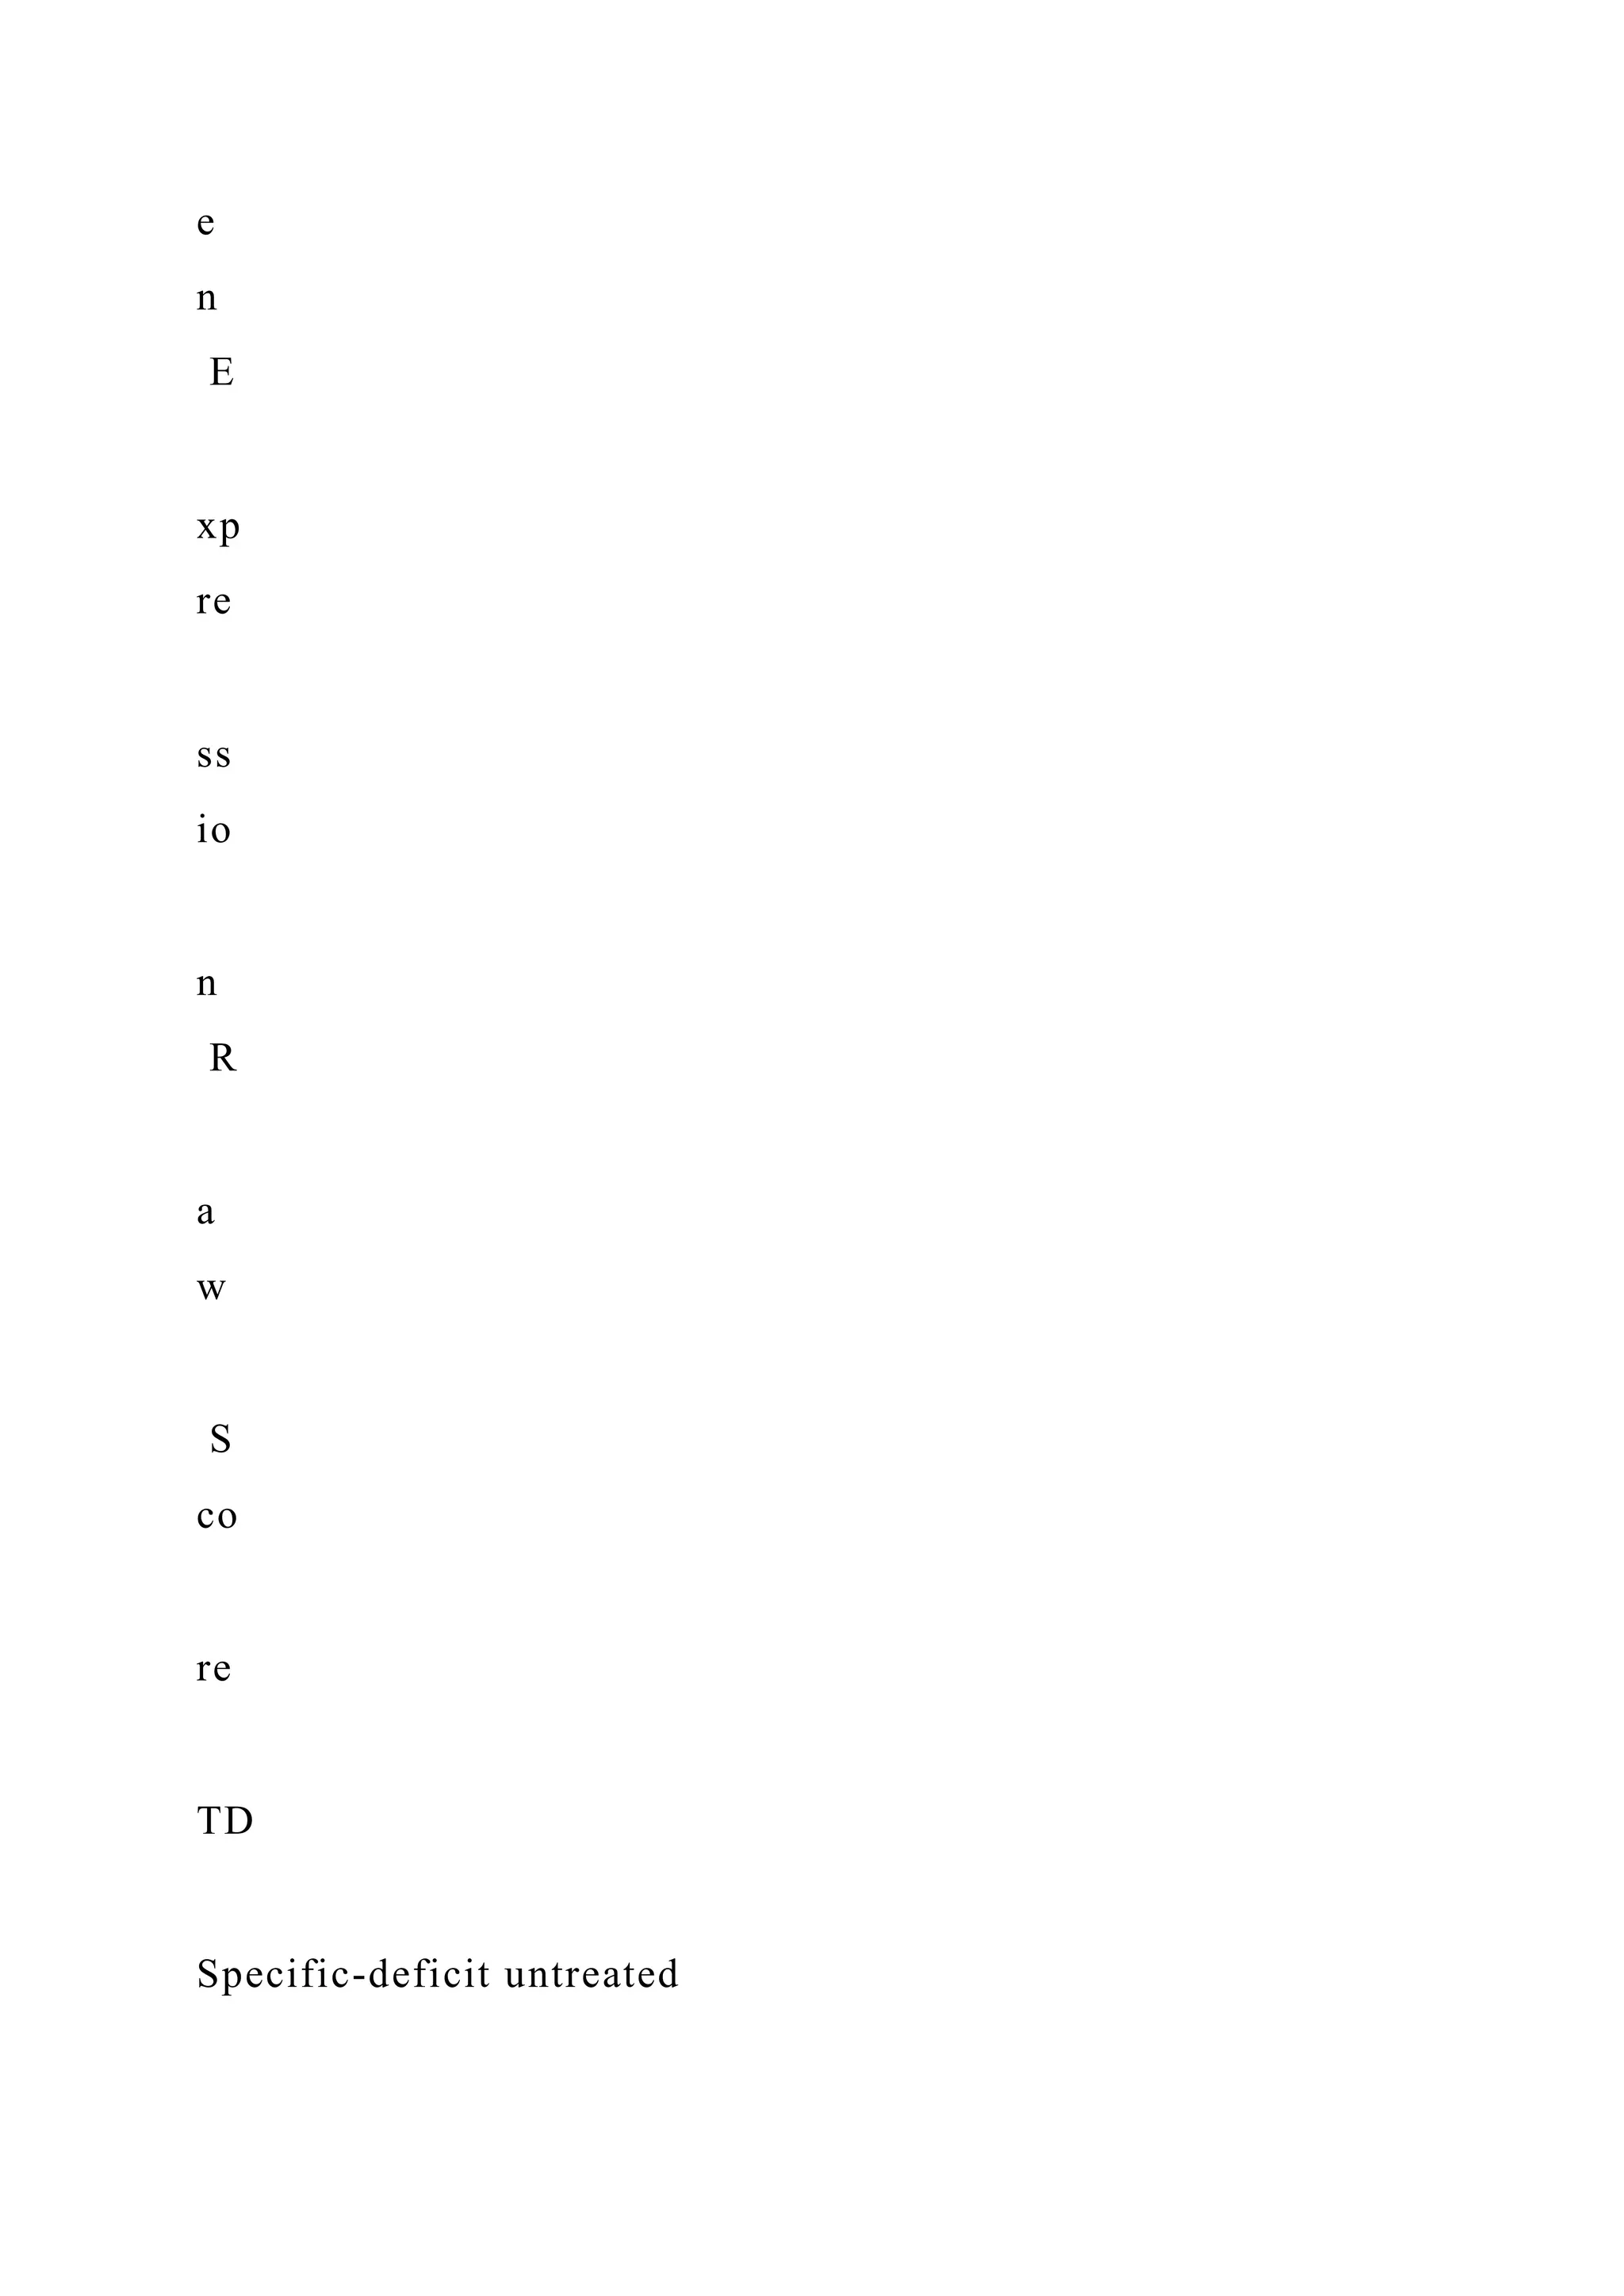
![DOI 10.1007/s11881-011-0056-y
S. R. Hooper (*)
Departments of Psychiatry, Psychology, Pediatrics, and
Education,
The Carolina Institute for Developmental Disabilities,
CB#7255,
University of North Carolina School of Medicine, Chapel Hill,
NC 27599-7255, USA
e-mail: [email protected]
L.-J. C. Costa : A. Childress: S. B. Knuth
School of Education, University of North Carolina-Chapel Hill,
Chapel Hill, NC, USA
M. McBee
Frank Porter Graham Child Development Institute, University of
North Carolina-Chapel Hill, Chapel
Hill, NC, USA
K. L. Anderson: D. C. Yerby
The Carolina Institute for Developmental Disabilities,
University of North Carolina School of Medicine,
Chapel Hill, NC, USA](https://image.slidesharecdn.com/runningheadpoliticsandhealthcasesystemsinuspoliticsand-221111005934-8c790caa/75/Running-Head-POLITICS-AND-HEALTH-CASE-SYSTEMS-IN-USPOLITICS-AND-docx-302-2048.jpg)

![consistency~.96), fine-motor speed and control (PAL-2 Finger
Succession, internal
consistency~.89), language-related functions (Peabody Picture
Vocabulary Test-4/Compre-
hensive Receptive and Expressive Vocabulary Test, internal
consistency~.91 to .94;
Comprehensive Test of Phonological Processing [CTOPP]
Elision Subtest, internal
consistency~.89 to .90; PAL-2 Rapid Automatized Naming
Letters/Digits, internal
consistency~.84 to .92; PAL-2 Word Choice, internal
consistency~.66 to .83), and
attention/executive functions (CTOPP Nonword
Repetition/WISC-IV-PI Digit Span,
WISC-IV-PI Spatial Span, internal consistency~.68 to .83; WJ-
III Planning, internal
consistency~.75; Vigil Continuous Performance Test Omissions
and Commissions,
temporal stability~.70). In addition, the WIAT-II Word Reading
Subtest (internal
consistency~.95) was employed as a possible moderator of
response to intervention,
particularly given findings suggesting a relatively strong](https://image.slidesharecdn.com/runningheadpoliticsandhealthcasesystemsinuspoliticsand-221111005934-8c790caa/75/Running-Head-POLITICS-AND-HEALTH-CASE-SYSTEMS-IN-USPOLITICS-AND-docx-318-2048.jpg)


![Copyright of Annals of Dyslexia is the property of Springer
Science & Business Media B.V. and its content
may not be copied or emailed to multiple sites or posted to a
listserv without the copyright holder's express
written permission. However, users may print, download, or
email articles for individual use.
Instructional Science28: 199–226, 2000.
© 2000Kluwer Academic Publishers. Printed in the Netherlands.
199
Writing and conceptual change. What changes?
LUCIA MASON1 & PIETRO BOSCOLO2
1Department of Pedagogical, Psychological and Didactical
Sciences, University of Lecce,
Via Stampacchia 45, 73100 Lecce, Italy, e-mail:
[email protected];2Department of](https://image.slidesharecdn.com/runningheadpoliticsandhealthcasesystemsinuspoliticsand-221111005934-8c790caa/75/Running-Head-POLITICS-AND-HEALTH-CASE-SYSTEMS-IN-USPOLITICS-AND-docx-383-2048.jpg)
![Developmental and Socialization Psychology, University of
Padova, Via Venezia 8, 35131
Padova, Italy, e-mail: [email protected]
Received: 30 December 1997; in final form: 7 April 1999;
accepted: 24 June 1999
Abstract. This study was focused on elementary school
students’ processes of scientific
understanding within a classroom environment characterized as
a community of discourse.
In particular, it explored the role of written discourse both on
the plane of knowledge devel-
opment and the conceptualization and evaluation of the writing
activity itself. The purposes
of the study were: (a) to see whether students could use writing
as a means to express and
compare ideas, reason and reflect on them in the process of
scientific understanding; (b) to
see whether writing in the service of learning facilitated the
understanding of the new topic
through conceptual change; (c) to see whether writing affected
the conceptualization of the
writing activity itself. Thirty-six fourth graders divided in two
groups, experimental (writing)
and control (no-writing), were involved in the implementation](https://image.slidesharecdn.com/runningheadpoliticsandhealthcasesystemsinuspoliticsand-221111005934-8c790caa/75/Running-Head-POLITICS-AND-HEALTH-CASE-SYSTEMS-IN-USPOLITICS-AND-docx-384-2048.jpg)


![60(4): 603–624.
Bereiter, C. (1994). Constructivism, socioculturalism, and
Popper’s World 3.Educational
Researcher23(7): 21–23.
Bereiter, C. & Scardamalia, M. (1989). Intentional learning as a
goal of instruction. In L.B.
Resnick, ed.,Knowing, Learning, and Instruction: Essays in
Honor of Robert Glaser,
pp. 361–392. Hillsdale, NJ: Erlbaum.
Boscolo, P. (1995). The cognitive approach to writing and
writing instruction: A contribution
to a critical appraisal.Cahiers de Psycologie Cognitive14(4):
343–366.
Brown, A.L. & Campione, J.C. (1990). Communities of learning
and thinking, or A context by
any other name. In D. Kuhn, ed.,Developmental Perspectives on
Teaching and Learning
Thinking Skills[Special issue].Contribution to Human
Development21: 108–126.
Brown, A.L. & Campione, J.C. (1994). Guided discovery in a](https://image.slidesharecdn.com/runningheadpoliticsandhealthcasesystemsinuspoliticsand-221111005934-8c790caa/75/Running-Head-POLITICS-AND-HEALTH-CASE-SYSTEMS-IN-USPOLITICS-AND-docx-464-2048.jpg)