1. Where Are My Patients?
Applying Operations Management (OM) Tools to Reduce PET-CT No Show Rates
A Pereira, MBA; A C Schwarzer, MBA,MPH; J C Broder, MD; L Colcord; G A Mercier, MD, PhD; A M Norbash, MD !
Department of Operations Management, Boston University School of Management and Department of Radiology, Boston University School of Medicine/Boston Medical Center, Boston MA
The Problem! Methods! Key Lessons!
“No-show” is defined as a patient who misses an appointment and makes no OM tools are effective in analyzing the no-show problem and generating
contact with the practice by end of the clinic day. data-driven recommendations.
In 2010, the no-show rate for our PET-CT service was 10%. The BU Department of Radiology reviewed the problem with the leadership OM projects are low-cost, and even greater efficiencies can result from
of the Department of Operations Management at the BU School of collaboration with graduate management programs.
No-show impacts: Management.
Significant financial strain on practice OM analysis generates practical solutions, such as the following
• Wasted time-sensitive inventory of unused isotopes A plan was devised to evaluate the problem collaboratively with operations recommendations to decrease no-show rates:
management (OM) tools. Two graduate students in the BU M.B.A program were
• Opportunity cost from unused appointment slots requiring high labor and chosen to conduct the project. • Use patient-centered scheduling by determining PET-CT date with the
equipment costs patient present or calling patient when exam is scheduled
• Wasted effort to reschedule patient and re-coordinate care with referring Multiple OM tools were applied to analyze the problem, as illustrated below. • Eliminate variation in scheduling process among ordering MDs
practice
• Follow-up all no-shows in order to capture data regarding why patients
Disruption of patient’s continuity of care do not keep appointments
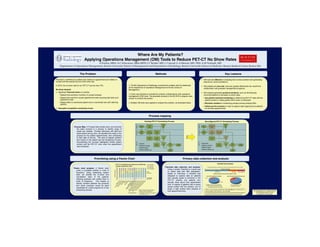
Process mapping!
Existing PET-CT Scheduling Process Reconfigured PET-CT Scheduling Process
Wait
Wait
Prac*ce
Pa*ent
Prac*ce
Pa*ent
Pa*ent
Leaves
for
Pa*ent
Leaves
Schedule
in
for
Process Map: A Process Map breaks down and connects visit
office
appt
visit
office
appt
the tasks involved in a process to identify areas of
waste and variation. Through interviews with staff and Need
Get
auth
No*fy
Need
Call
to
Get
auth
Obtain
auth
No*fy
observations during clinic, we identified the steps in the scan?
and
fax
Req
pa*ent
scan?
schedule
and
fax
Req
and
no*fy
pa*ent
process for the patient appointments: from scheduling -‐1
-‐1
-‐2
to their date of service. The area of highest variation Schedule
No*fy
Day
Schedule
Day
scan
prac*ce
scan
and impact on the patient was the Scheduling Process.
Documenting the process highlighted limited patient
PET-‐CT
PET-‐CT
Limited…
0
N Improved…
0
N
contact with the PET-CT clinic when the appointment Pa*ent
Day
Pa*ent
No*fy
Pa*ent
Day
Pa*ent
No*fy
• Pa*ent
contact
prep
call
arrives
prac*ce
• Pa*ent
contact
prep
call
arrives
prac*ce
was scheduled. ?
• Pa*ent
input
?
• Pa*ent
input
Y Y
• Pa*ent
follow-‐up
See
• Pa*ent
follow-‐up
See
pa*ent
pa*ent
Prioritizing using a Pareto Chart ! Primary data collection and analysis!
PET-‐CT
%
of
Appointment
Outcomes,
by
Referring
Sum
of
No
Show
Checklist
Data
Analysis
Provider
Department,
2010
Sum
of
Canceled
Sum
of
Not
Done
Checklist data collection and analysis: Data
collected
using
a
checklist
over
a
four
week
period
(Feb
28
to
Mar
25,
2011)
Pareto chart analysis: A Pareto chart 100%
Sum
of
Completed
95%
Using a simple Checklist is a great way 96
Exams
Scheduled
ranks a countable problem in order of
%
of
All
Appointments
90%
81
9 6
85%
82.8%
to collect data with little preparation. Performed
No
Show Not
completed
frequency. Using scheduling system 80%
Observed
No-‐Show
rate
during
the
period
=
9.38%
completed
75%
Based on interviews, a checklist was
data, we charted the no-show and 70%
65%
designed to capture data on patients Out
of
the
96
paPents
scheduled
Out
of
93
paPents
phoned
for
prep
call
cancellation rates of the patients’ 60%
55%
#
of
completed
6
35
6
33
11
33
114
114
398
100
116
20
48
11
9
appointments
who actually spoke to someone in the 17%
33%
referring practices and ranked them in 50%
PET-CT practice and patients who
order of frequency. This helped us 67%
actually knew about their appointment 83%
identify variation between the practices
time. A majority of patients had no direct Pa*ent
had
no
say
in
exam
*me
Could
not
be
reached
and which practices would be good Pa*ent
present
during
scheduling
Could
be
reached
verbal contact with the practice, and of *
No
pa*ent
called
back
to
reschedule
candidates for a pilot program for a new
those, a high number were unaware of • There
is
only
one
prep
call
a_empt
made
(one
day
prior
to
exam)
and
a
scheduling process. Medical
Hematology/Oncology:
We are grateful to Dr. Janelle Heineke
•
Largest
volume
of
pa*ents
their appointment time. voice
message
is
leb
if
pa*ent
is
not
reachable
Referring
Department
•
Consistent:
10%
no-‐show
‘09
to
‘10
• All
3
rescheduling/cancella*ons
during
this
*me
period
were
by
pa*ents
and Tanaysha Howell for their
•
Low
staff
turnover
unaware
of
exam
*me
and
only
done
when
contacted
for
a
prep
call
contributions to this project.
•