Download as PDF, PPTX
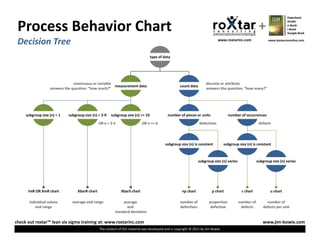

The document discusses different types of process behavior charts and decision trees used for analyzing data in quality control and process improvement. It defines continuous and discrete data and the different charts used depending on whether the data is measurement data, count data, or has a constant or varying subgroup size. Key charts mentioned include X-bar, R, XmR, np, p, c, and u charts. The document provides information on different process analysis tools and charts for quality professionals.


![[Harvard CS264] 10b - cl.oquence: High-Level Language Abstractions for Low-Le...](https://cdn.slidesharecdn.com/ss_thumbnails/cl-oquence-cs264-110403182645-phpapp01-thumbnail.jpg?width=640&height=640&fit=bounds)


