Download to read offline
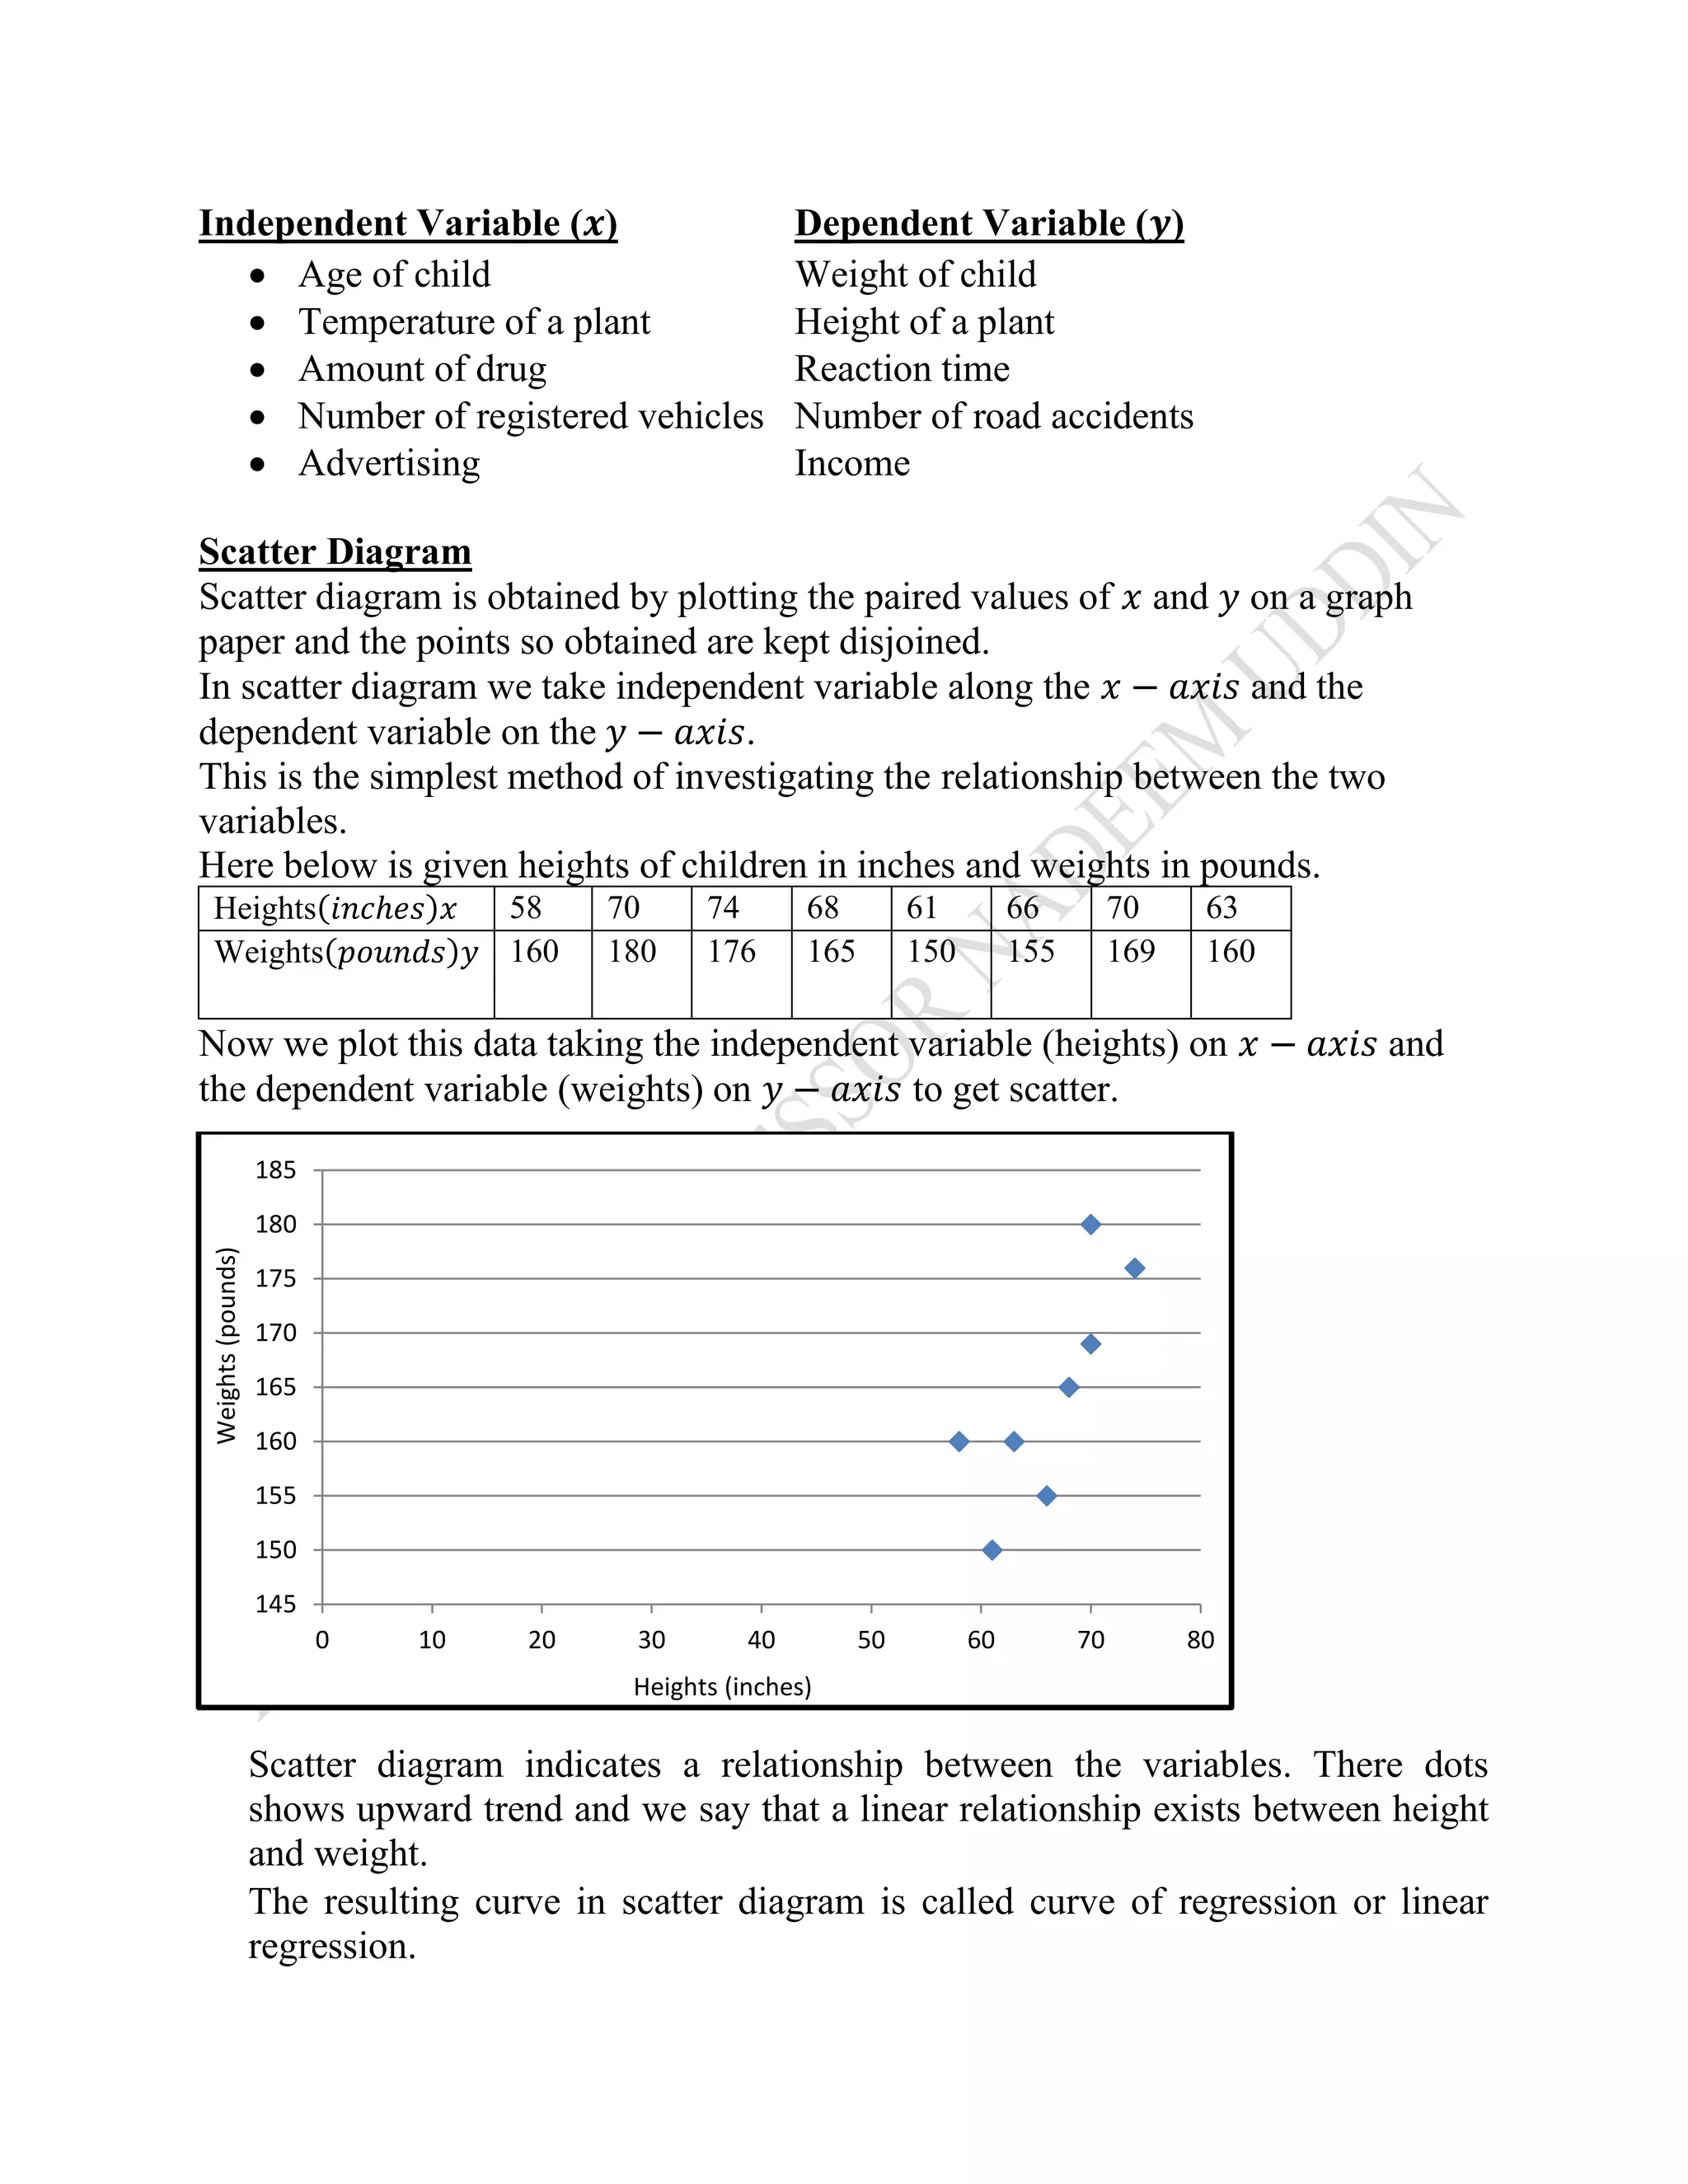
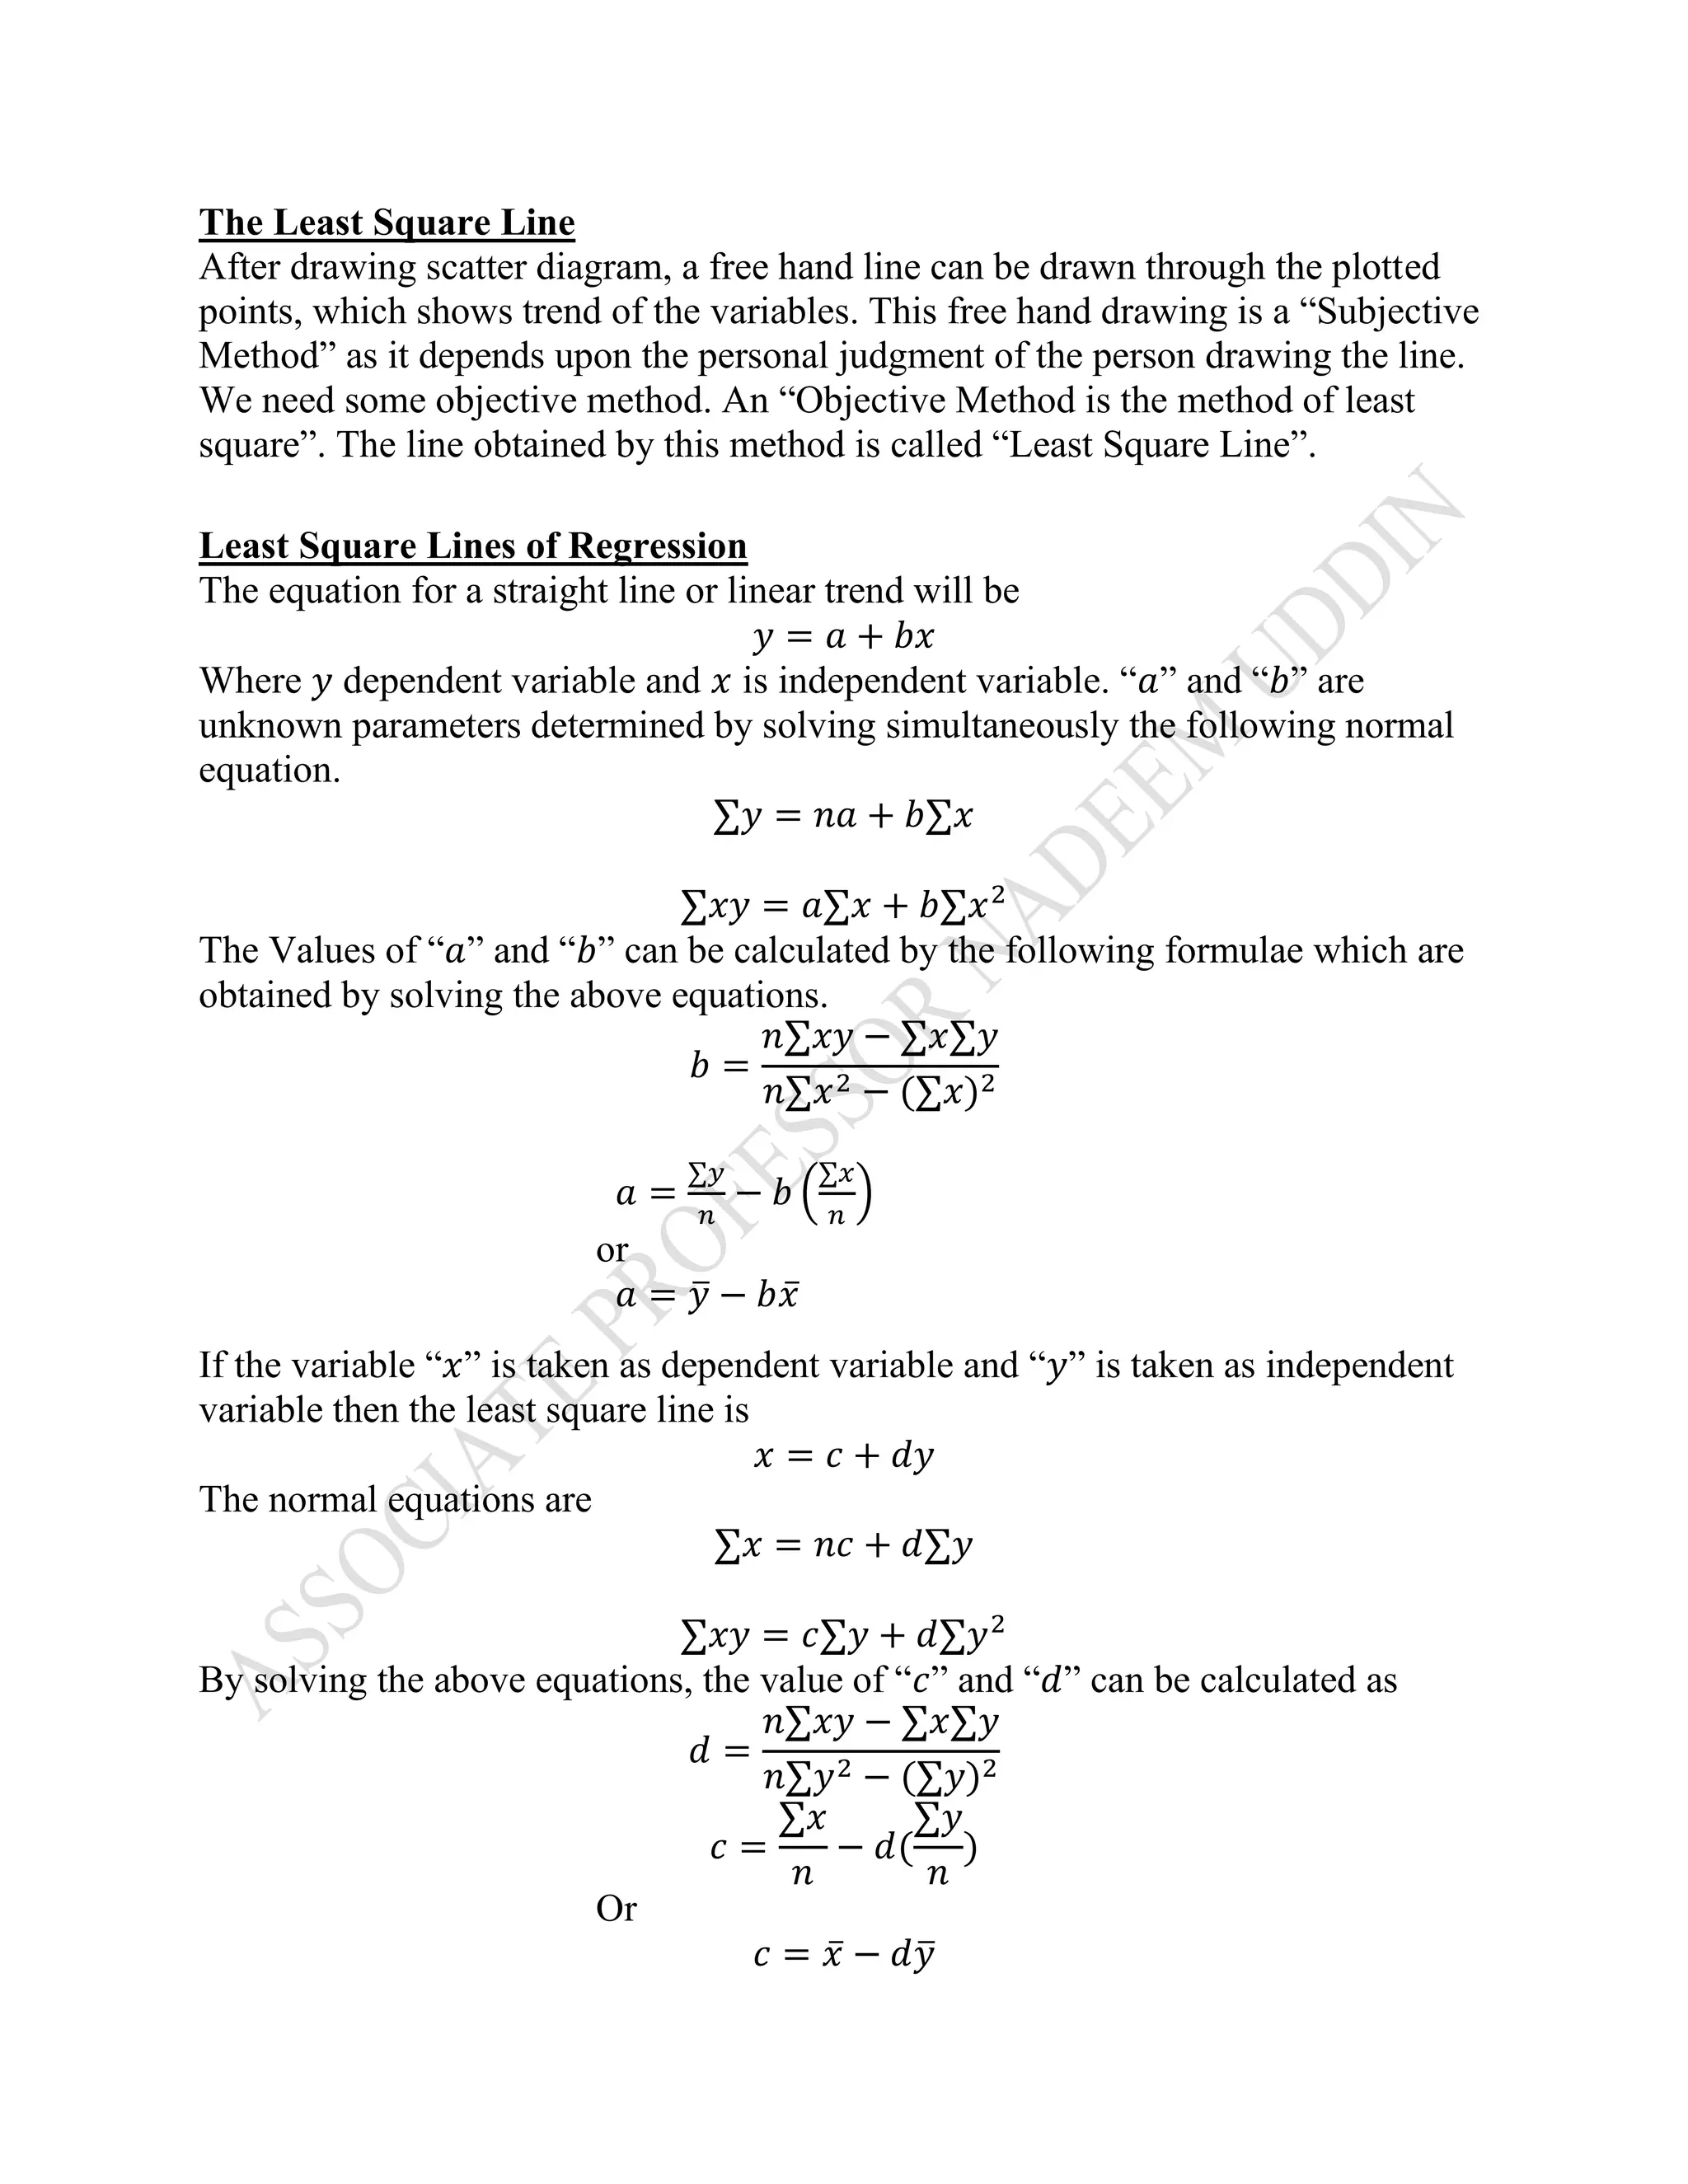
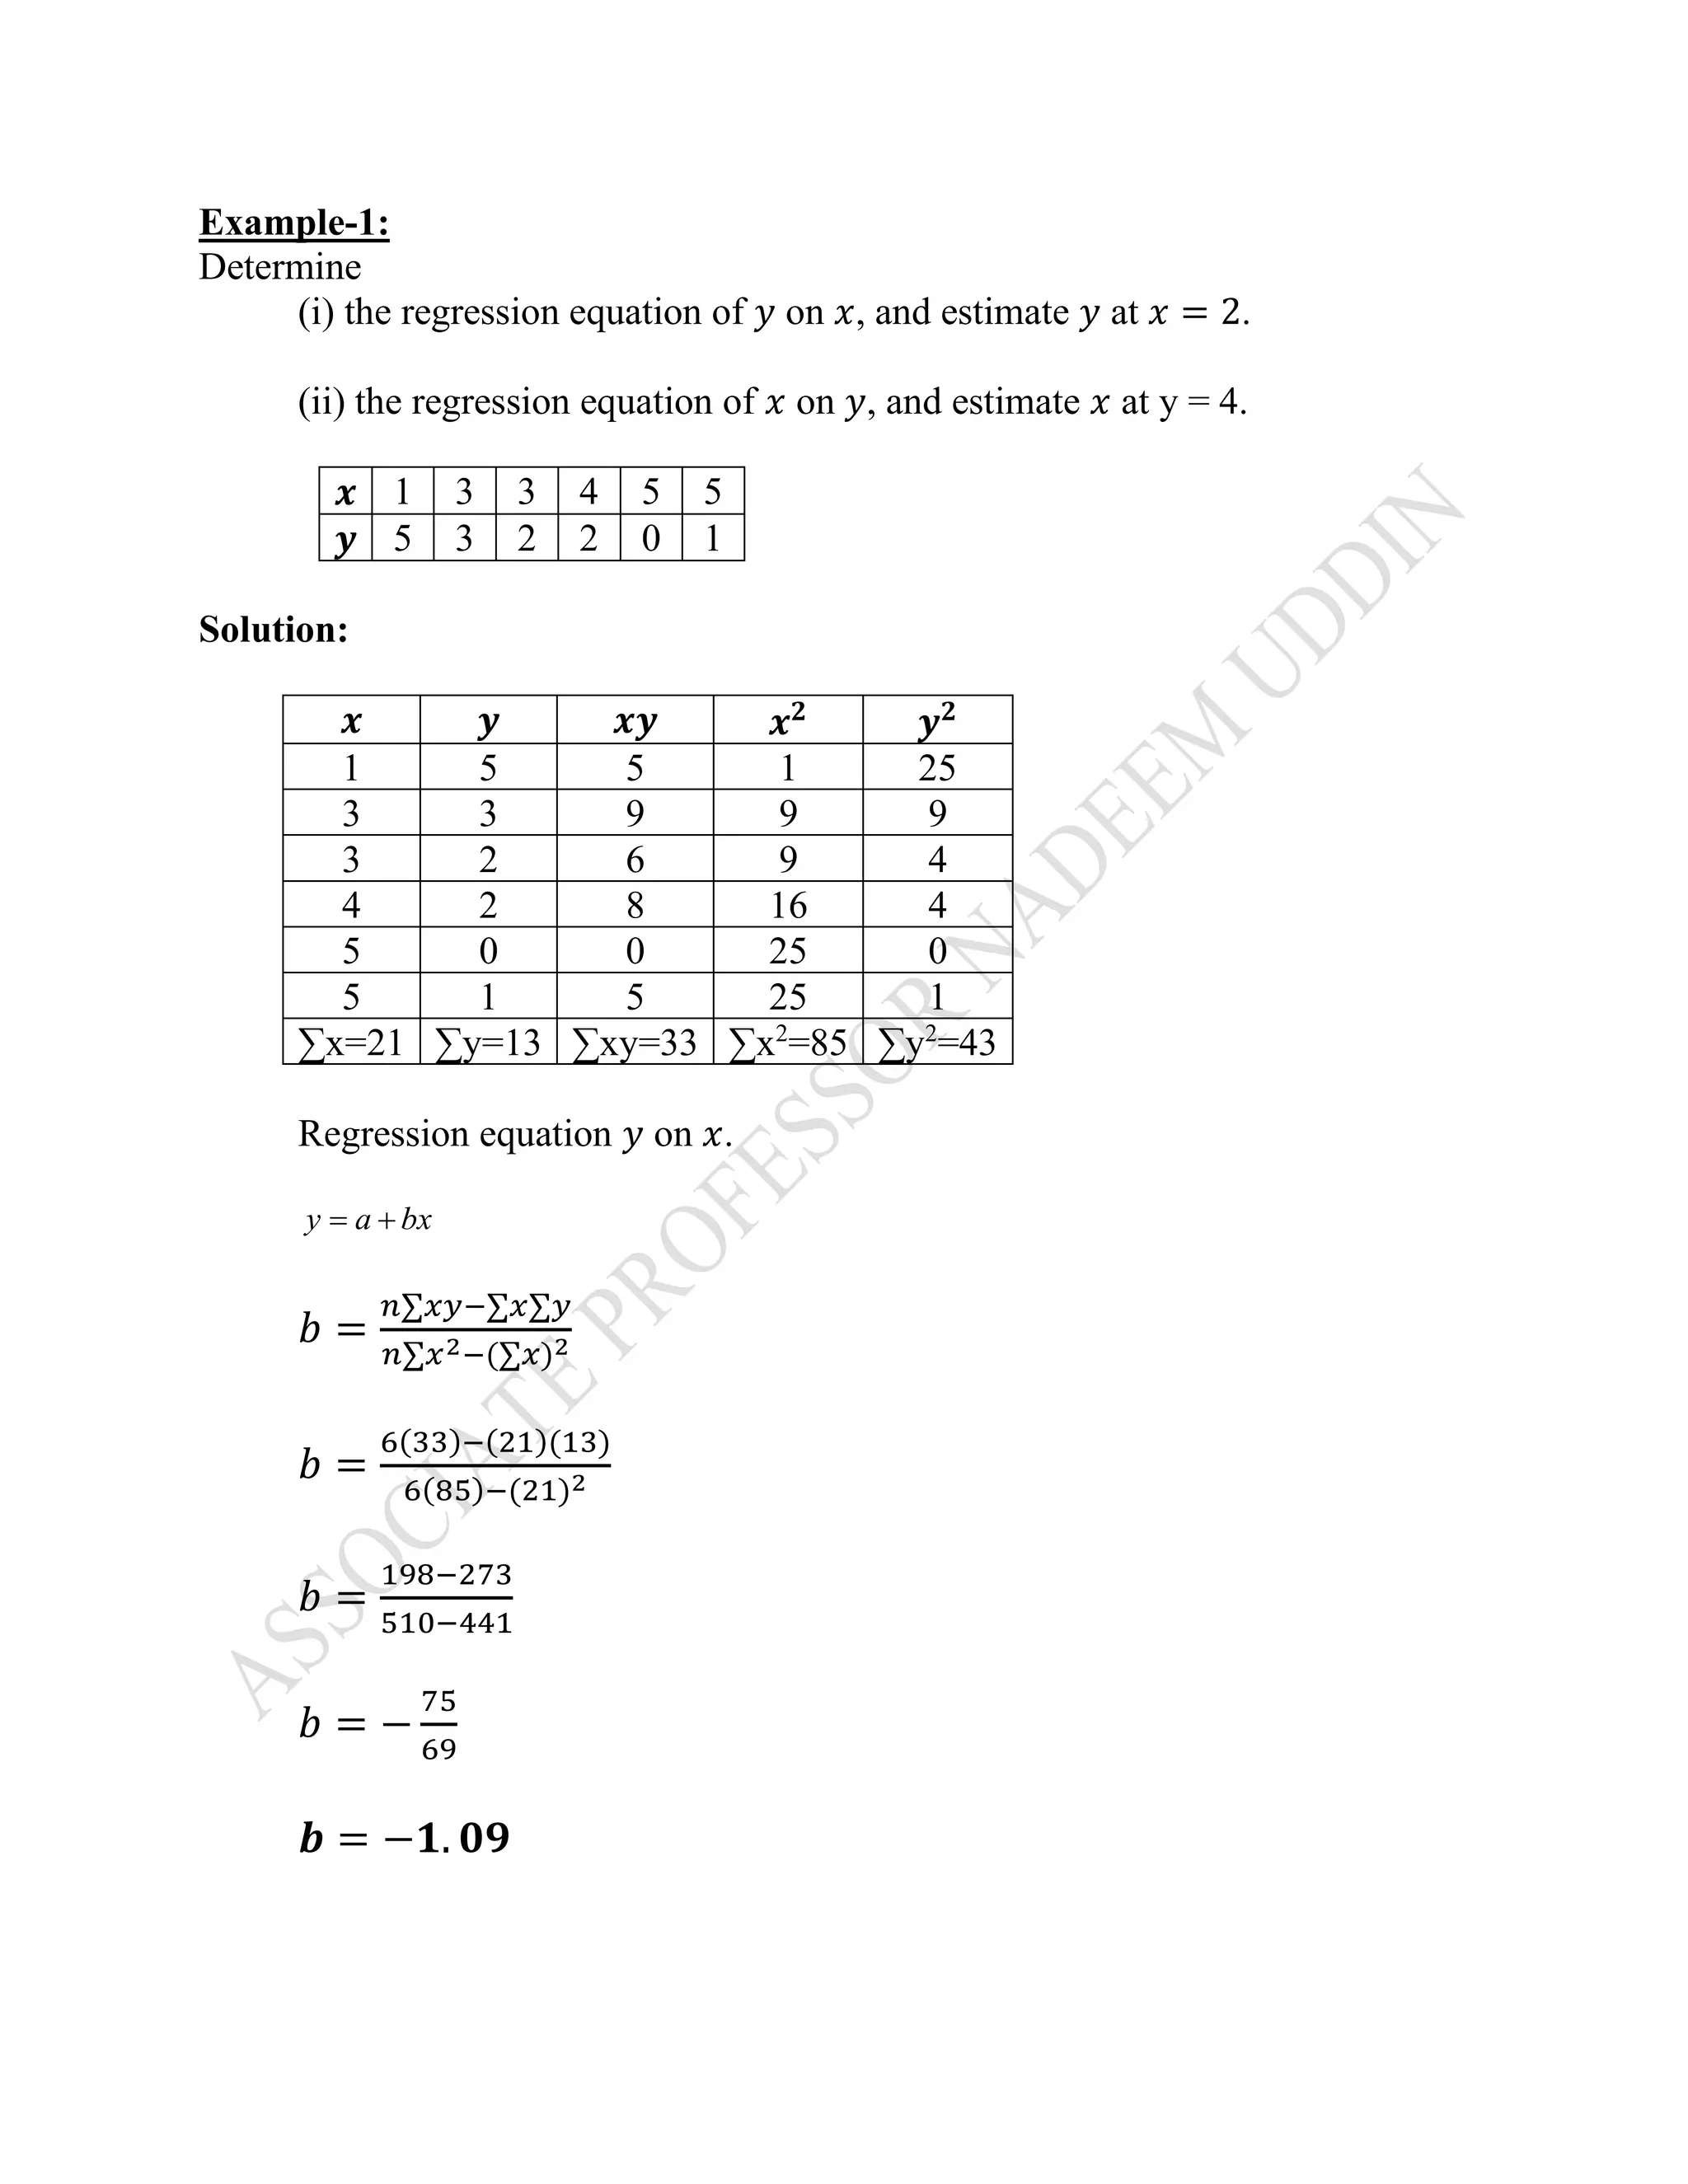
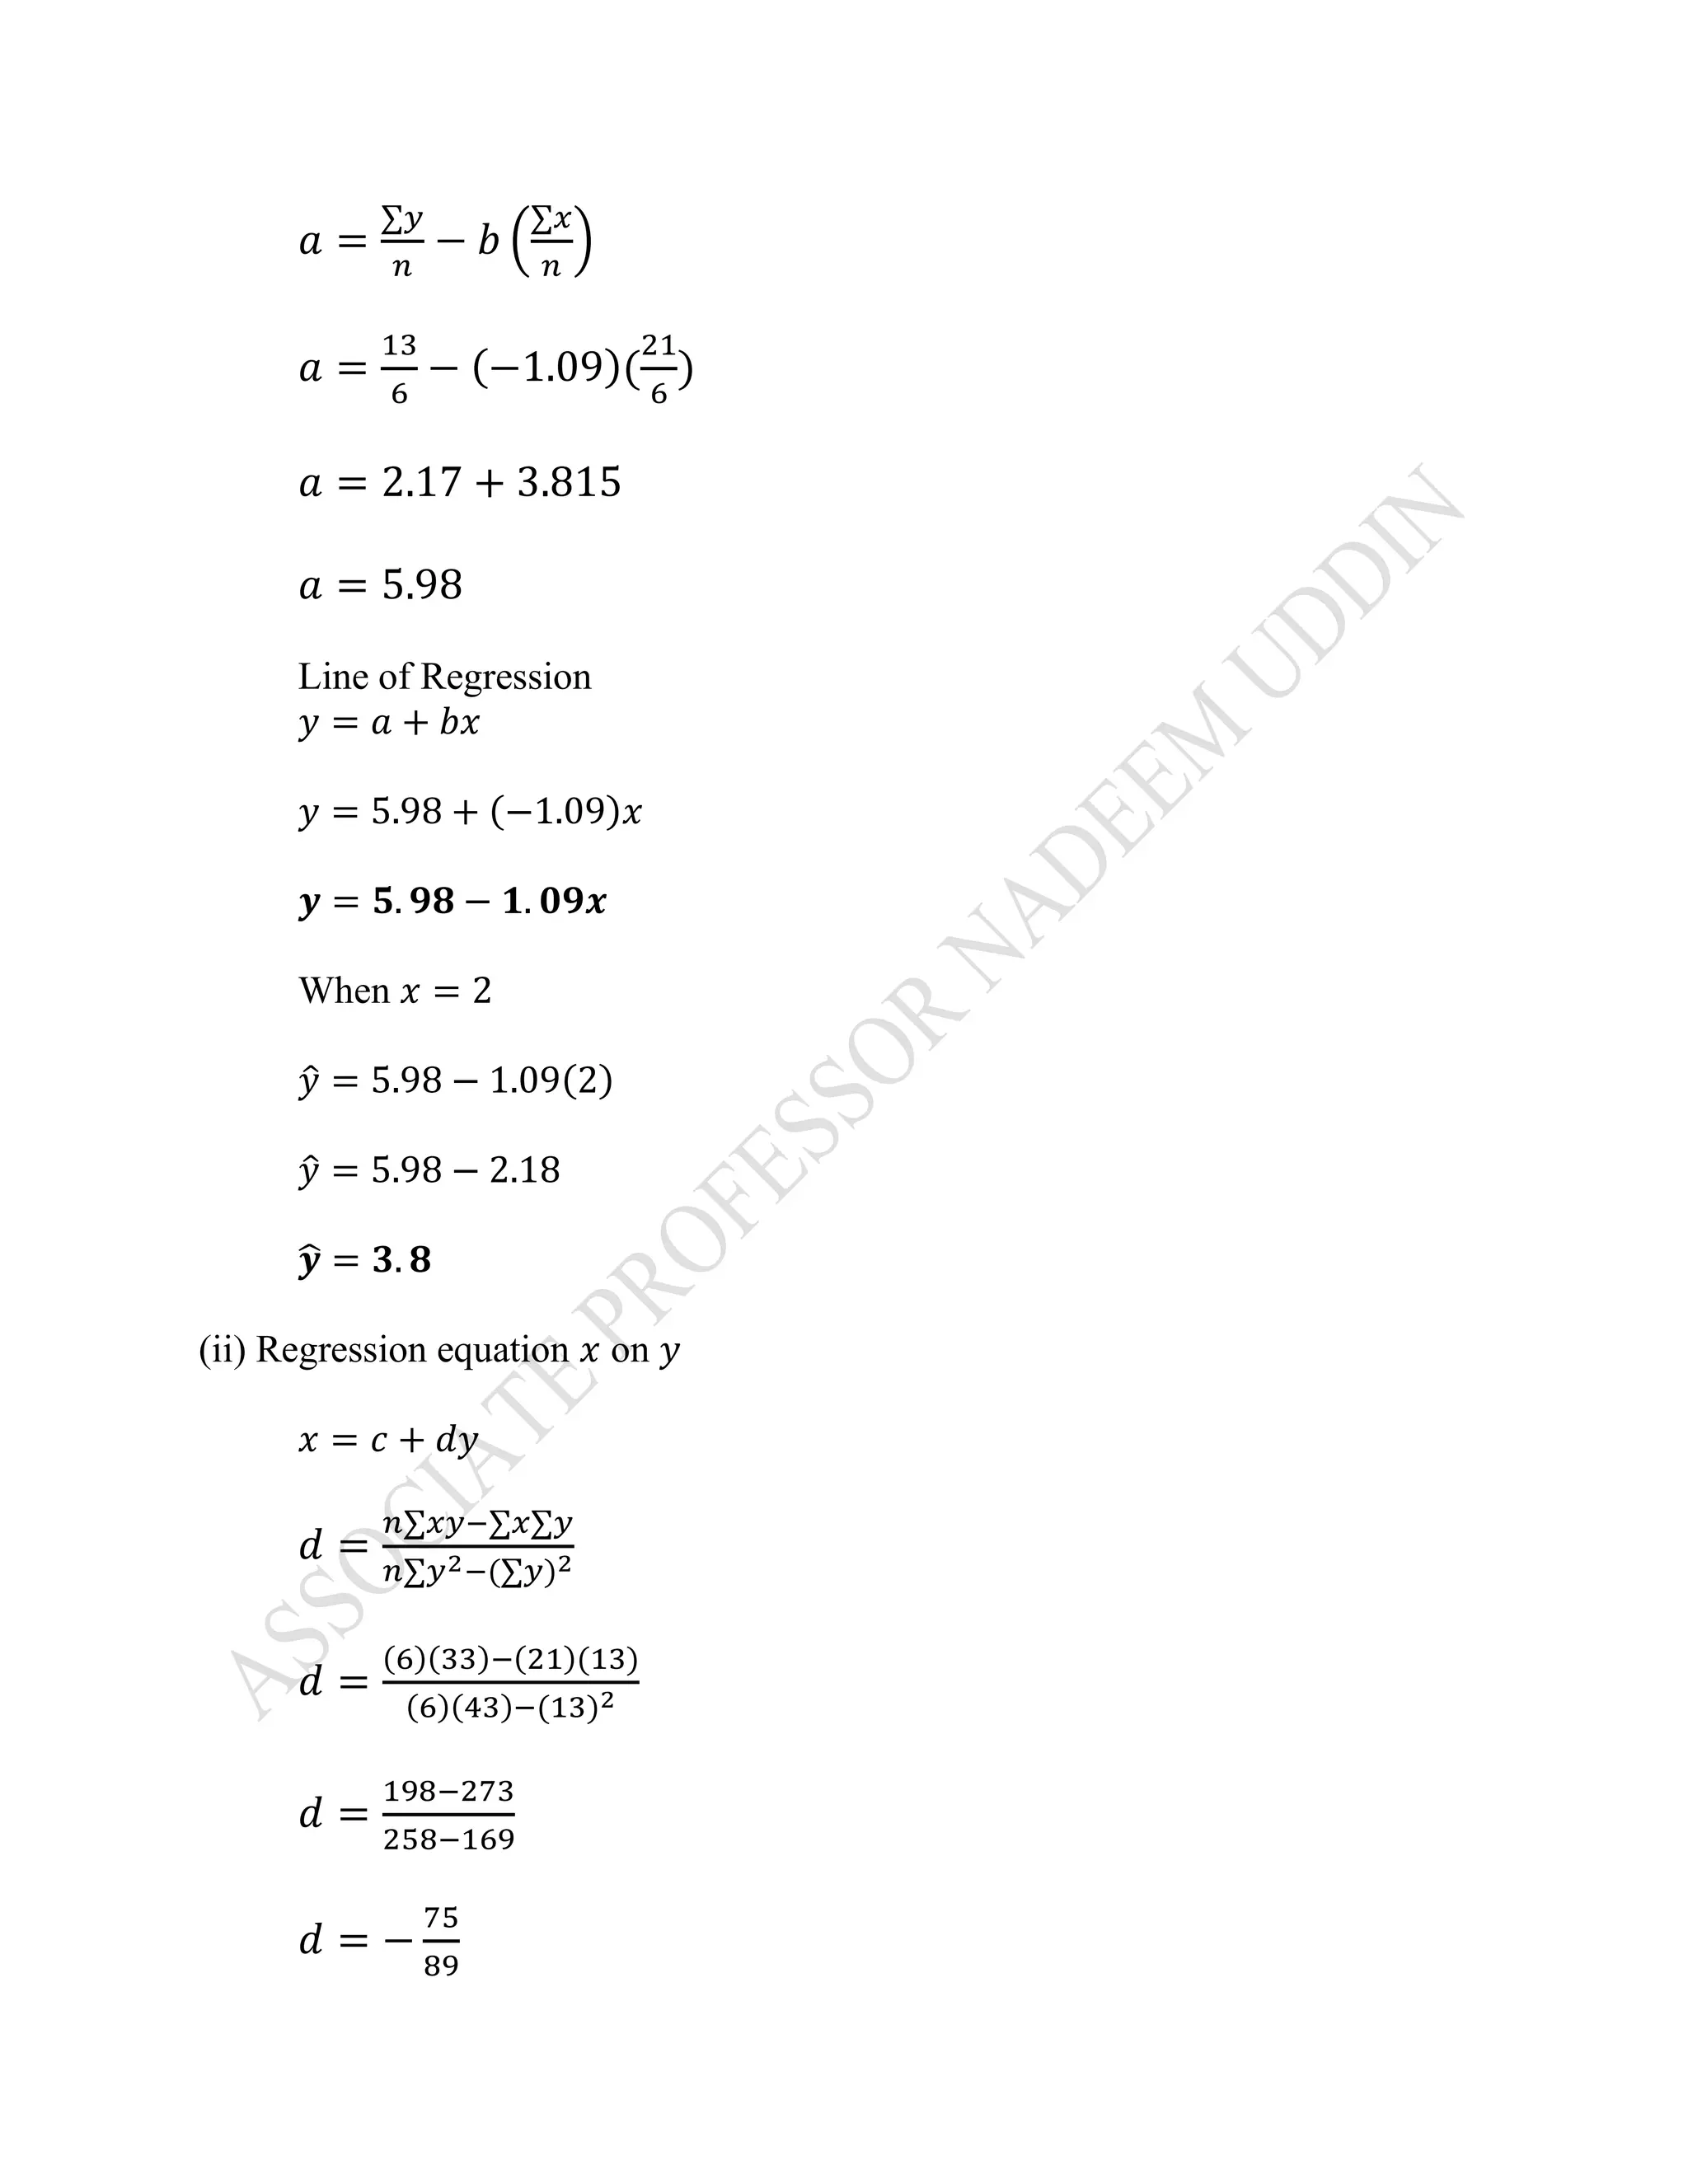
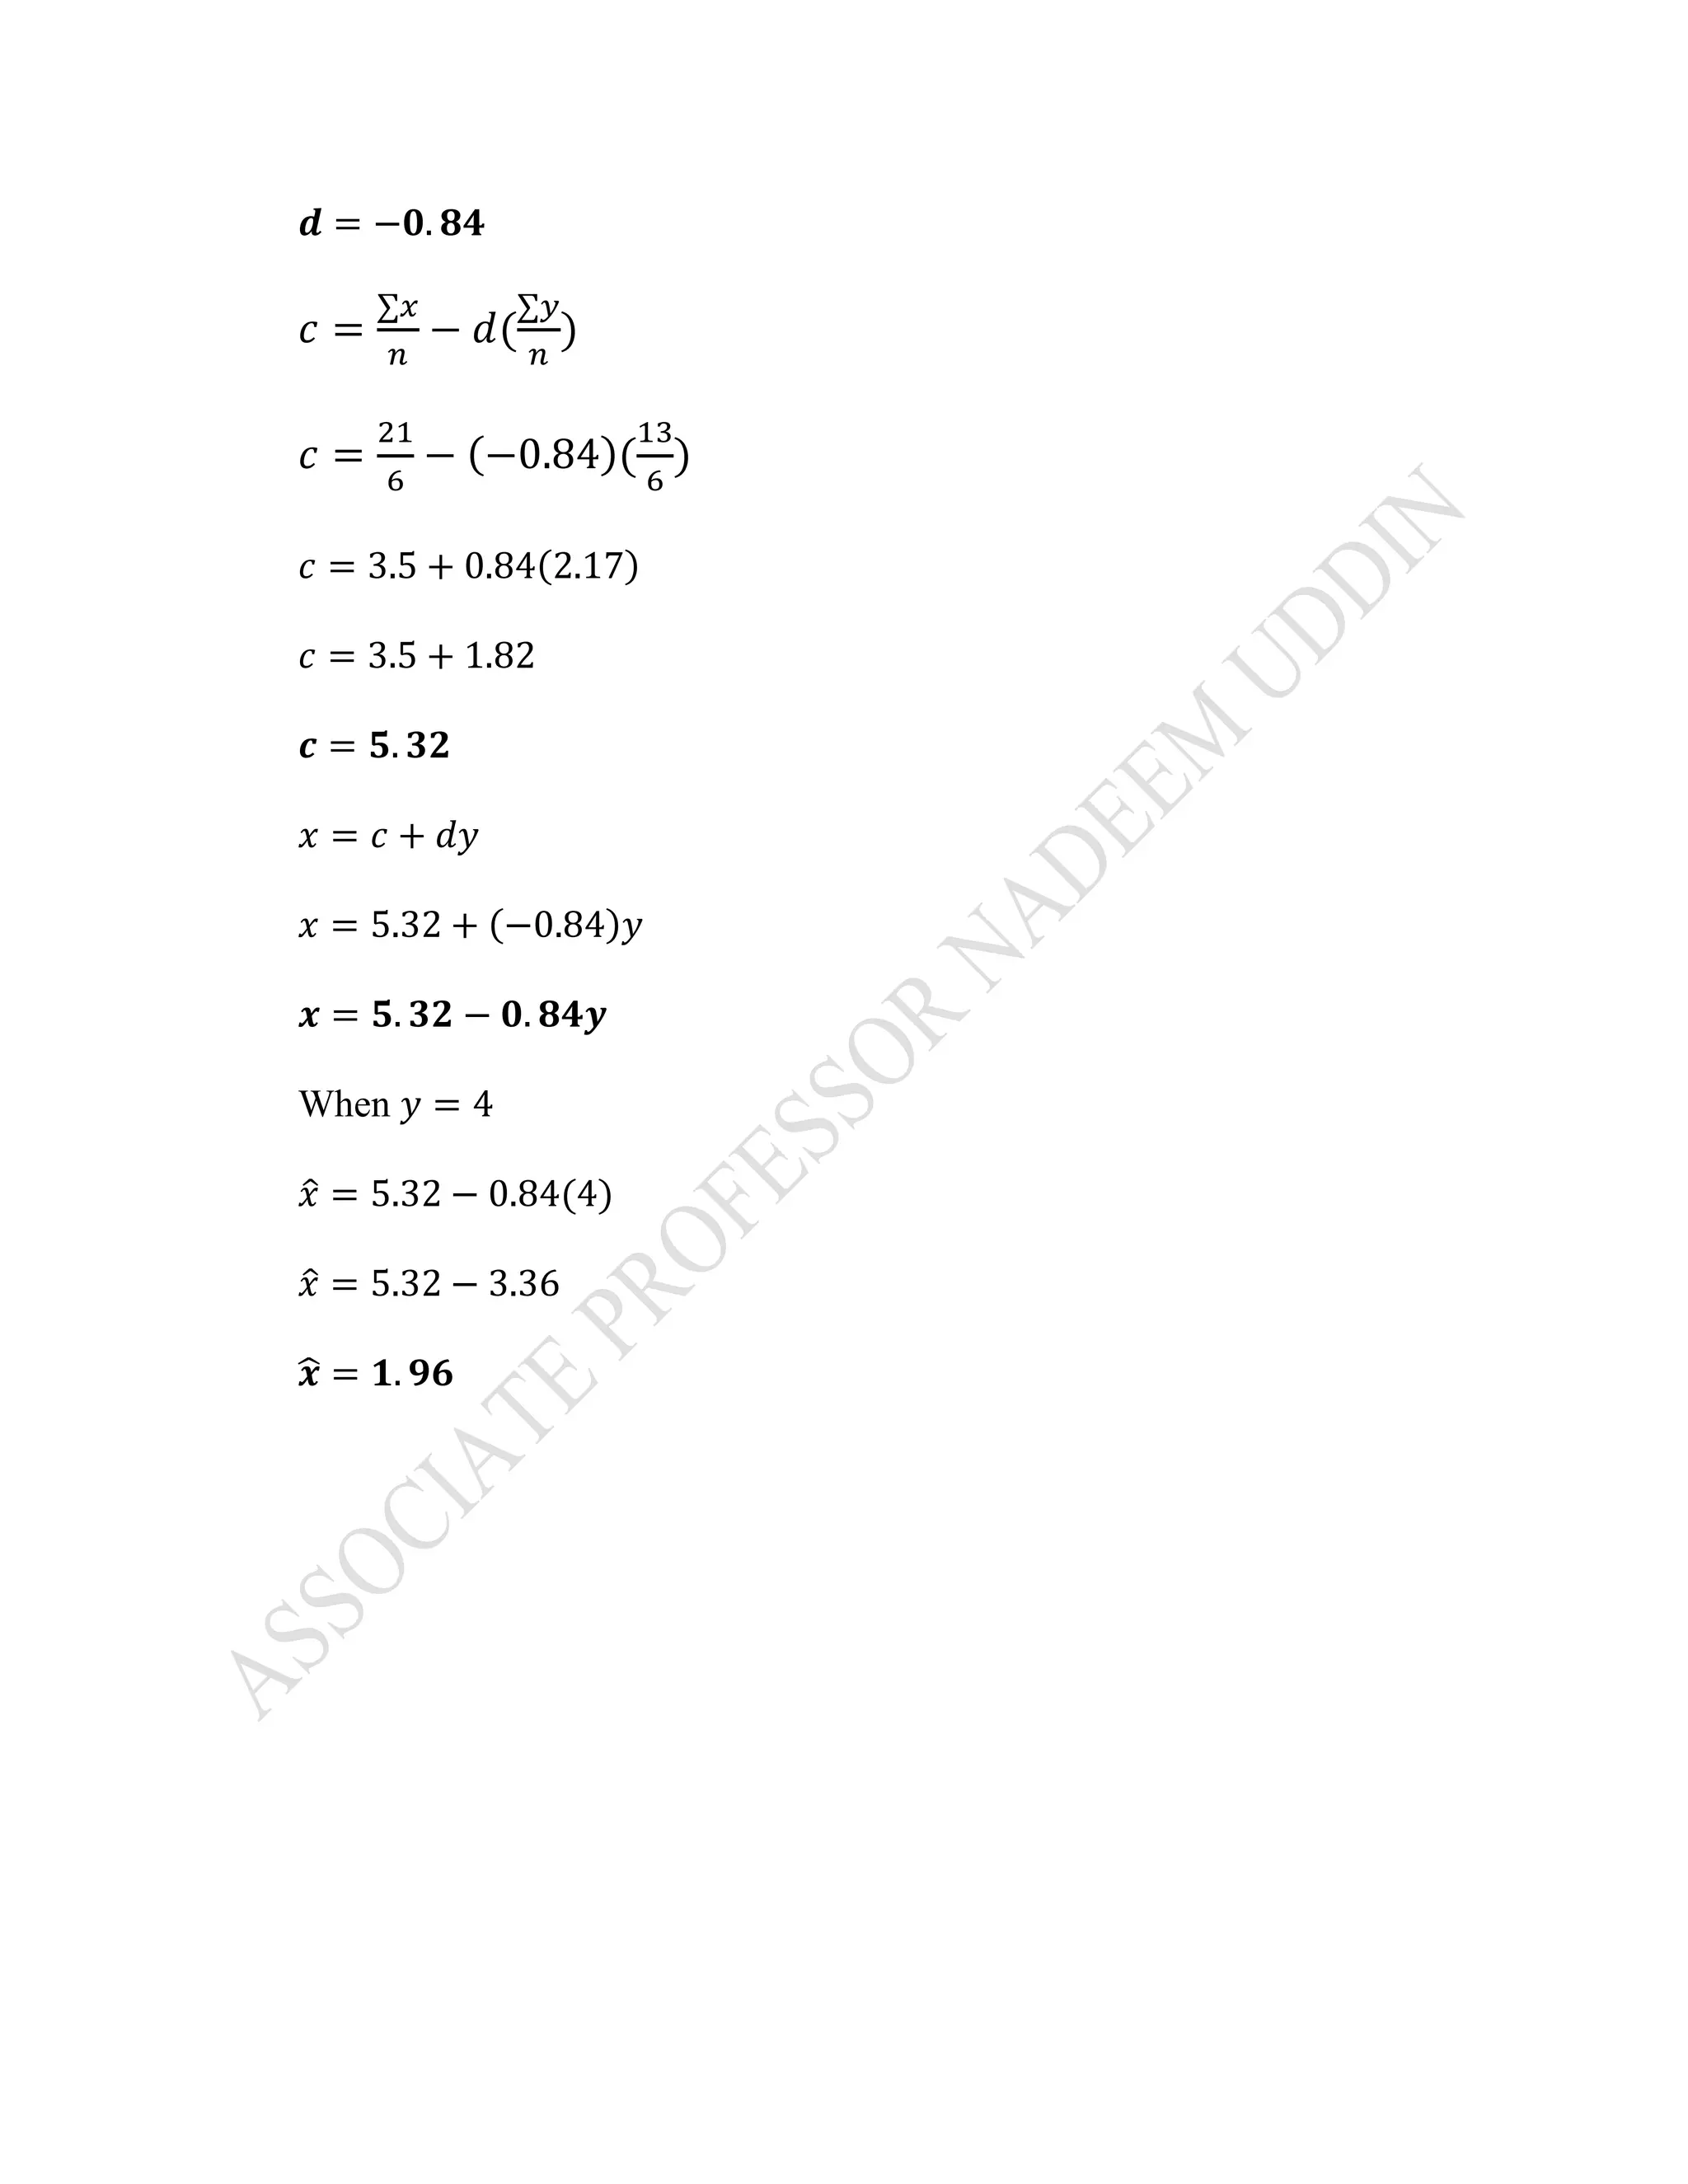
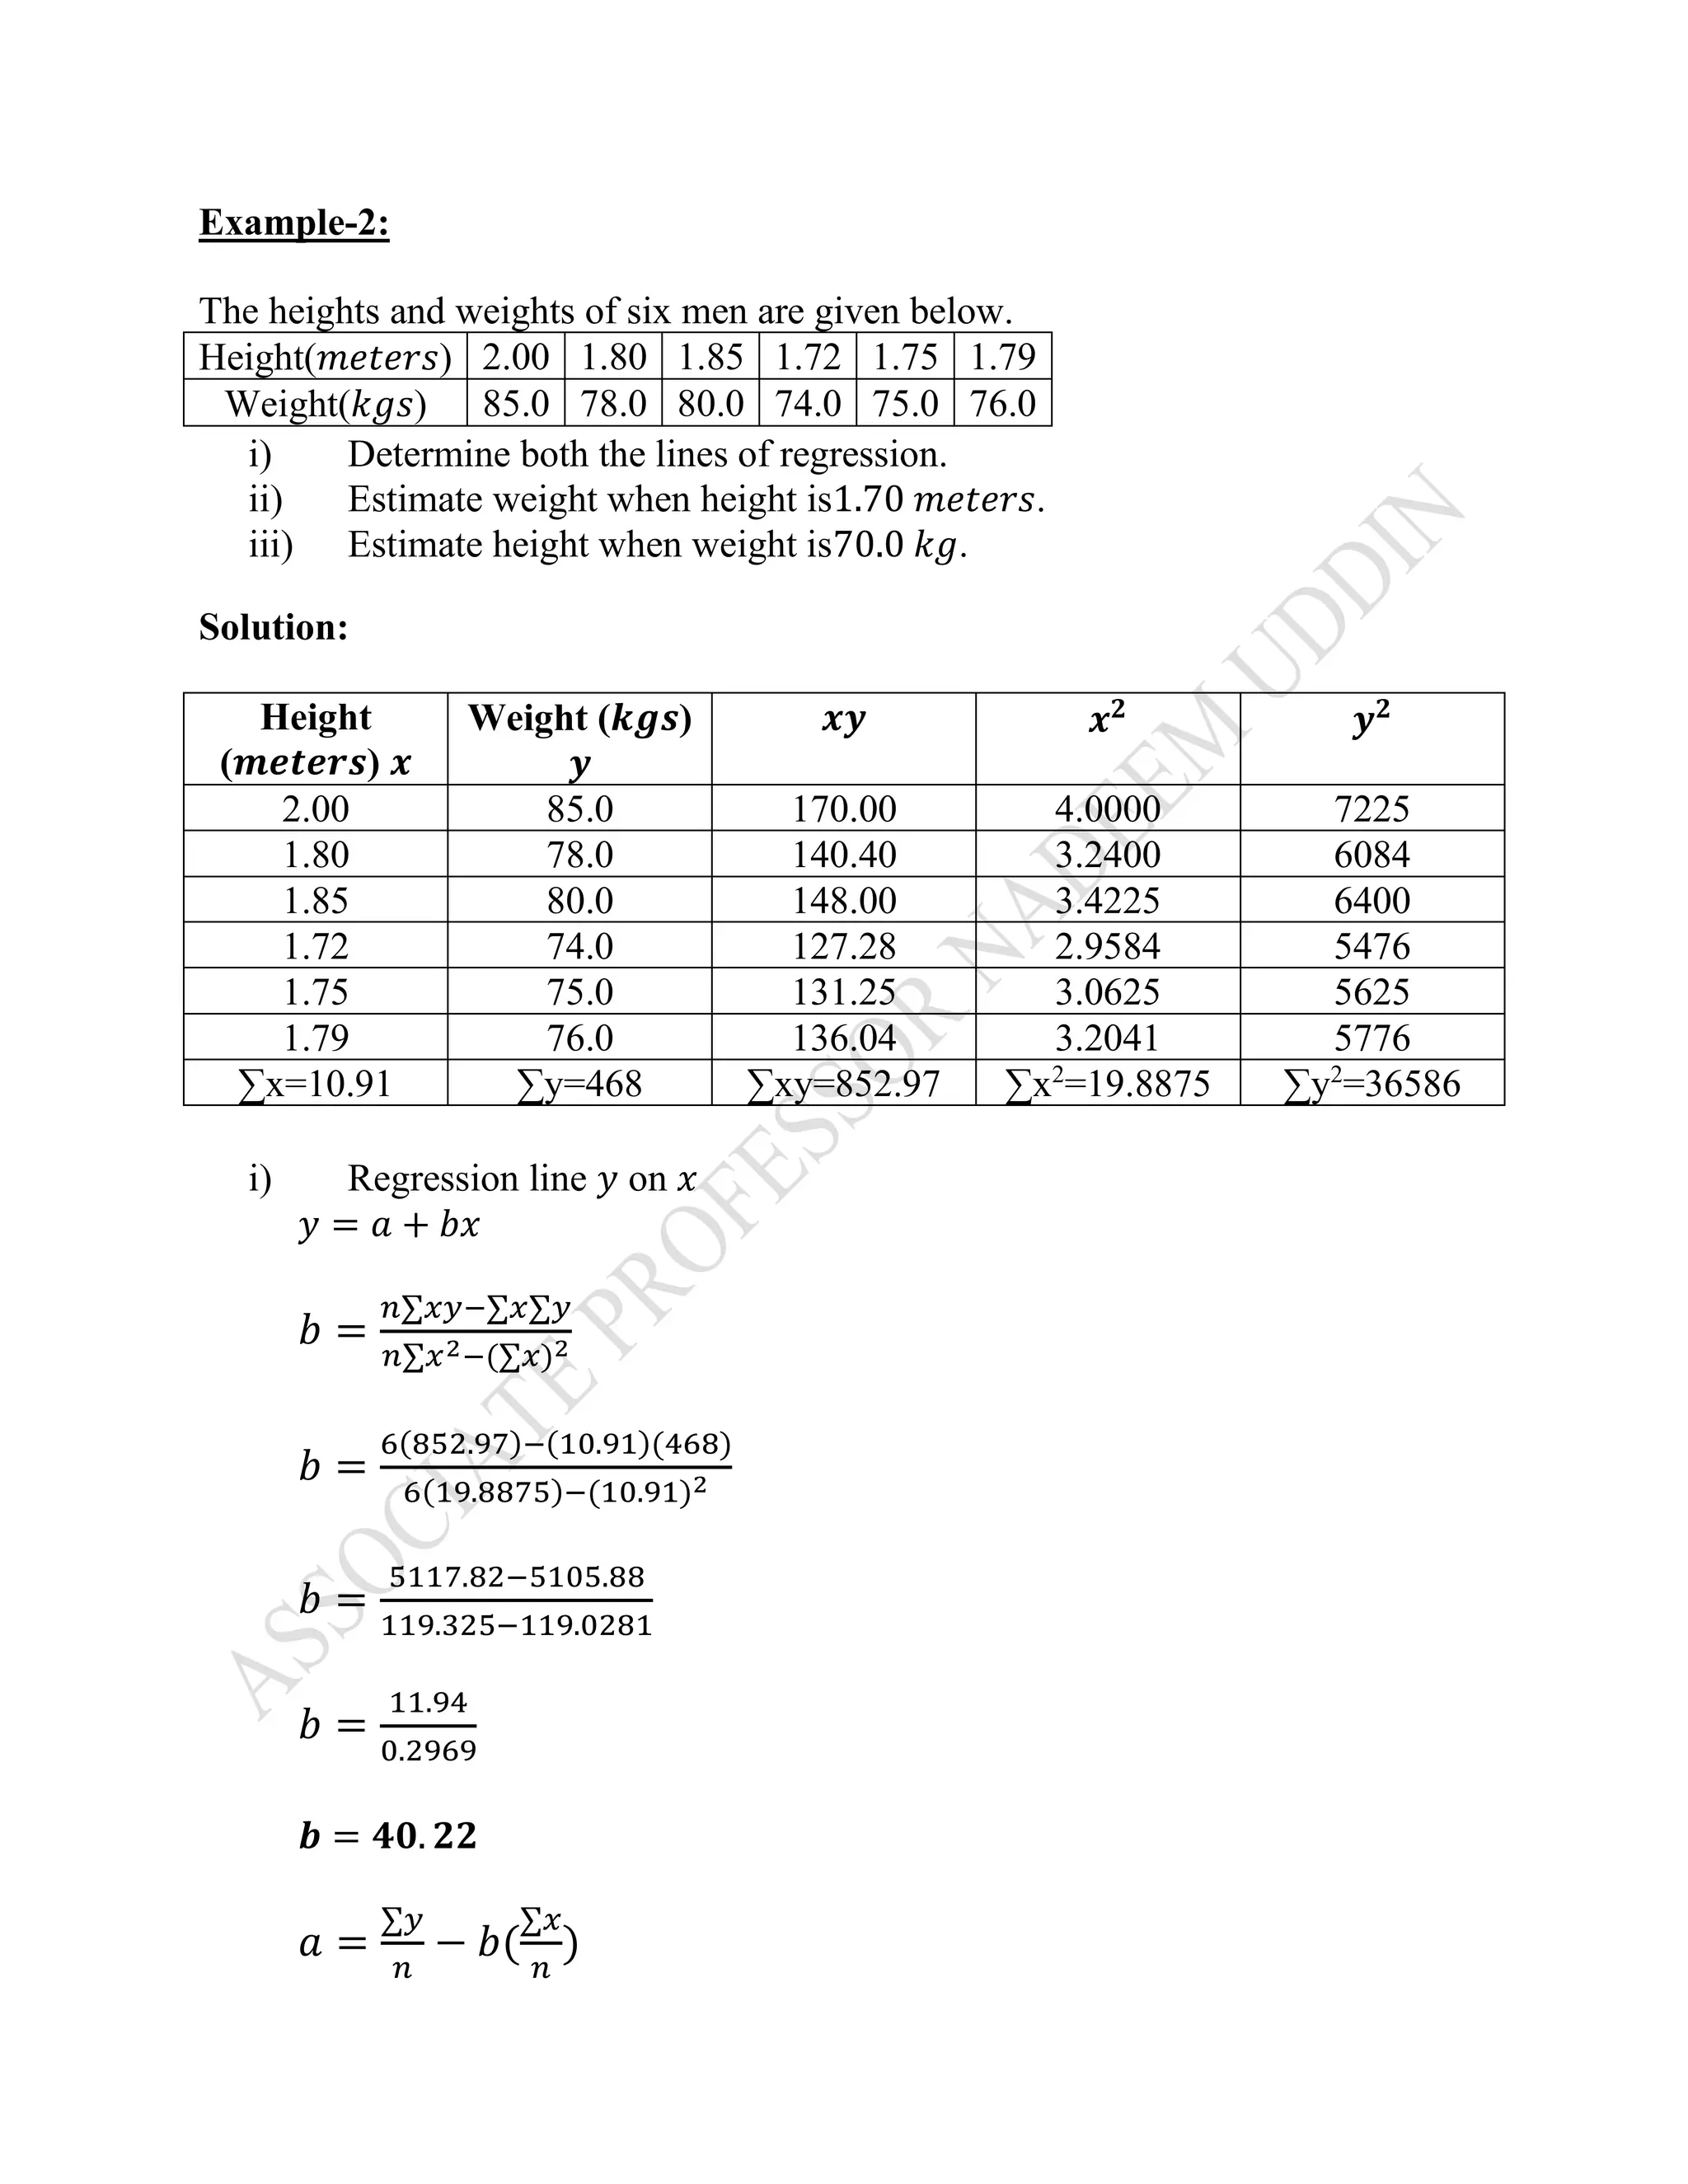
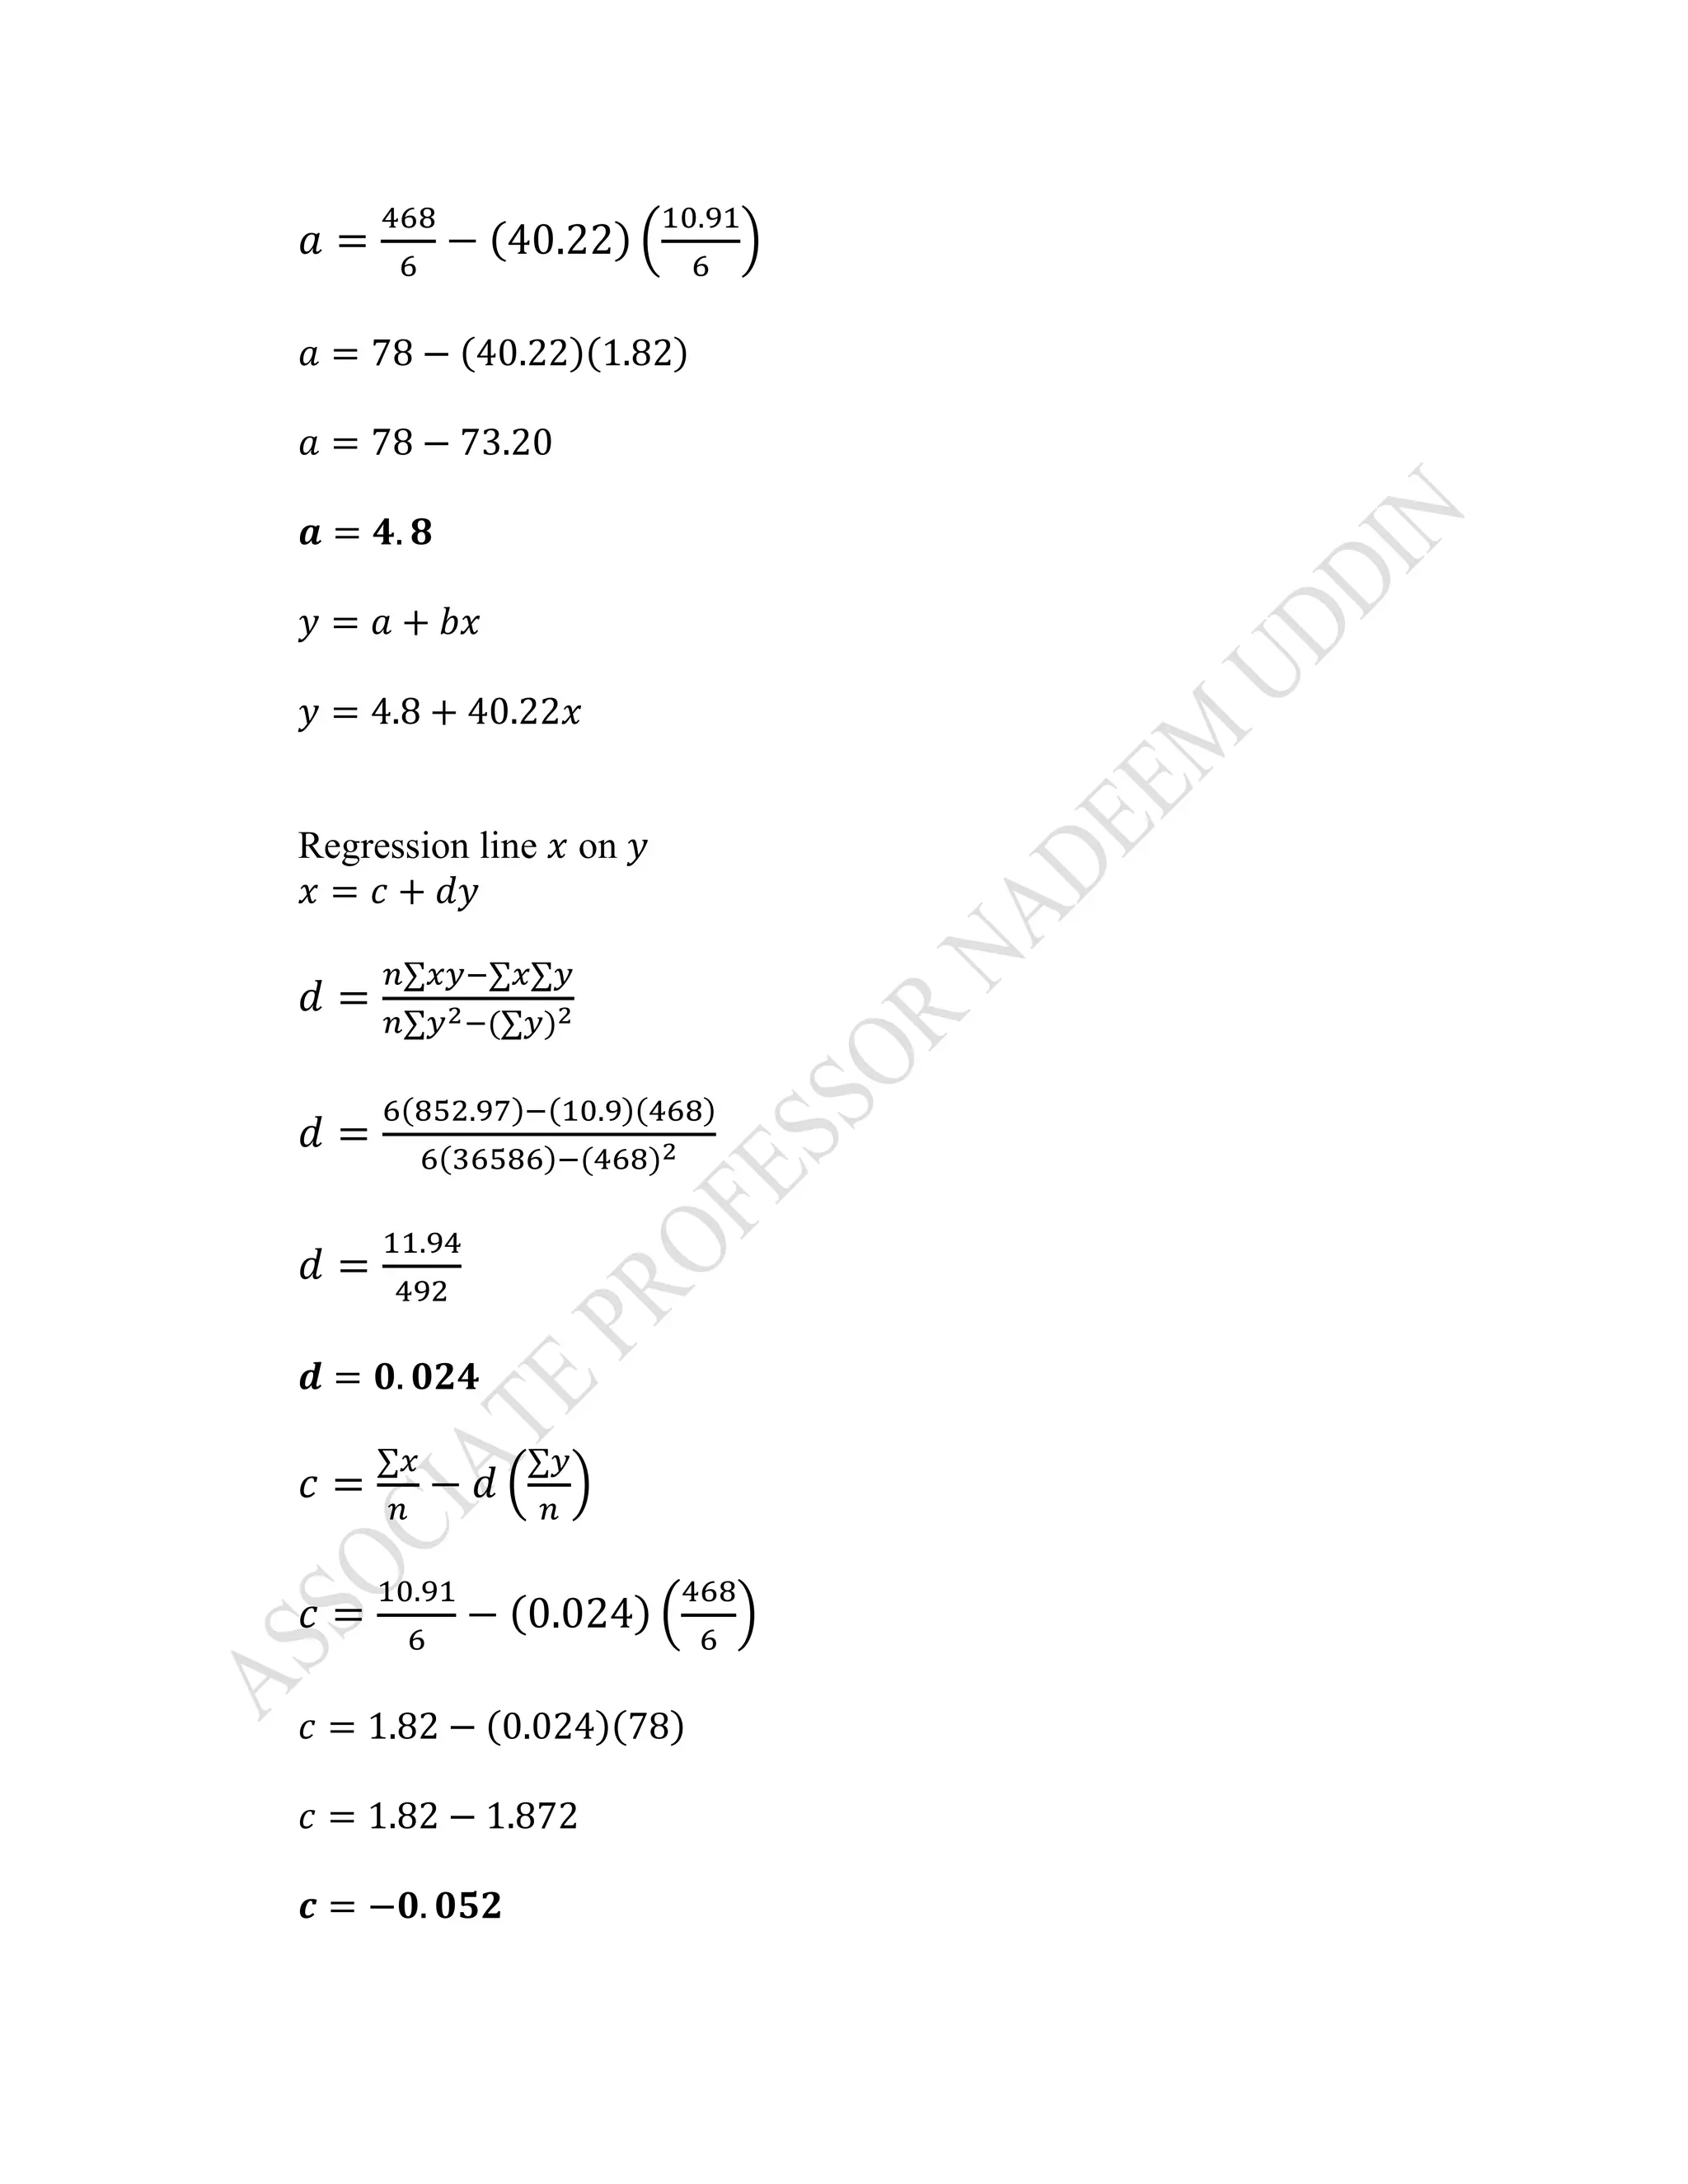
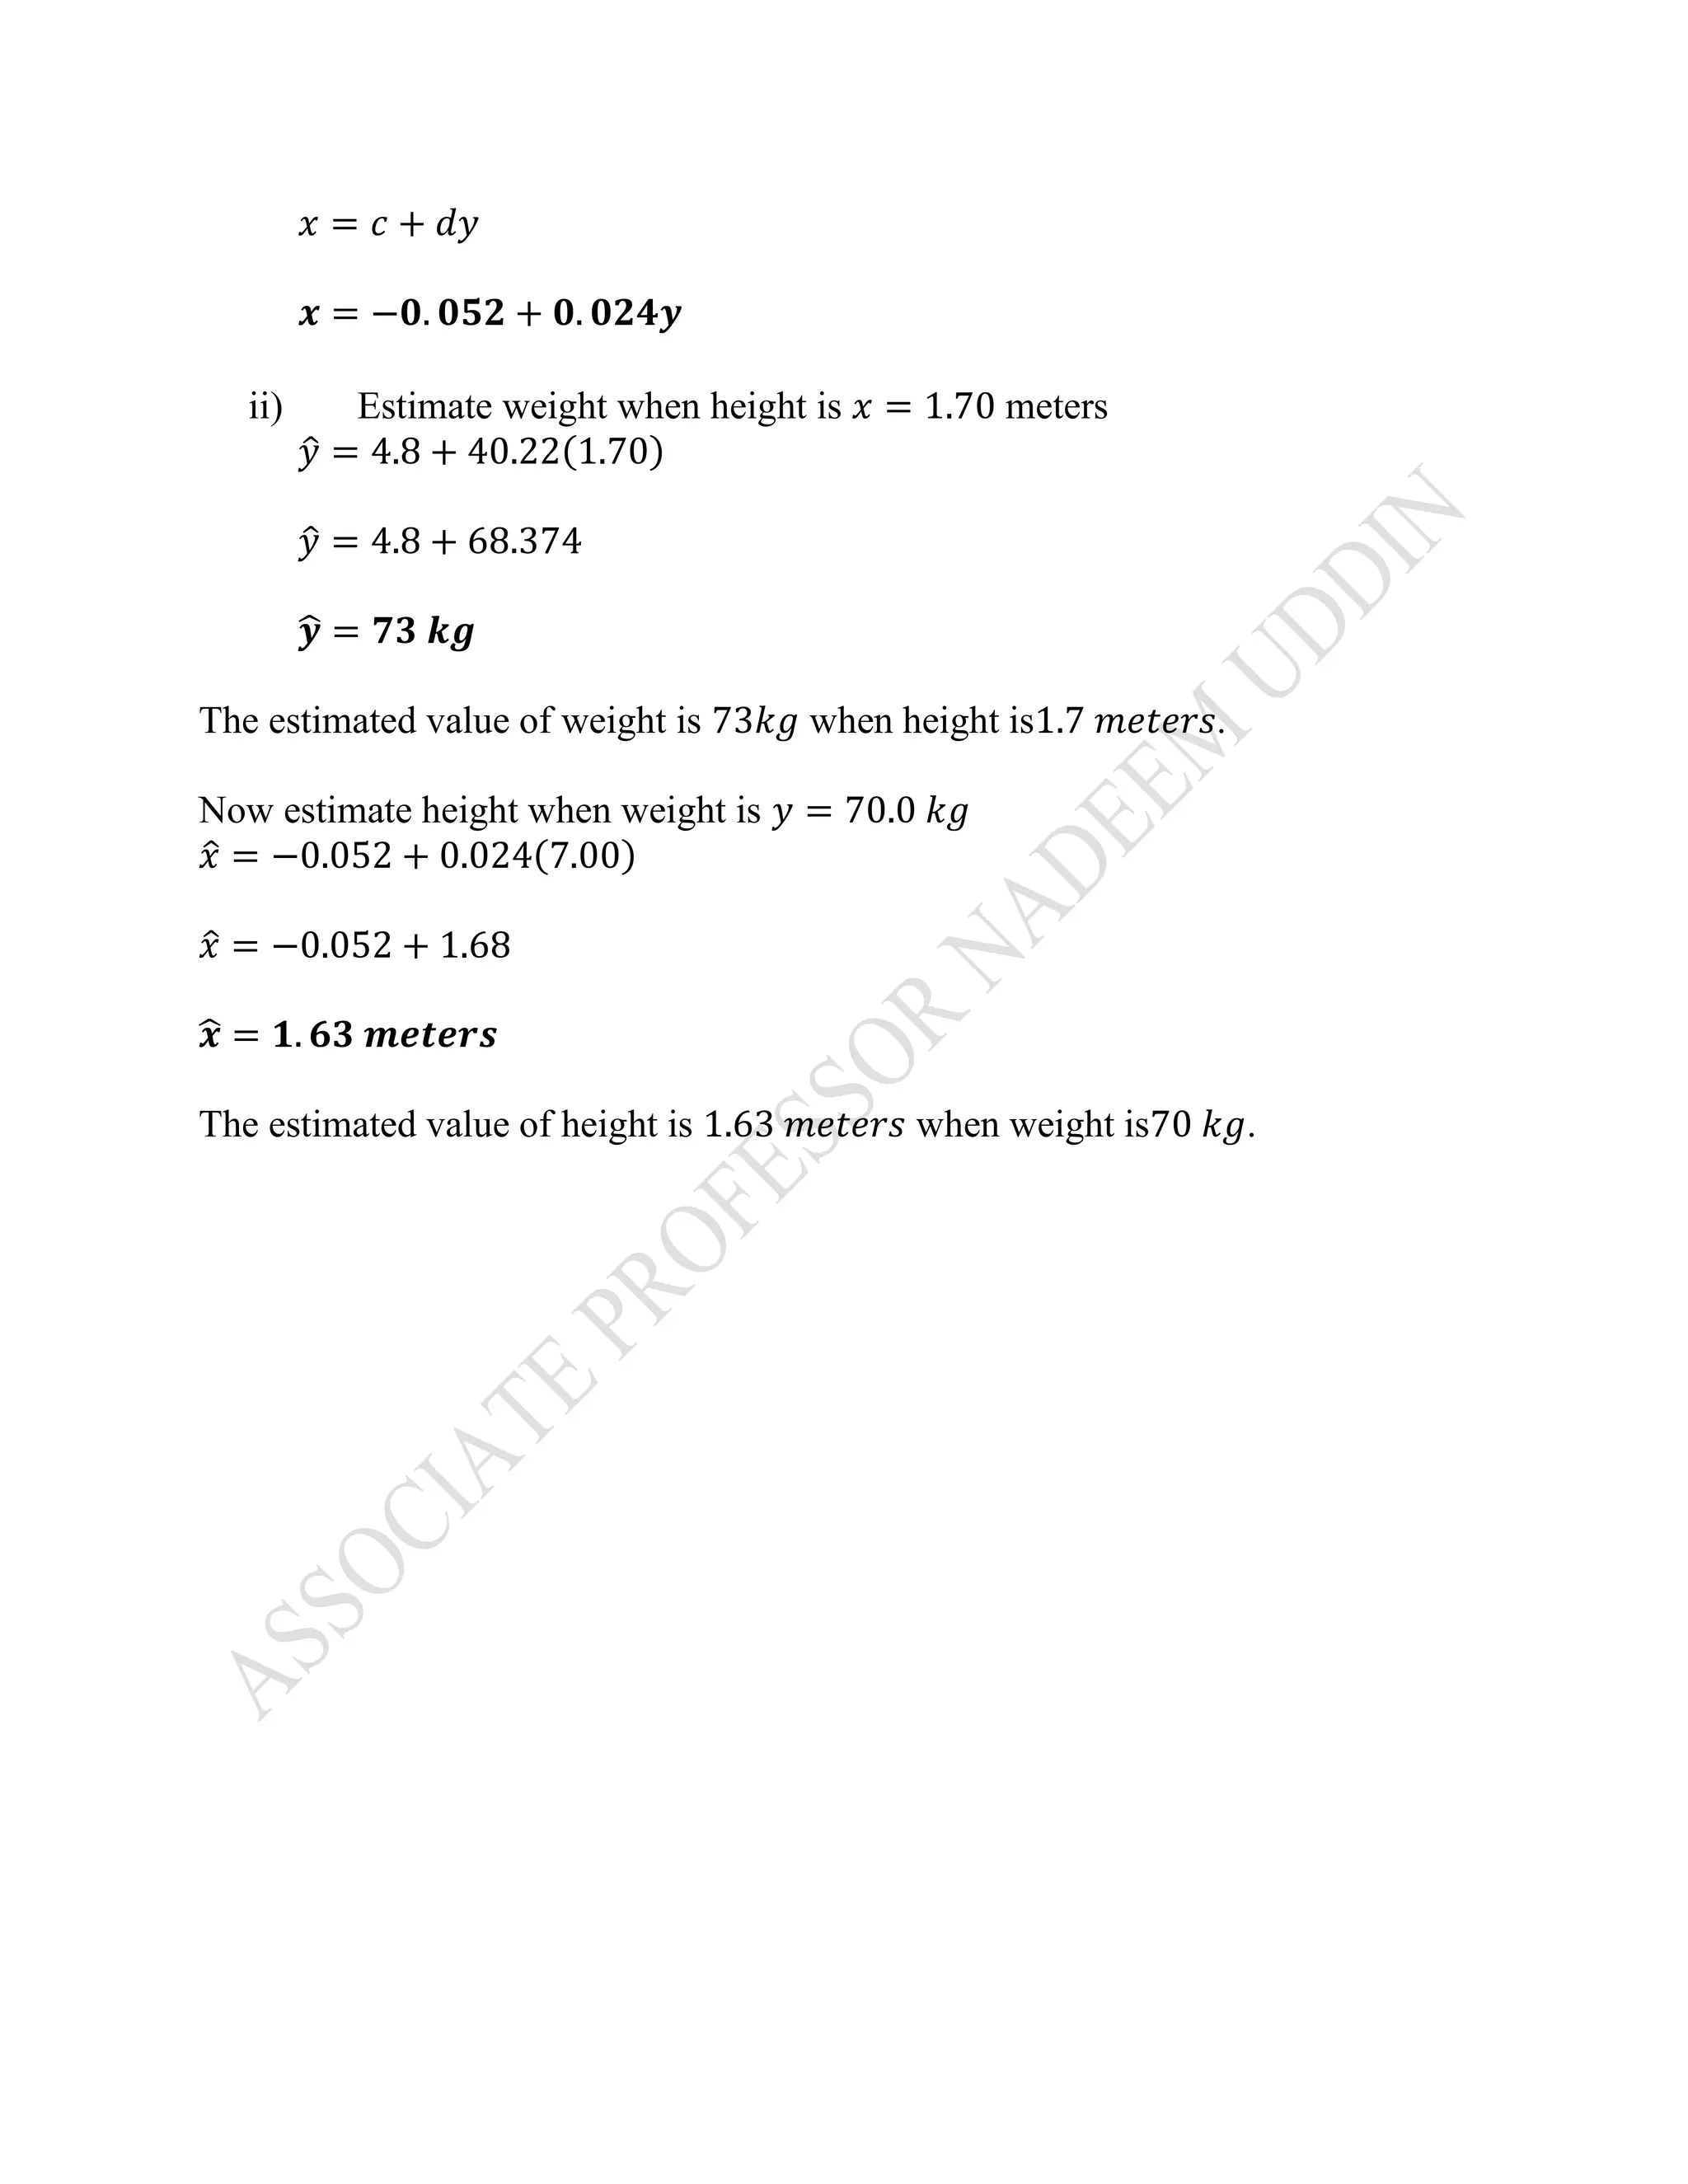

Regression is used to predict or estimate the value of a dependent variable based on the value of an independent variable. It involves plotting paired values of the independent and dependent variables on a scatter diagram to determine the relationship between them. The least squares line is an objective method for determining the line of best fit through the data points by minimizing the sum of the squares of the vertical distances of the points from the line. Examples are provided to demonstrate calculating the regression equations and using them to estimate values.