Download to read offline


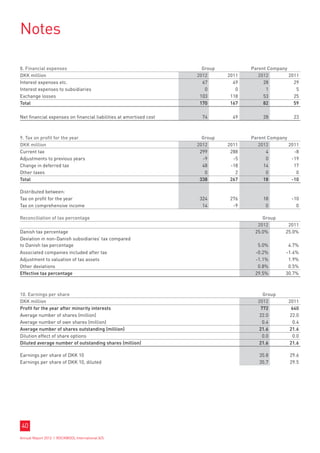
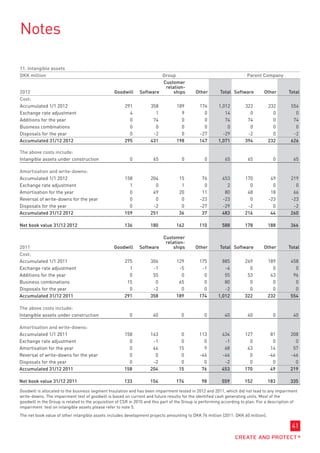
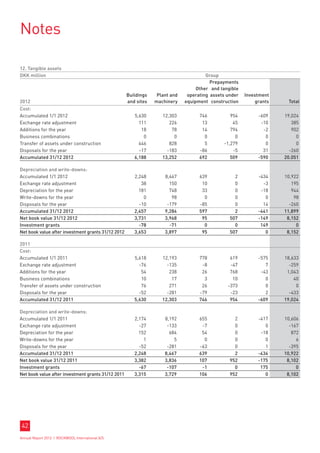
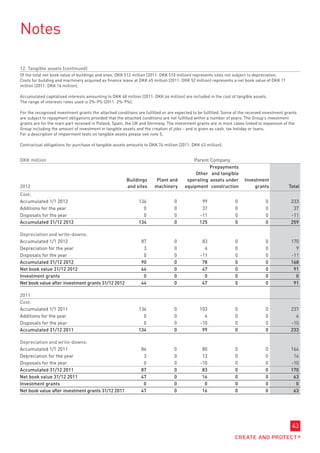


The document is an annual report for ROCKWOOL Group for the year 2012. It discusses how energy efficiency and climate change are major growth drivers for the insulation industry. Buildings account for about 40% of energy consumption in developed countries and energy demand is growing rapidly in emerging economies. Insulating buildings can save billions in energy costs and reduce CO2 emissions, while also creating many jobs in the construction industry. The report outlines new regulations and initiatives in the EU and other countries aimed at improving energy efficiency of new and existing buildings.


