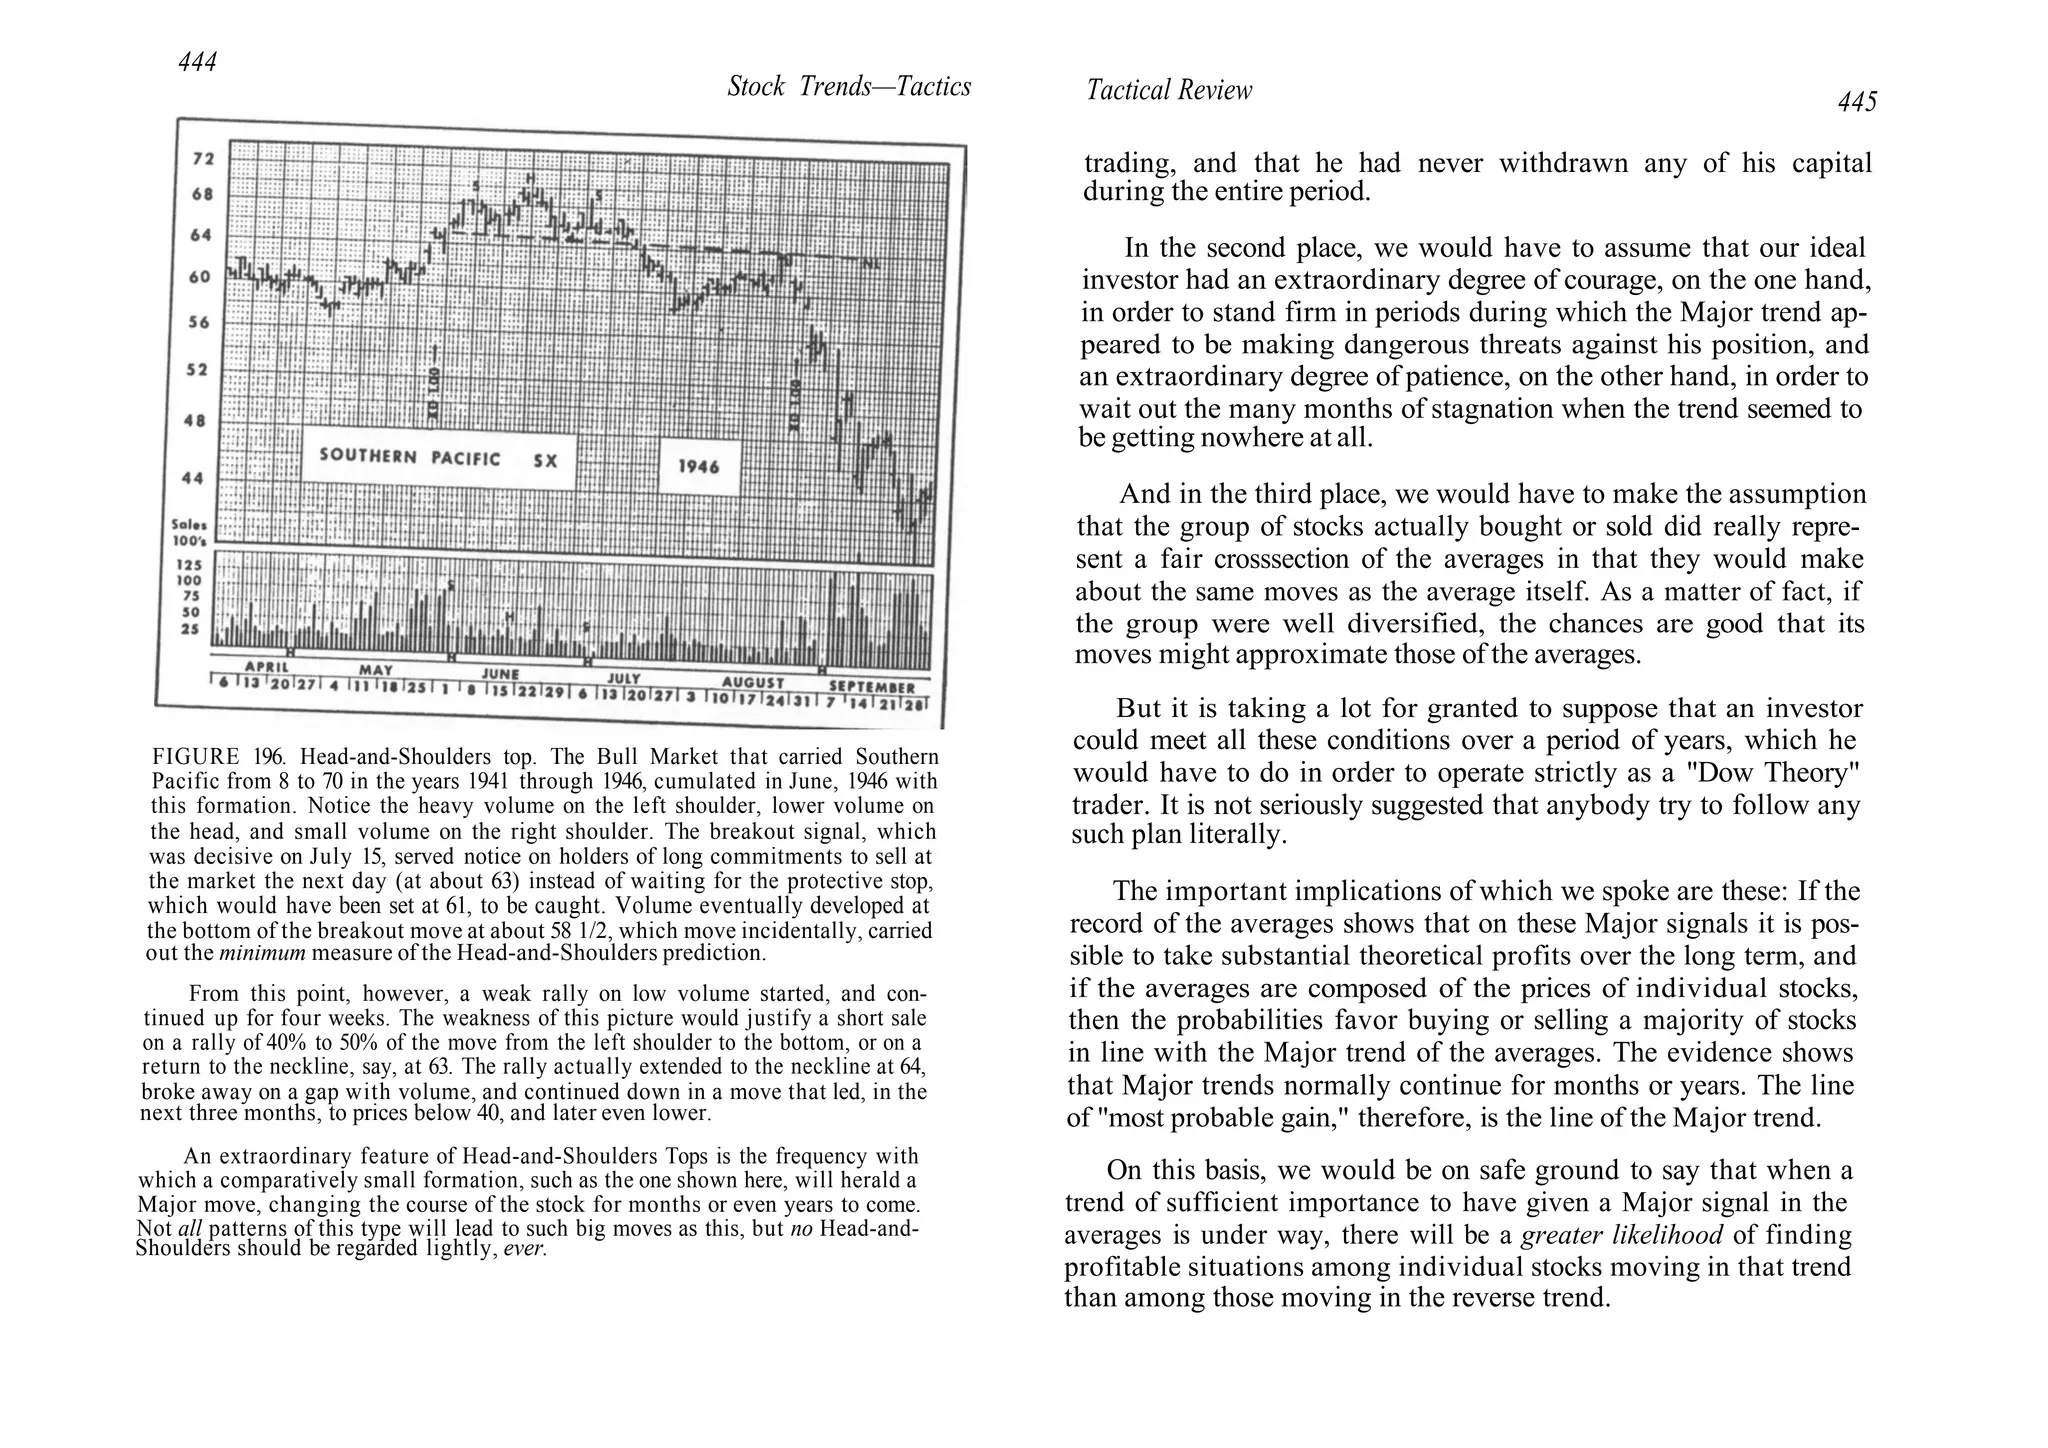
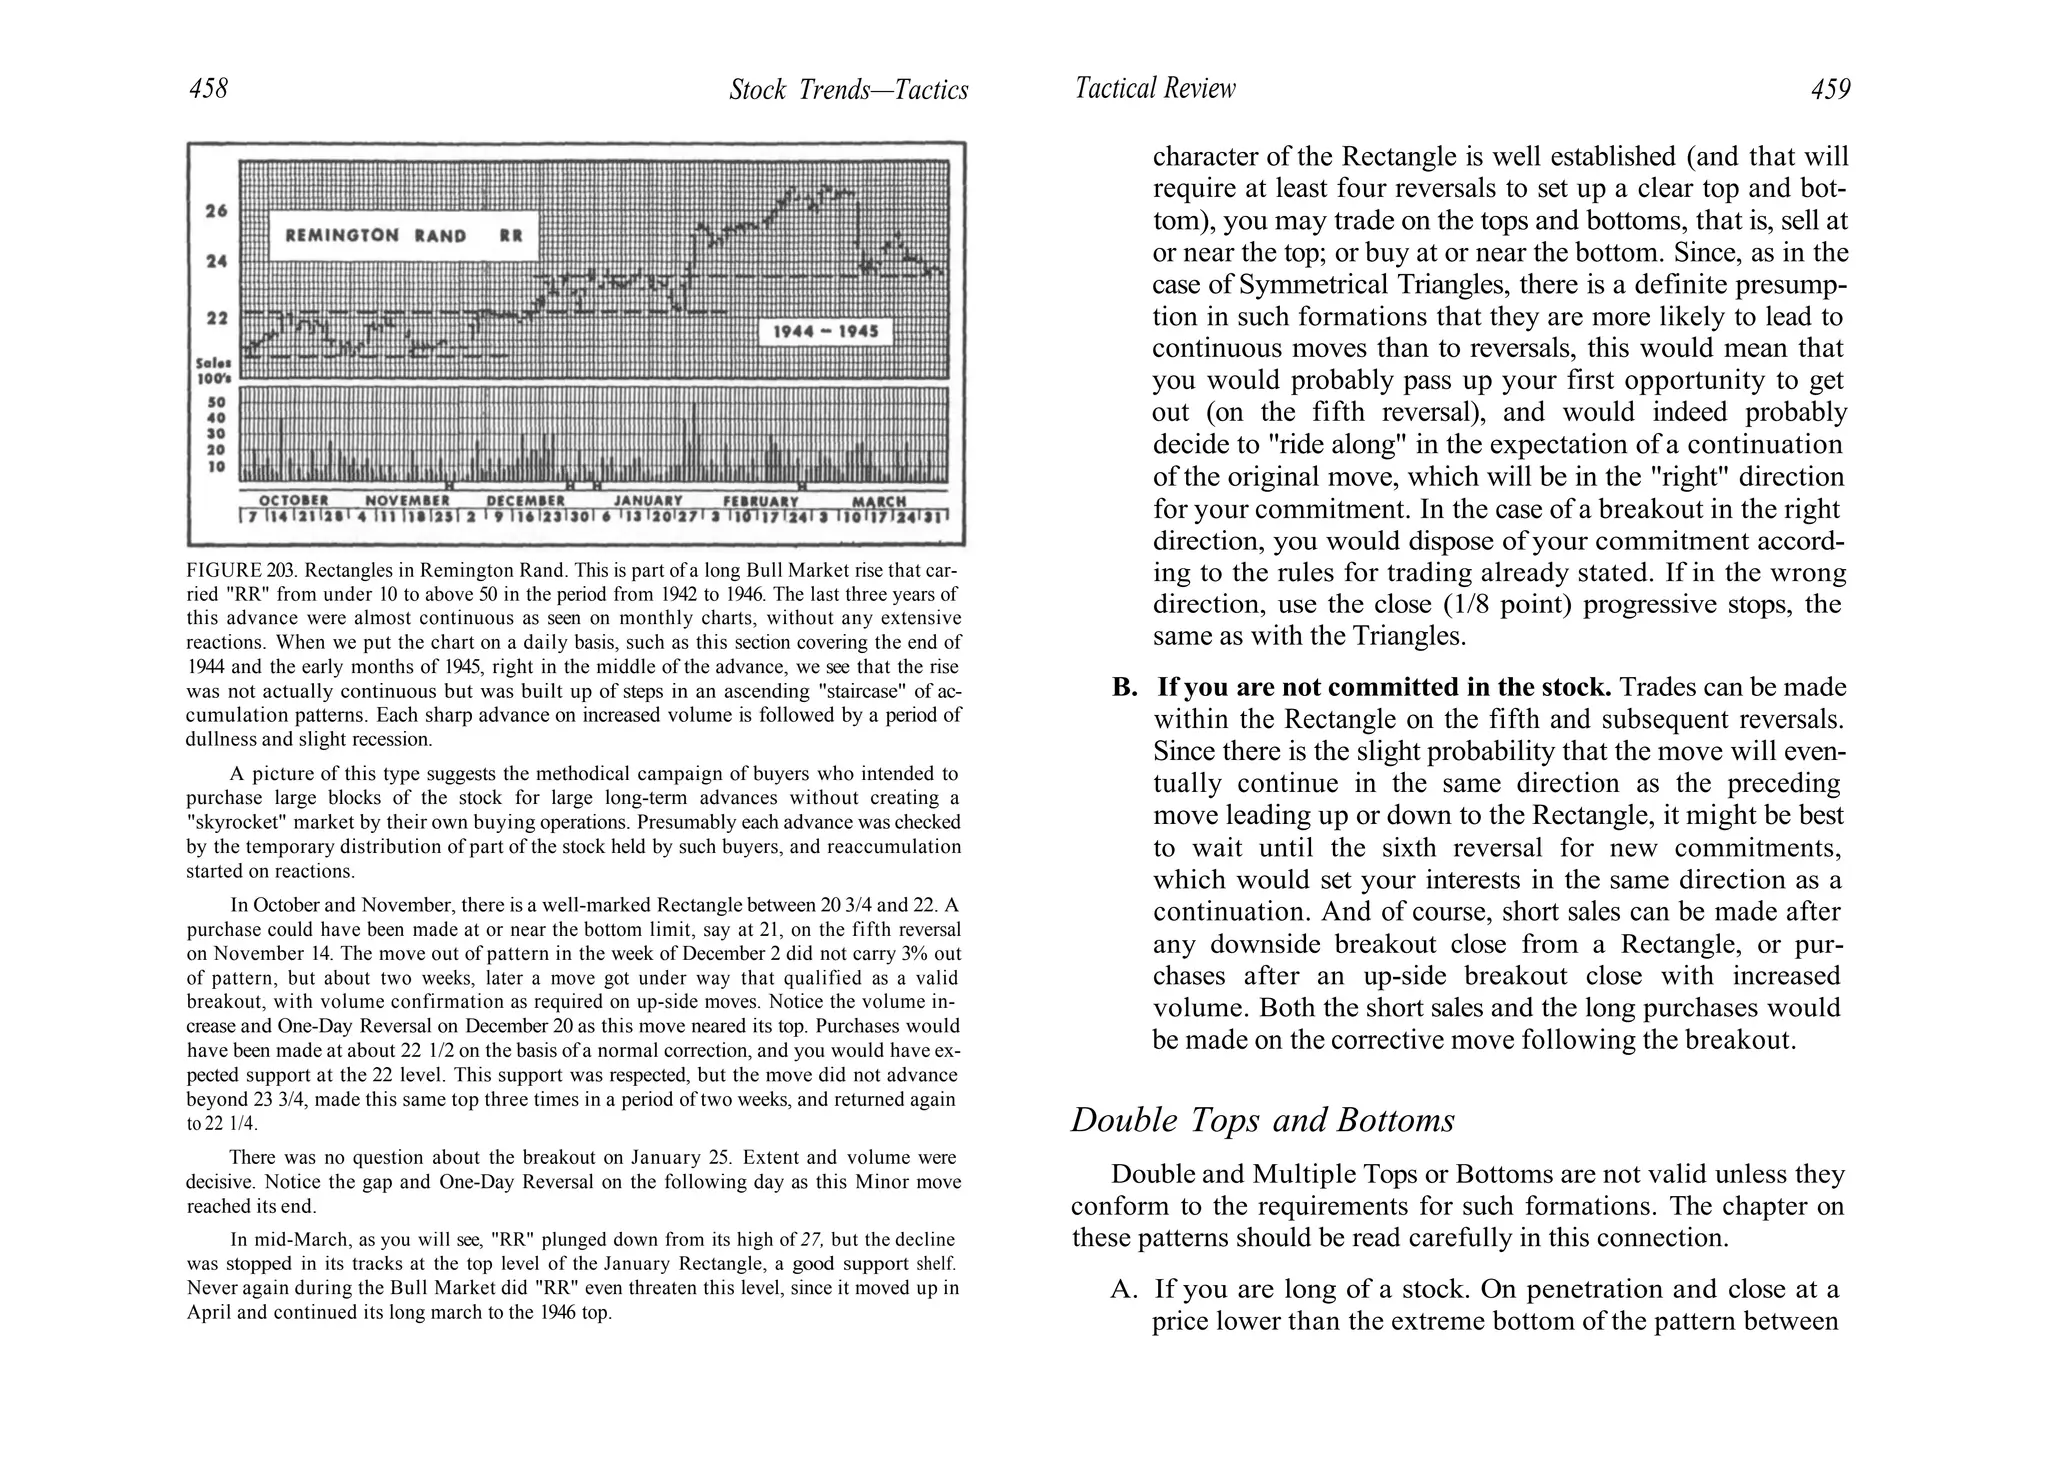
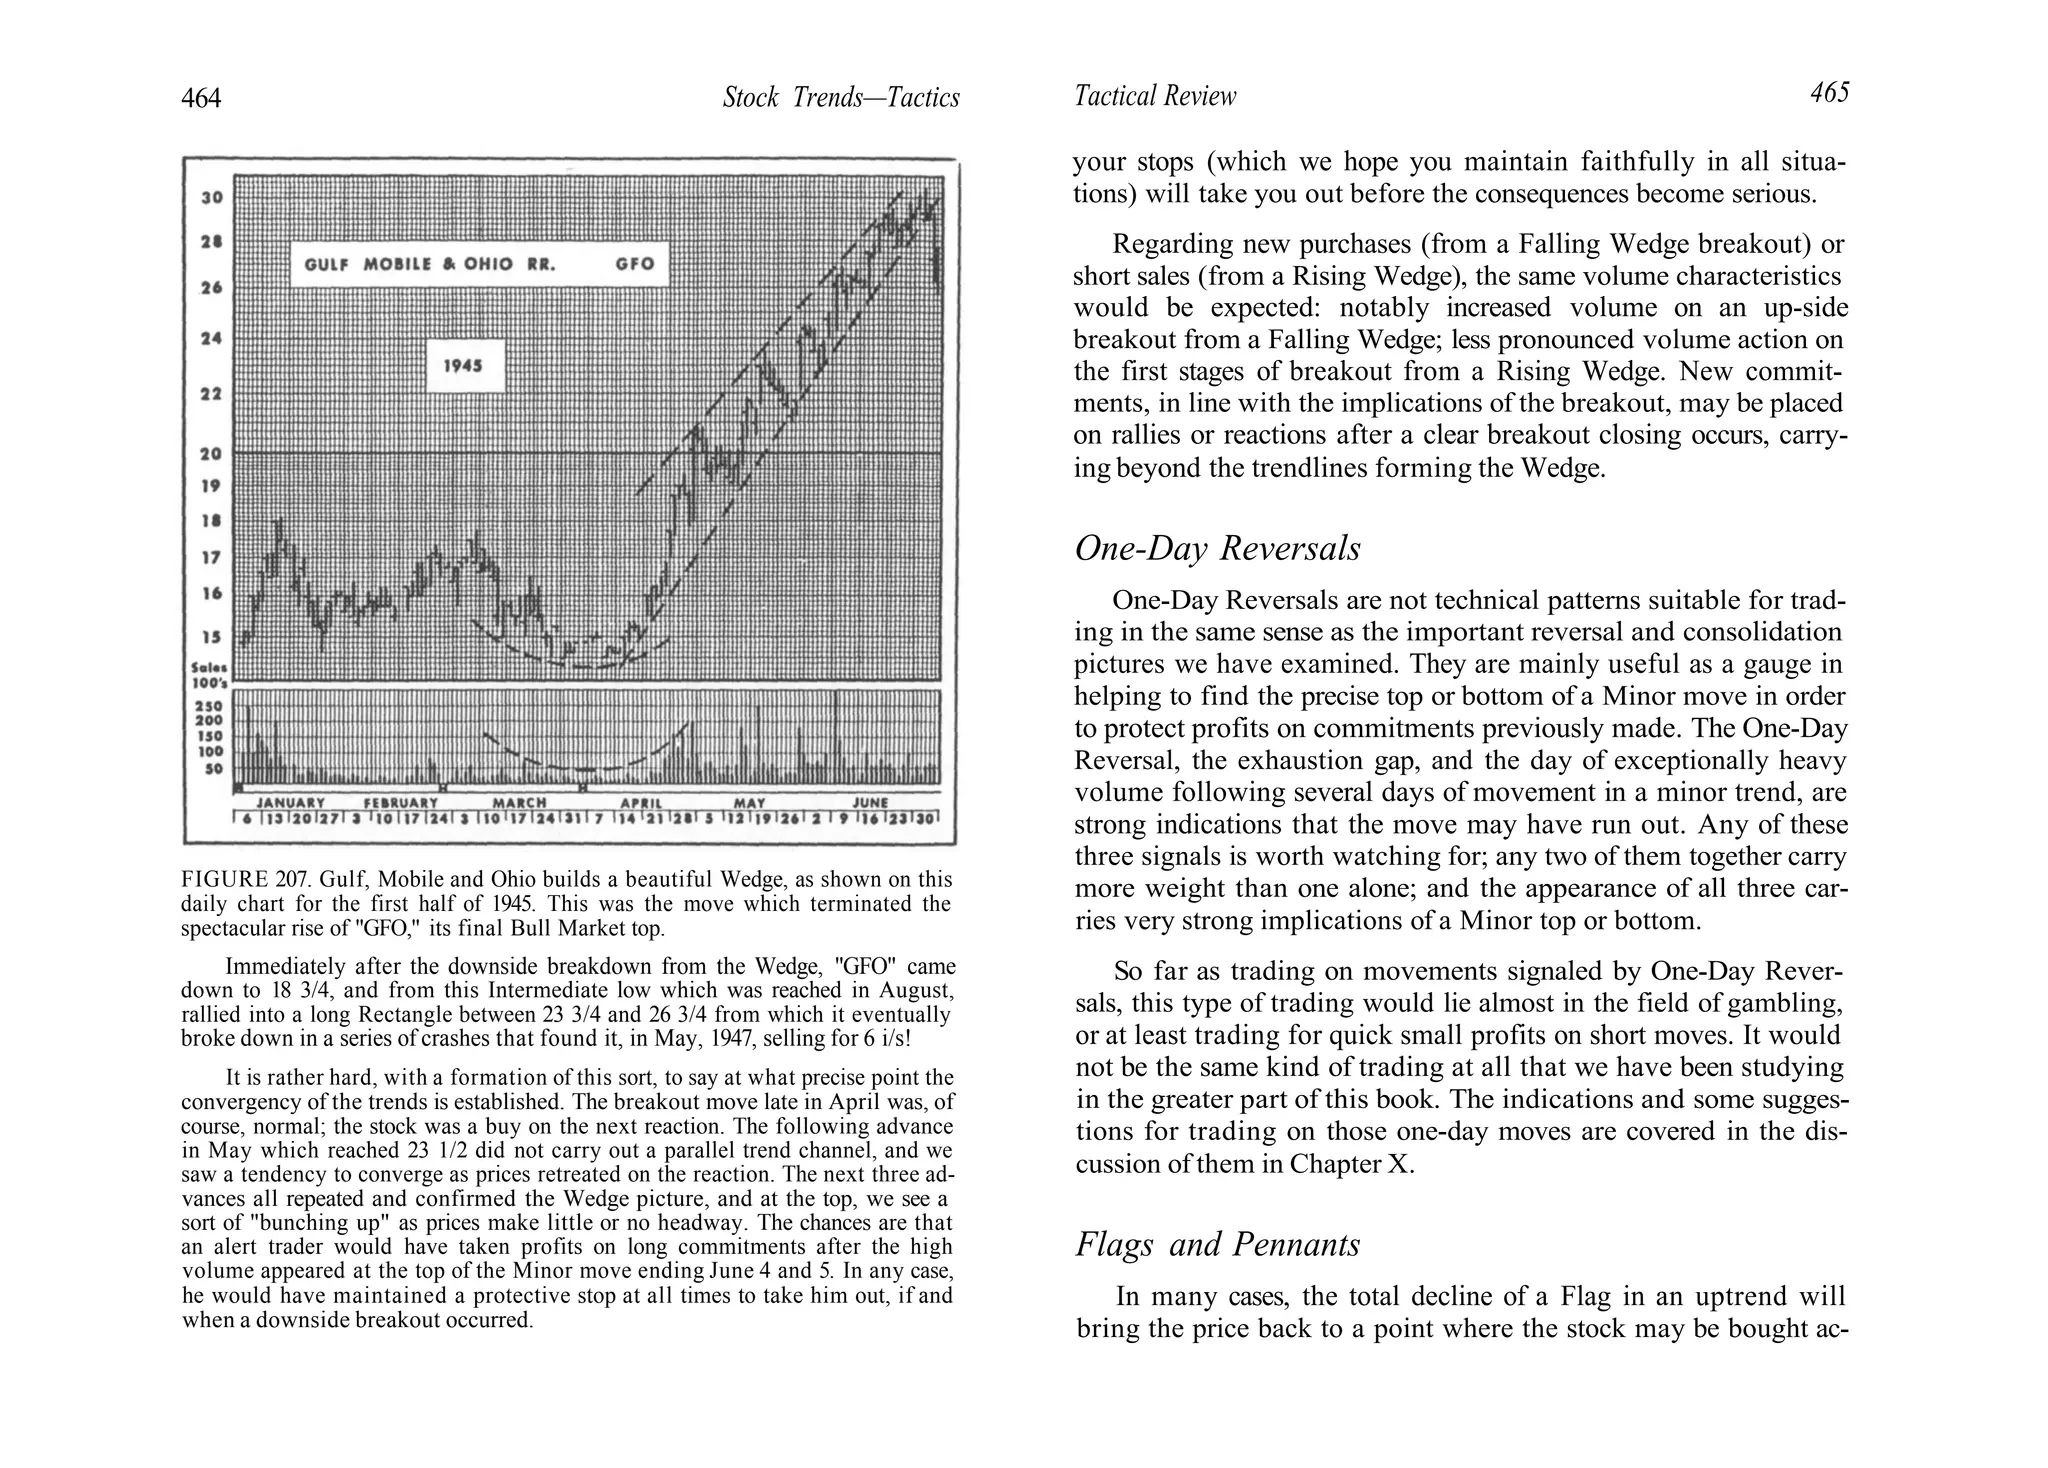
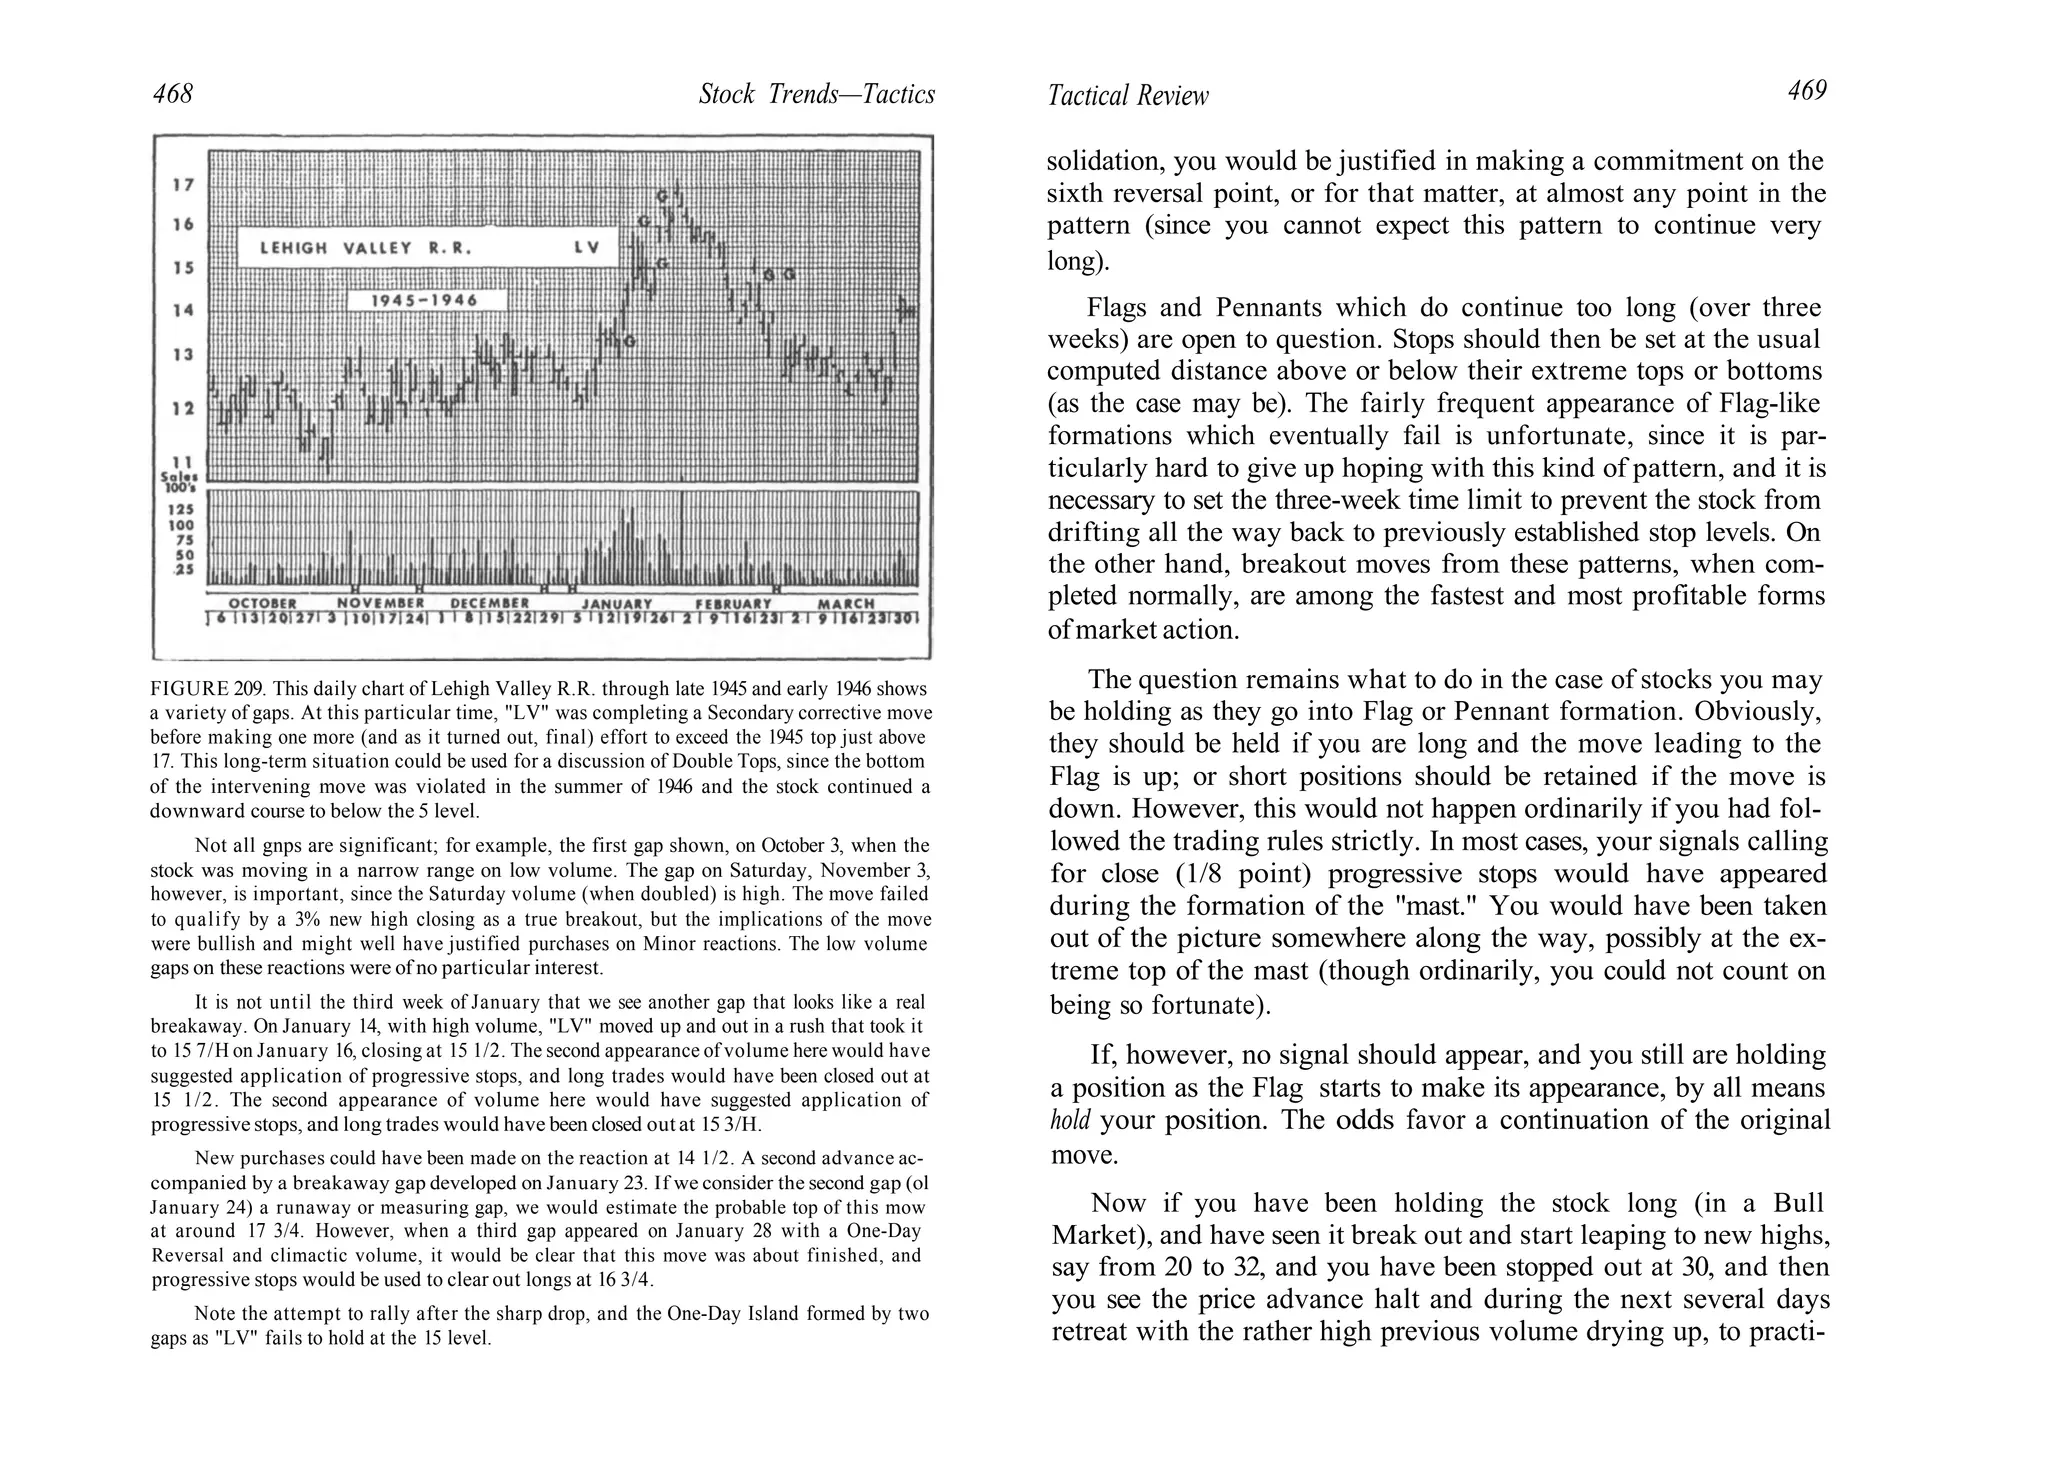
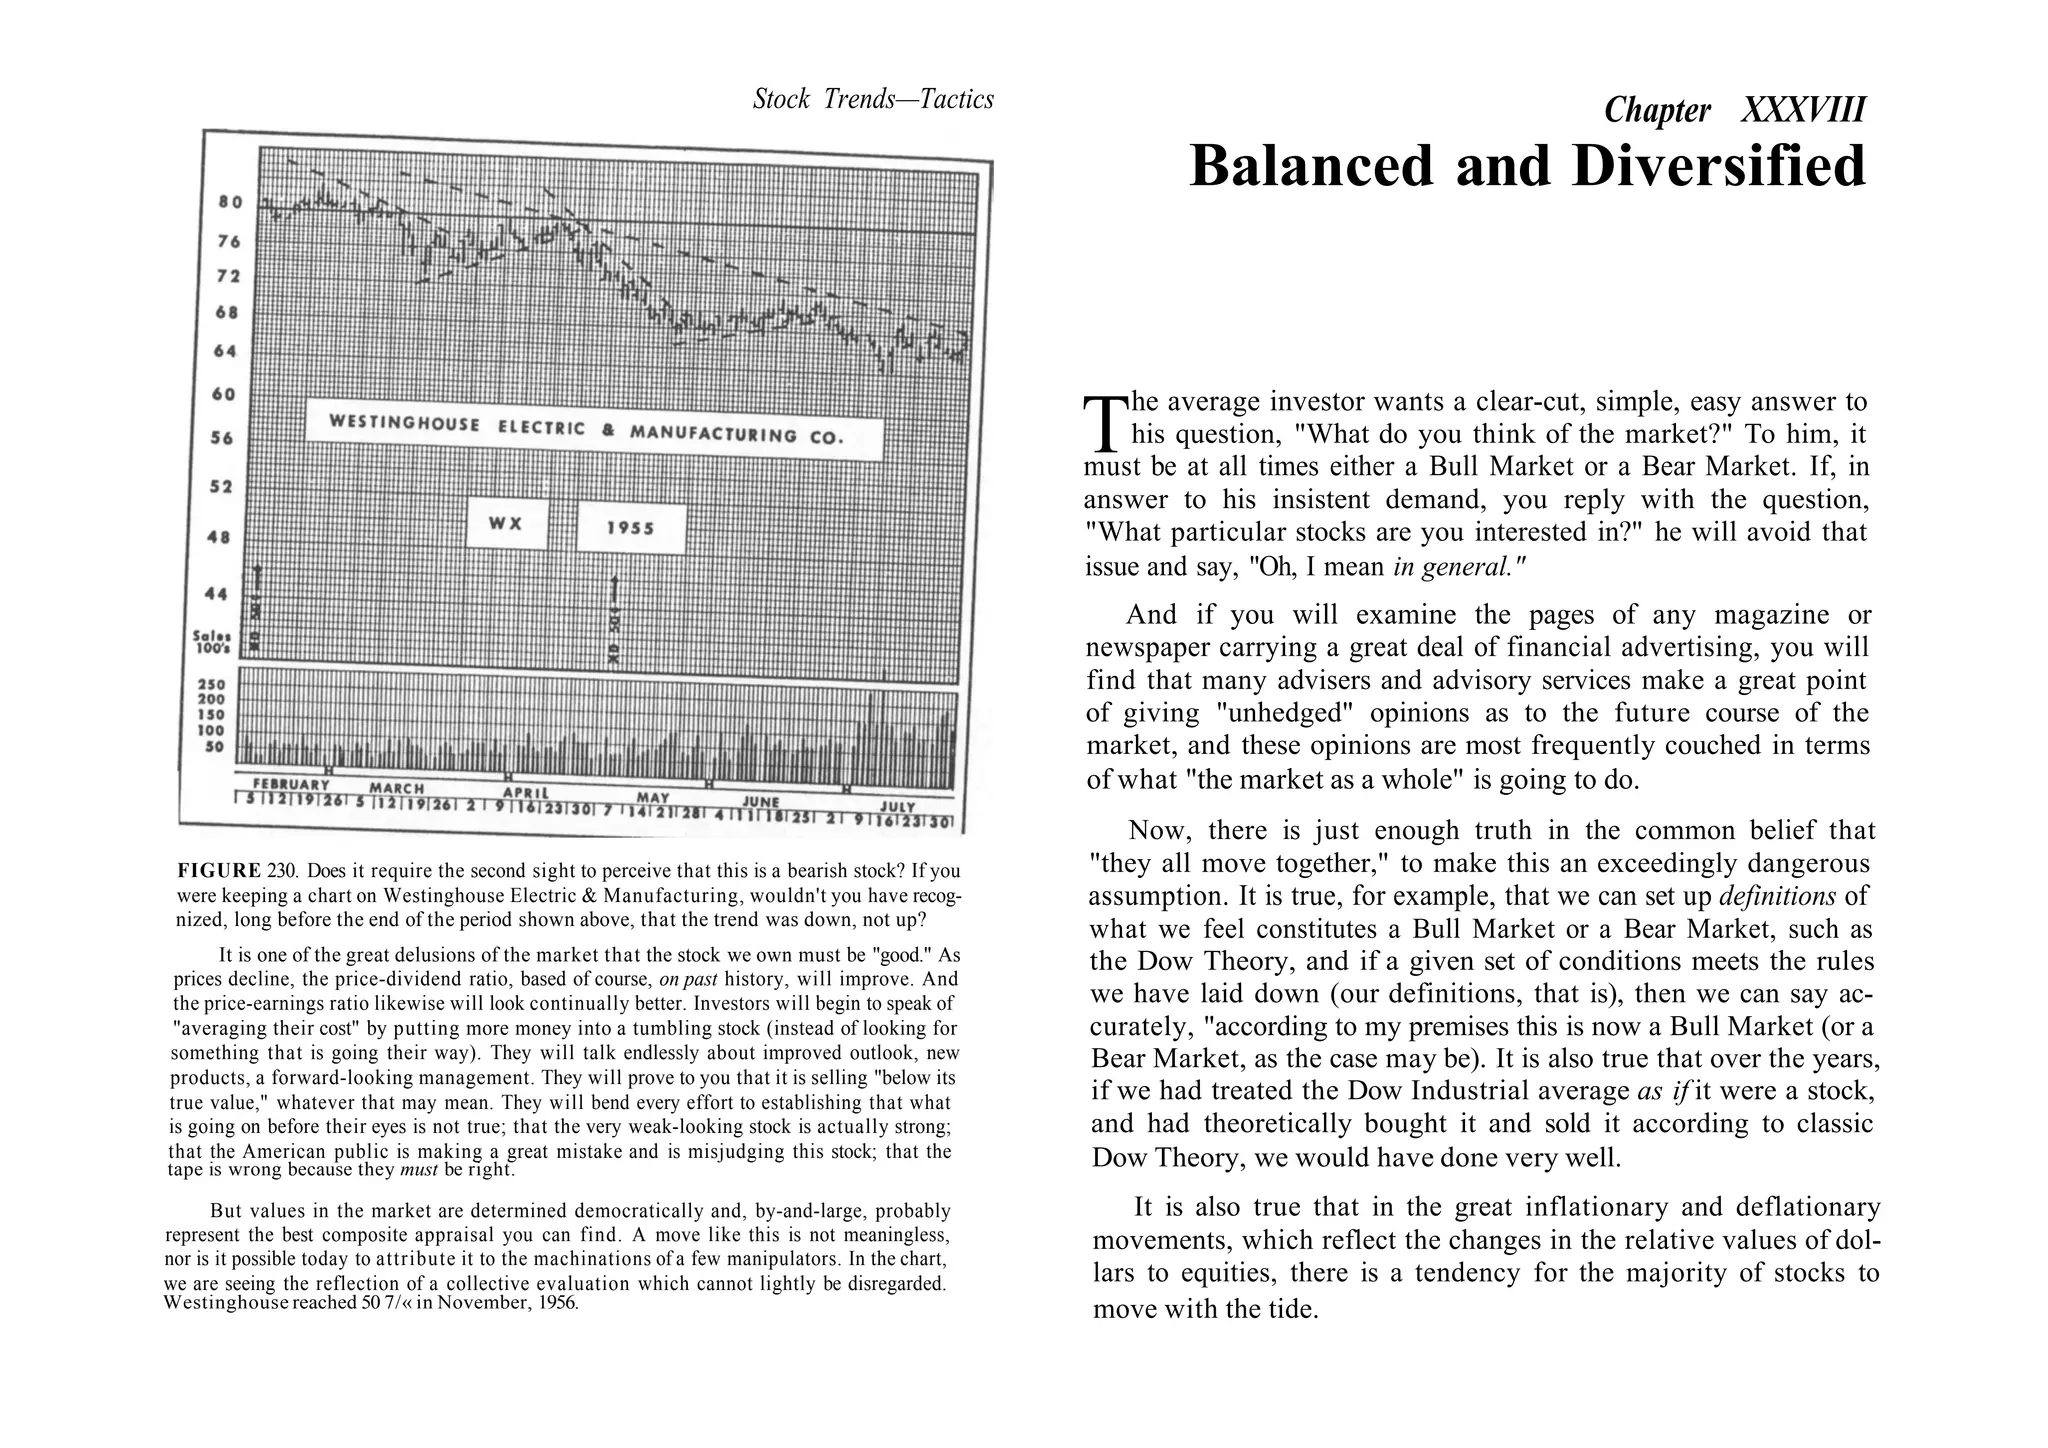
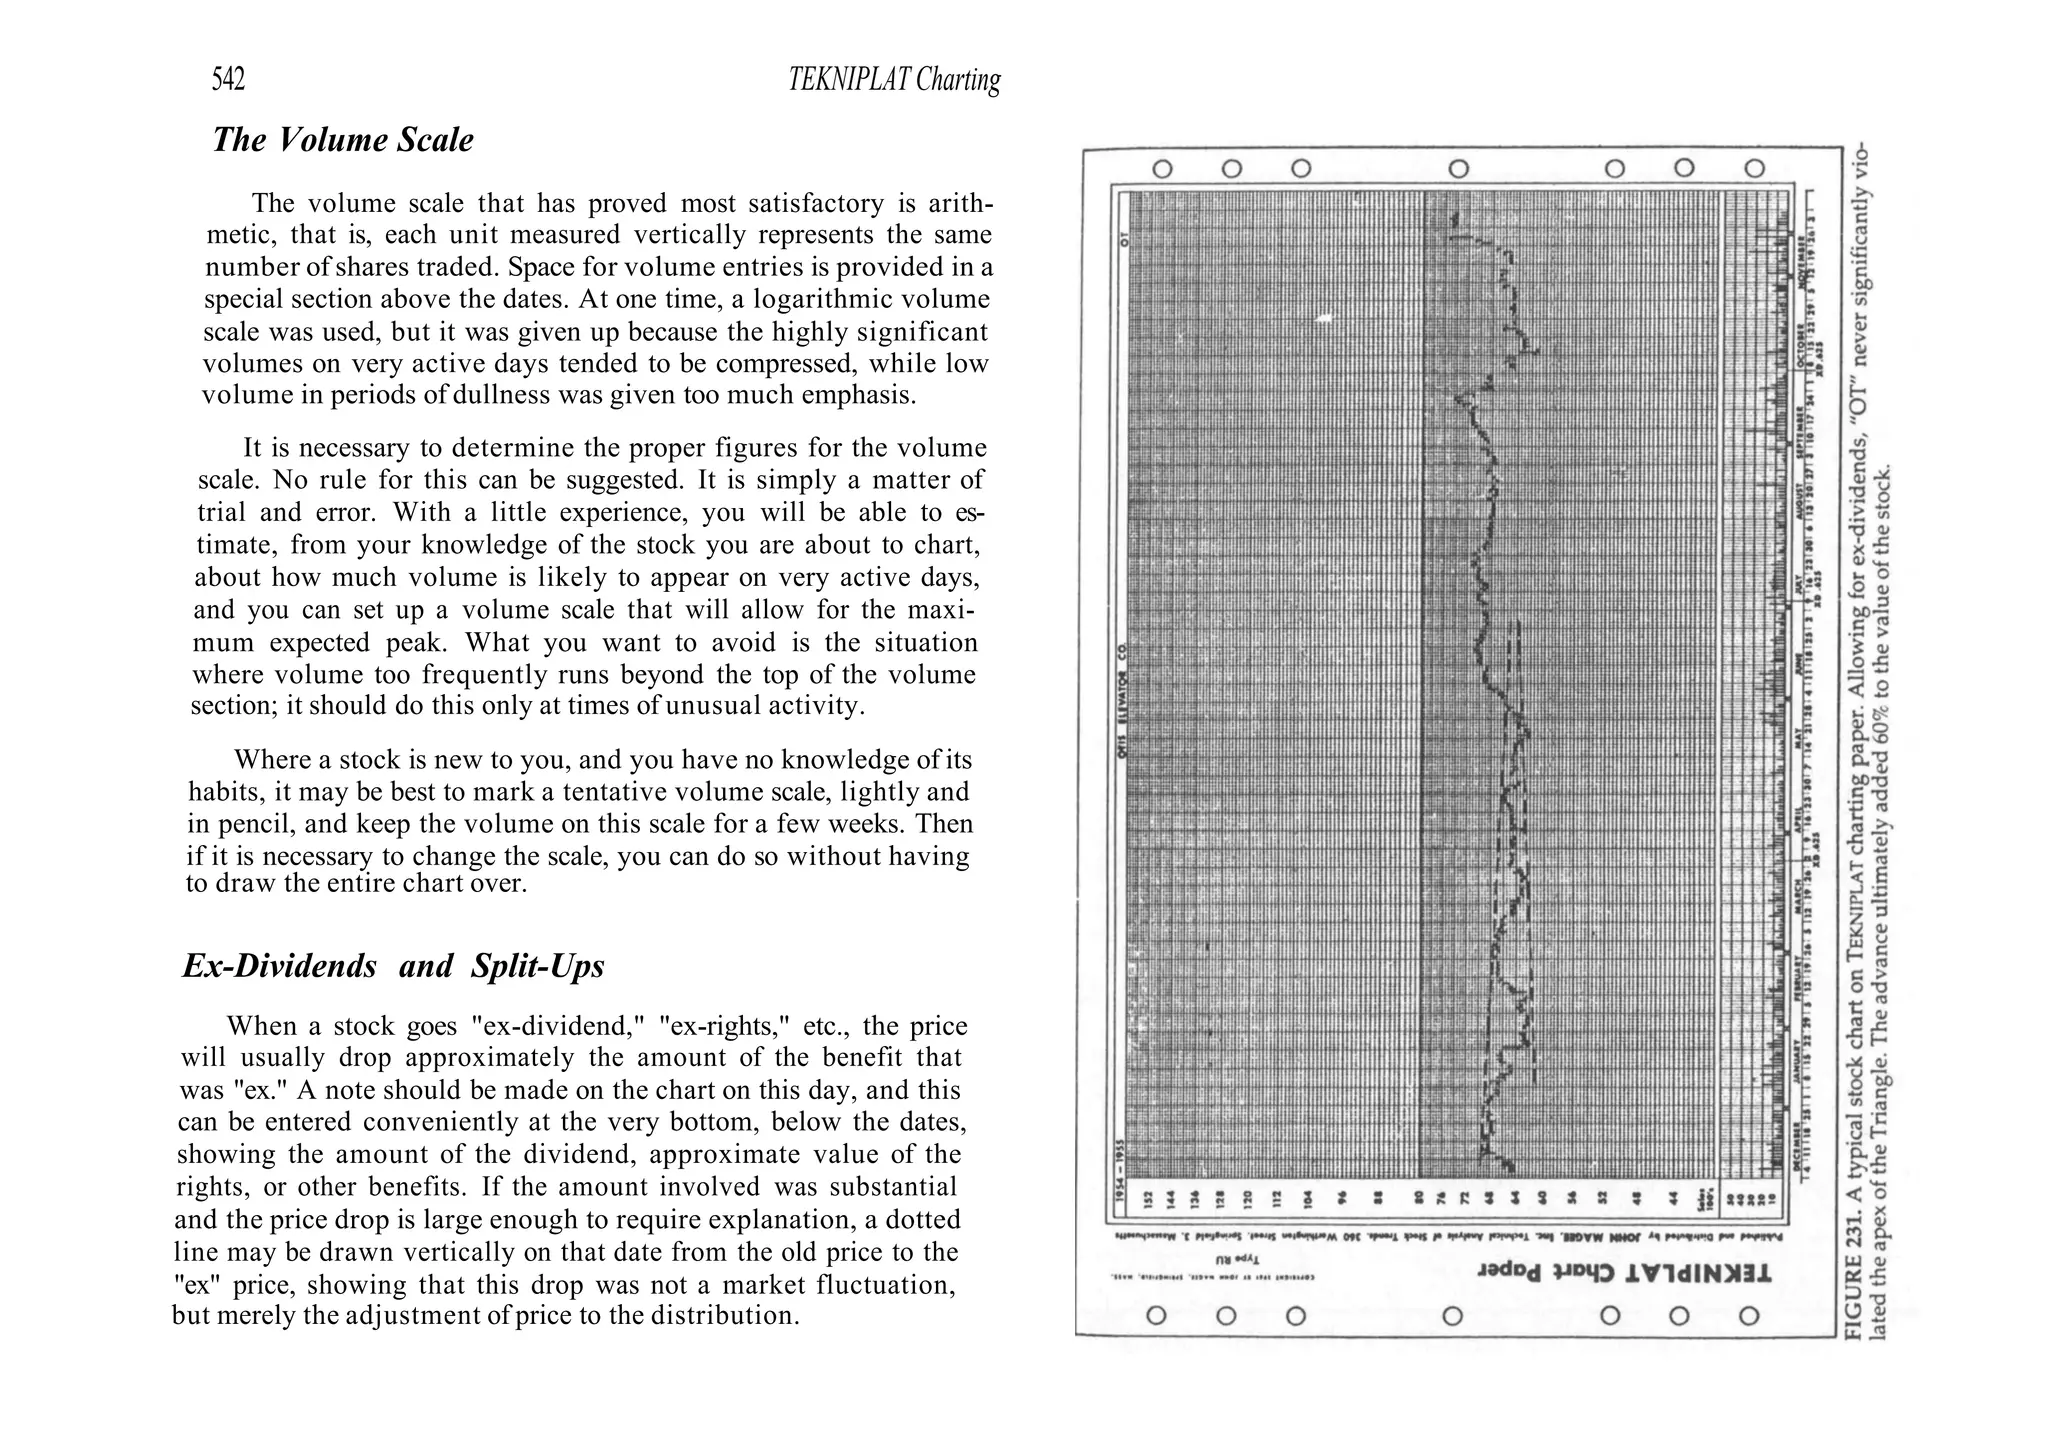
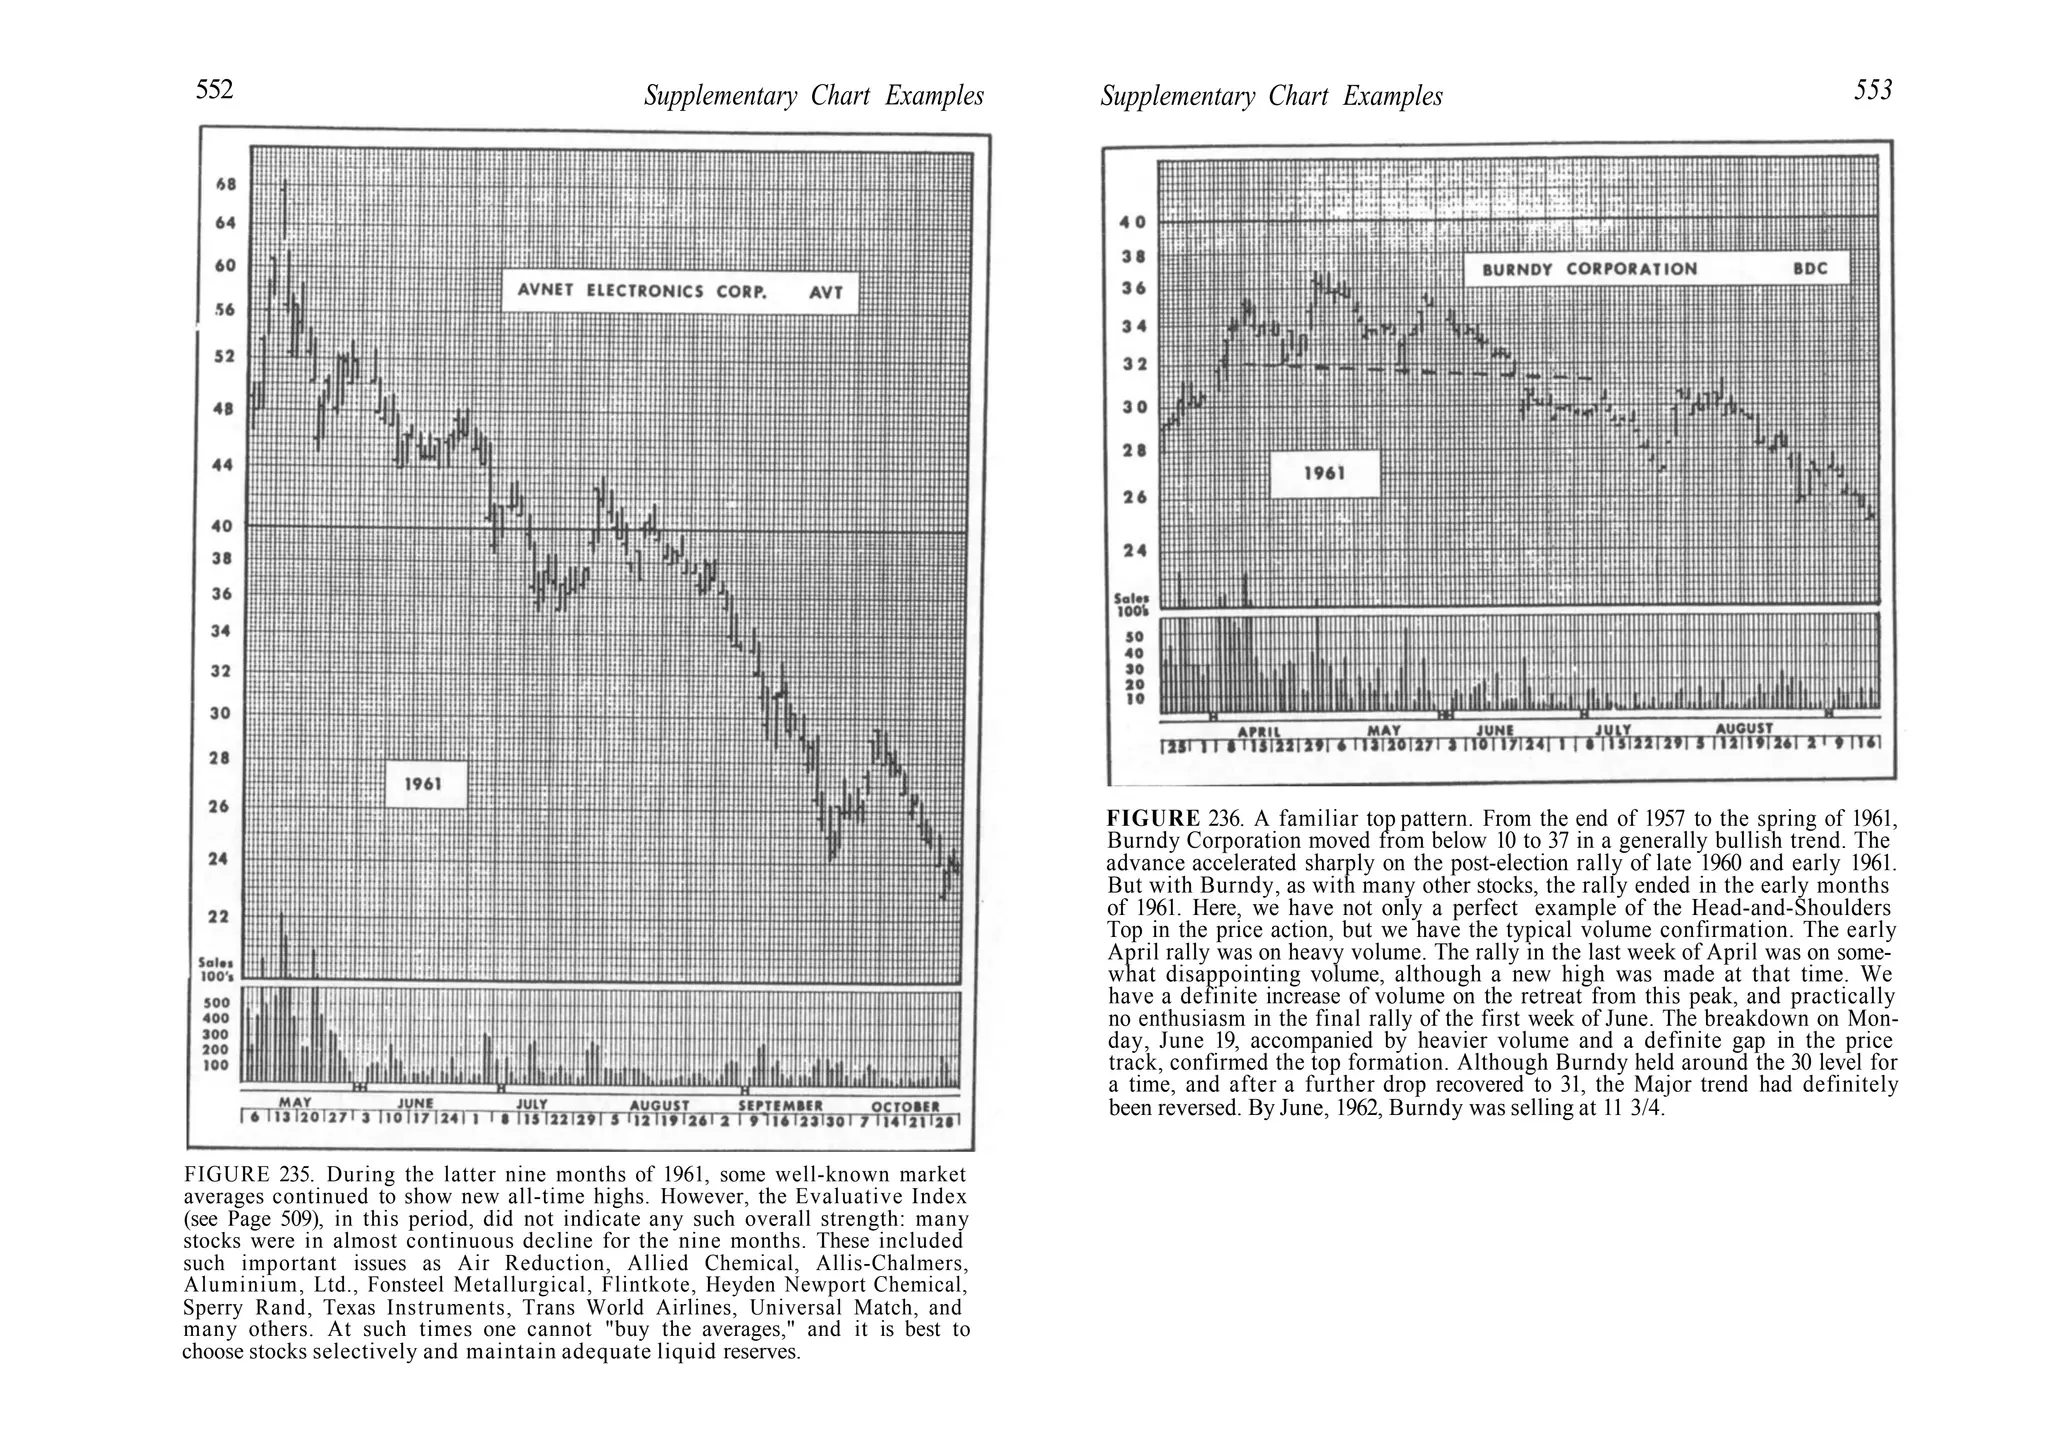
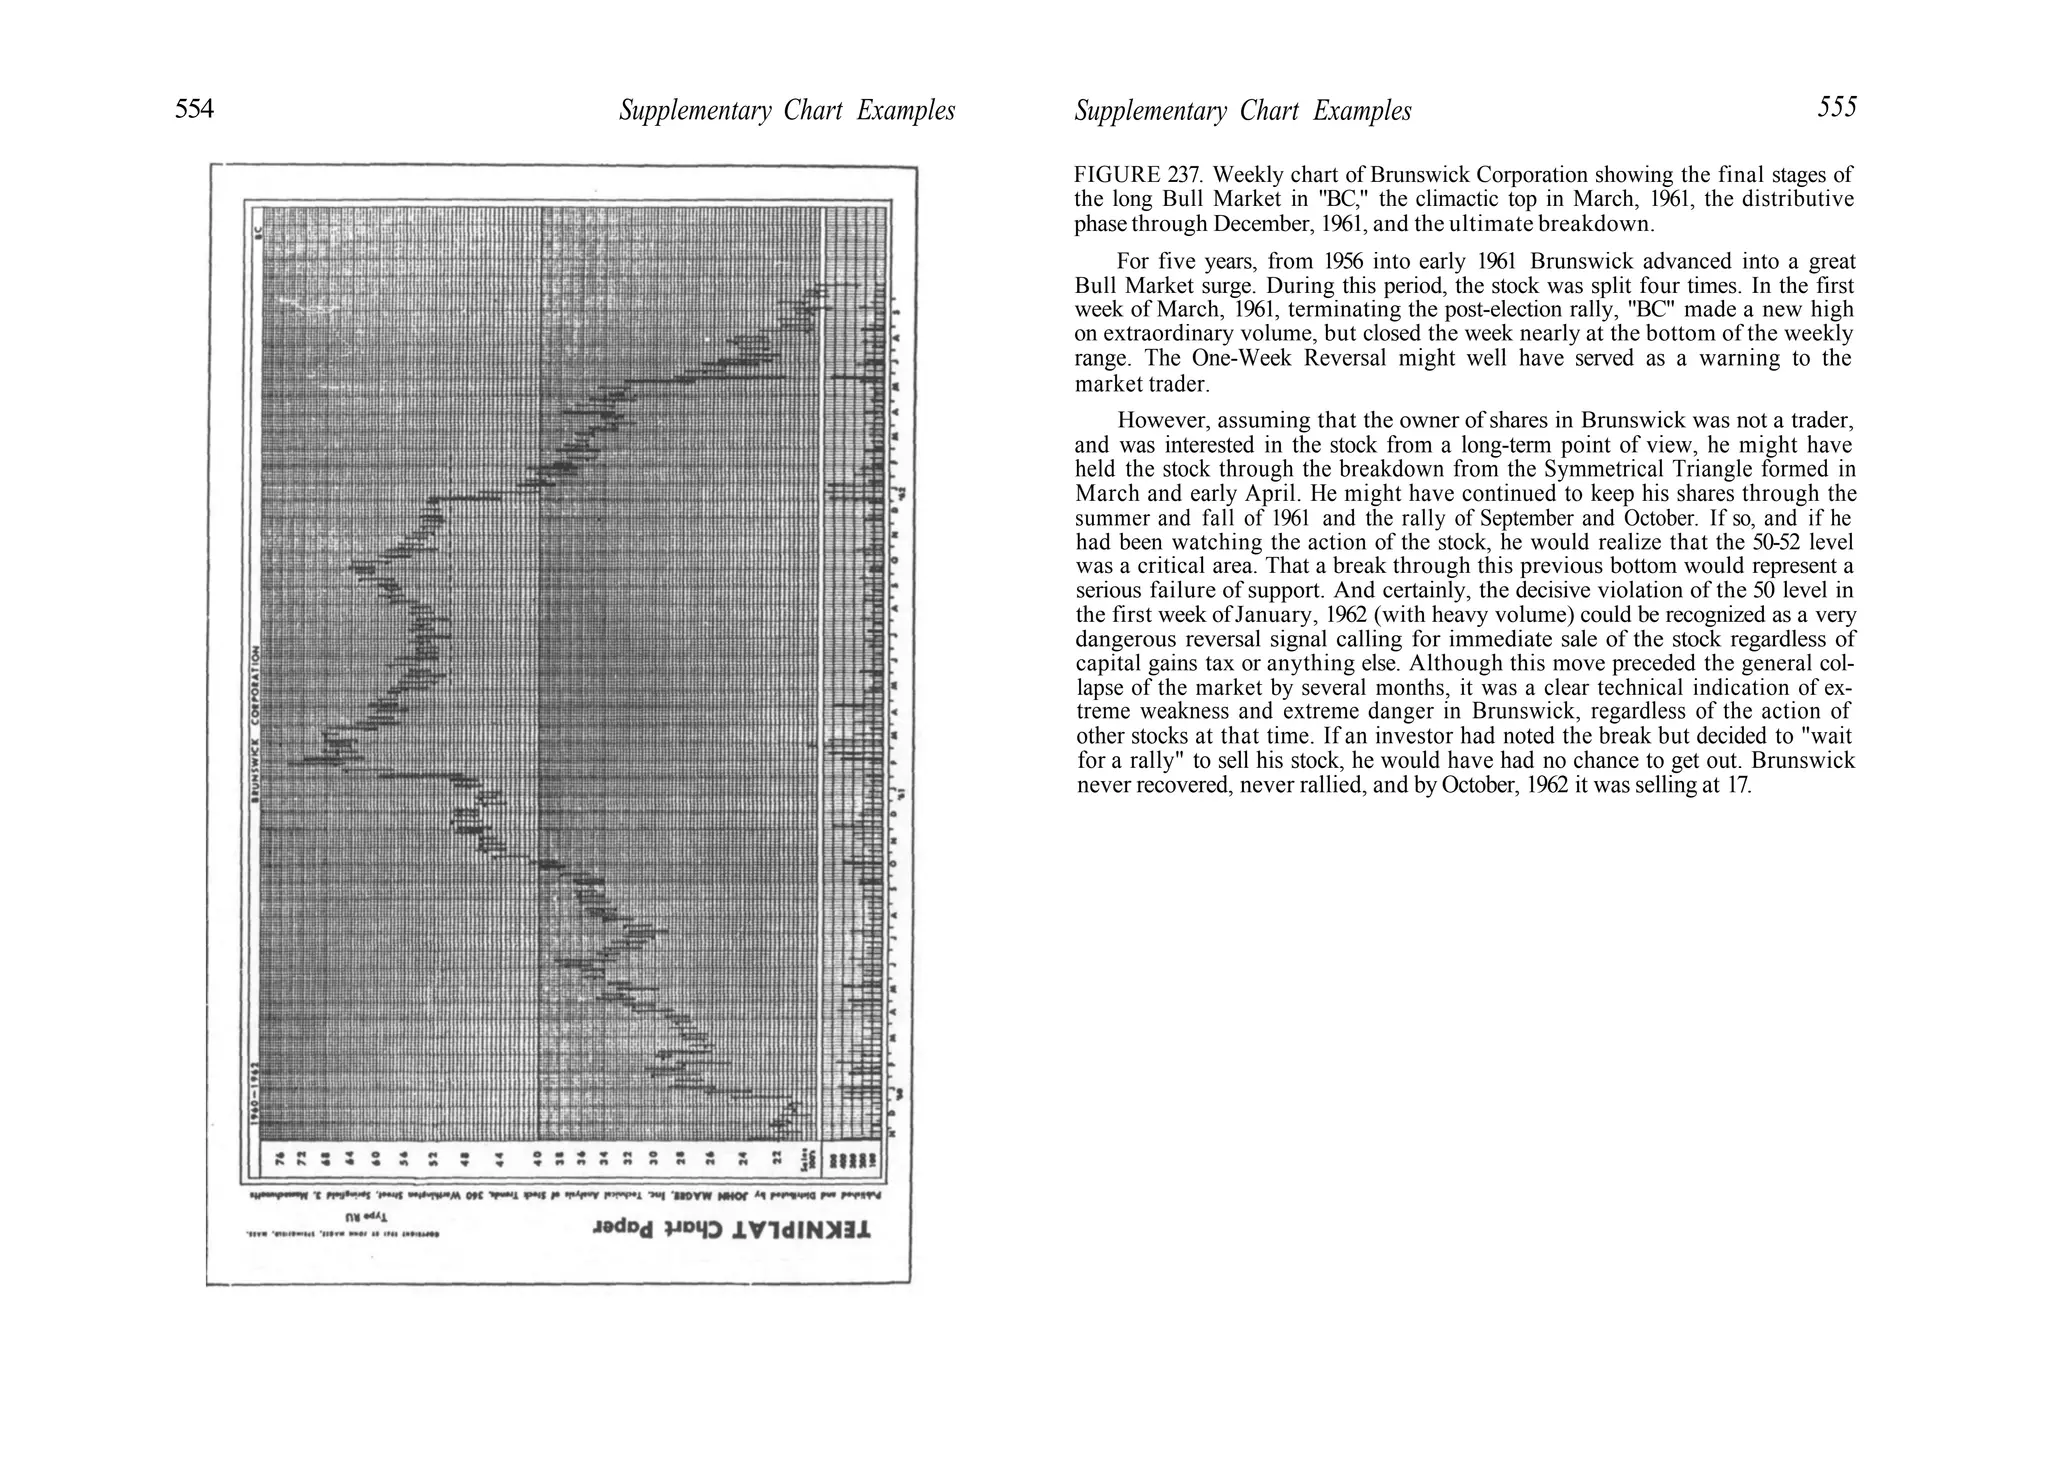
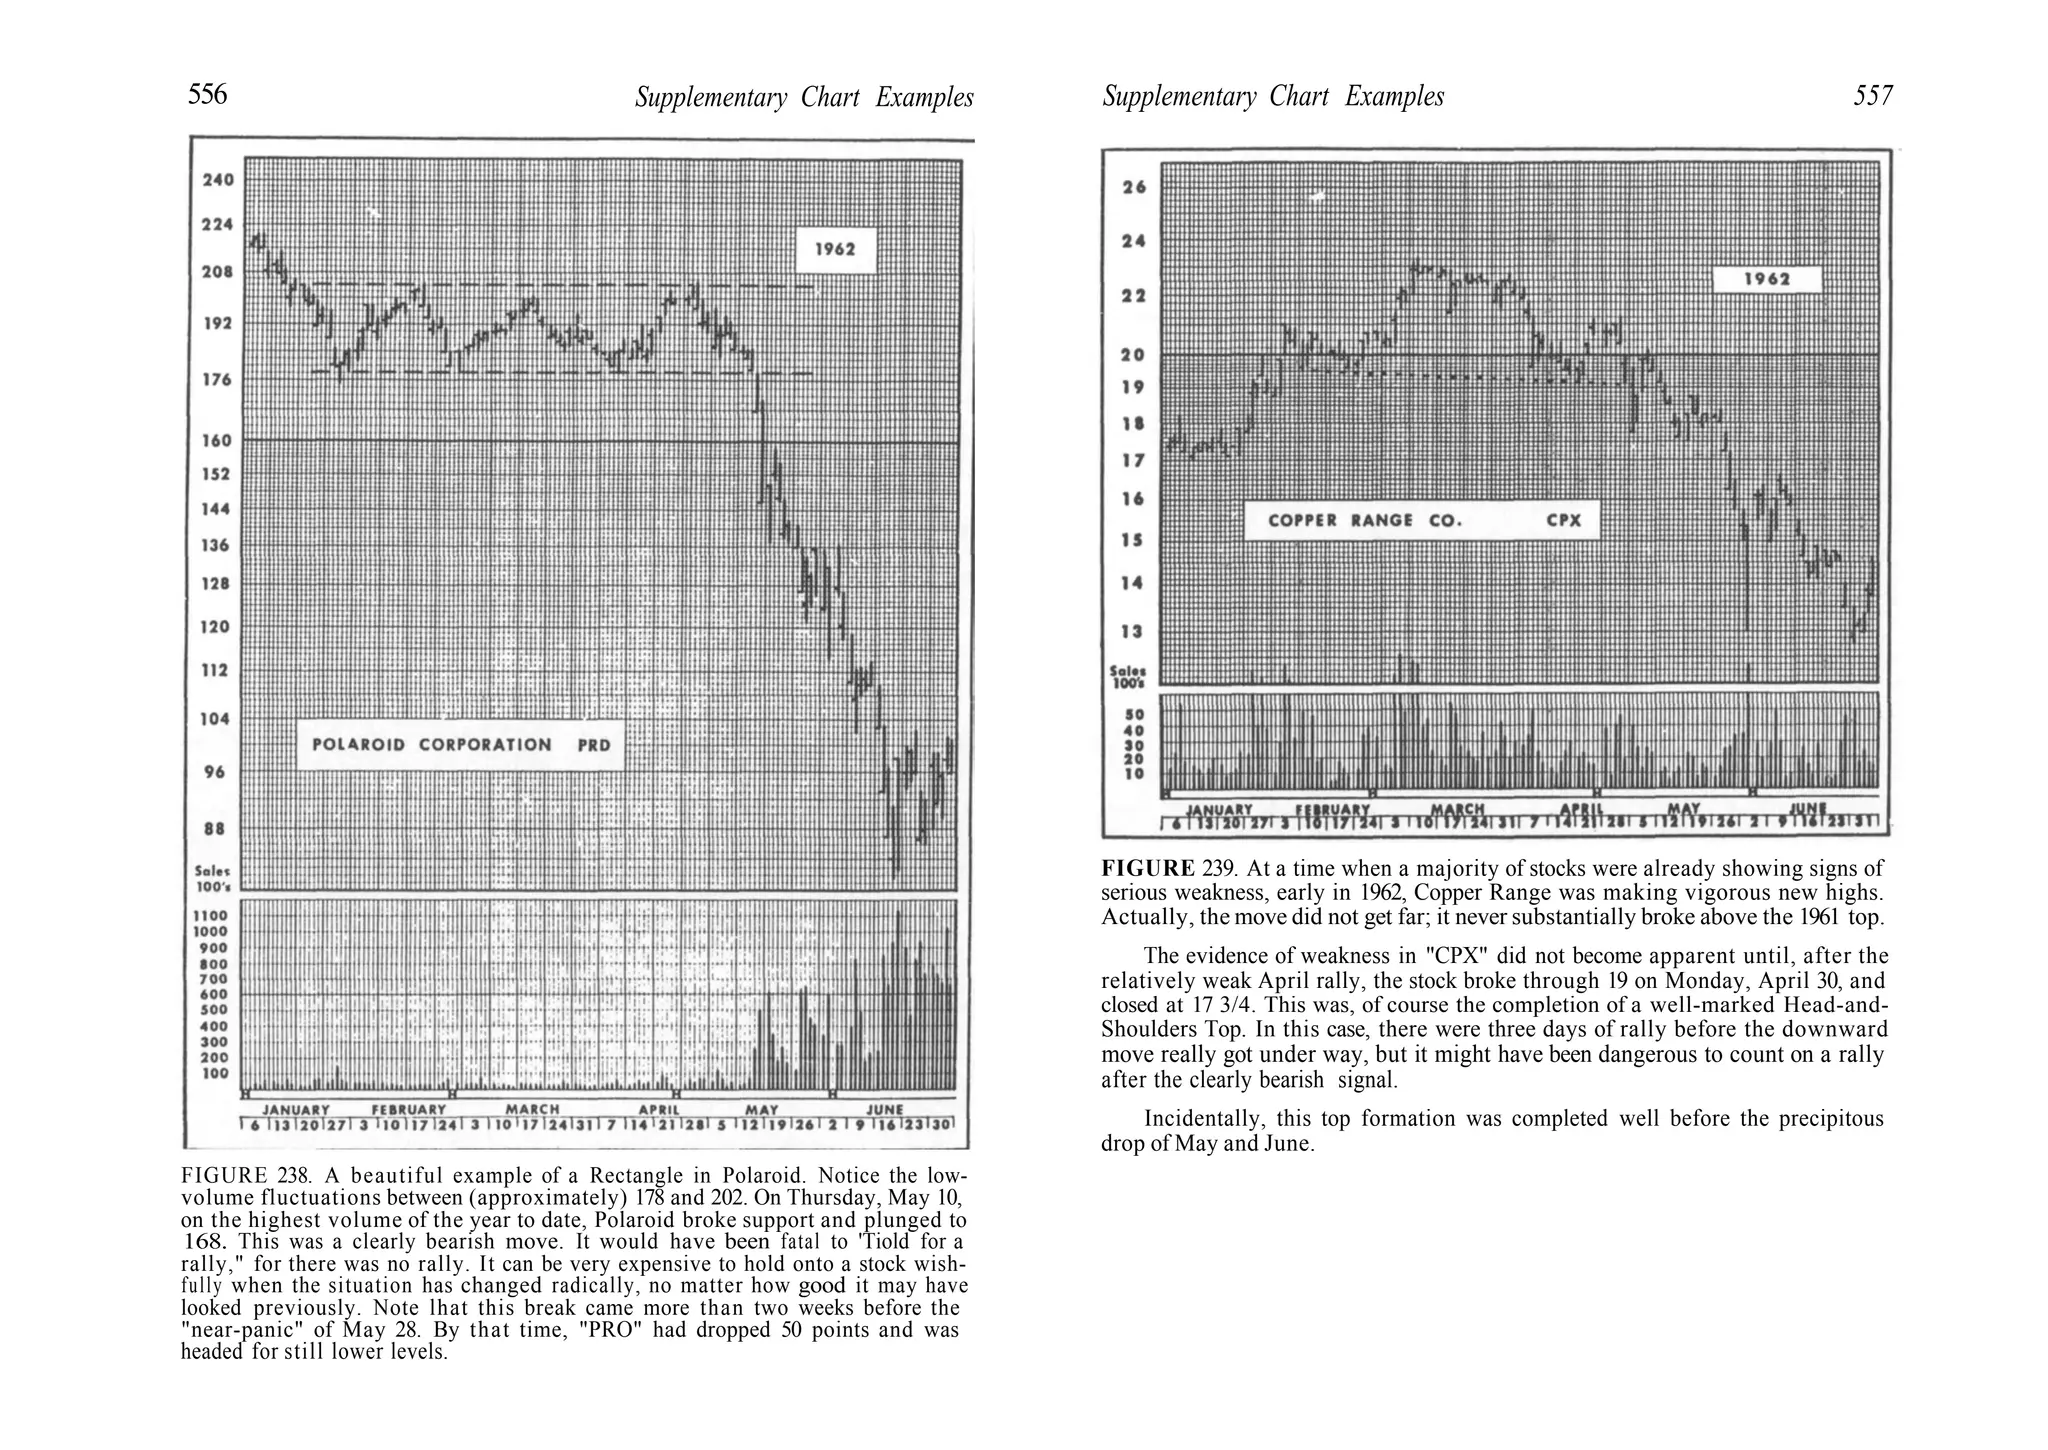
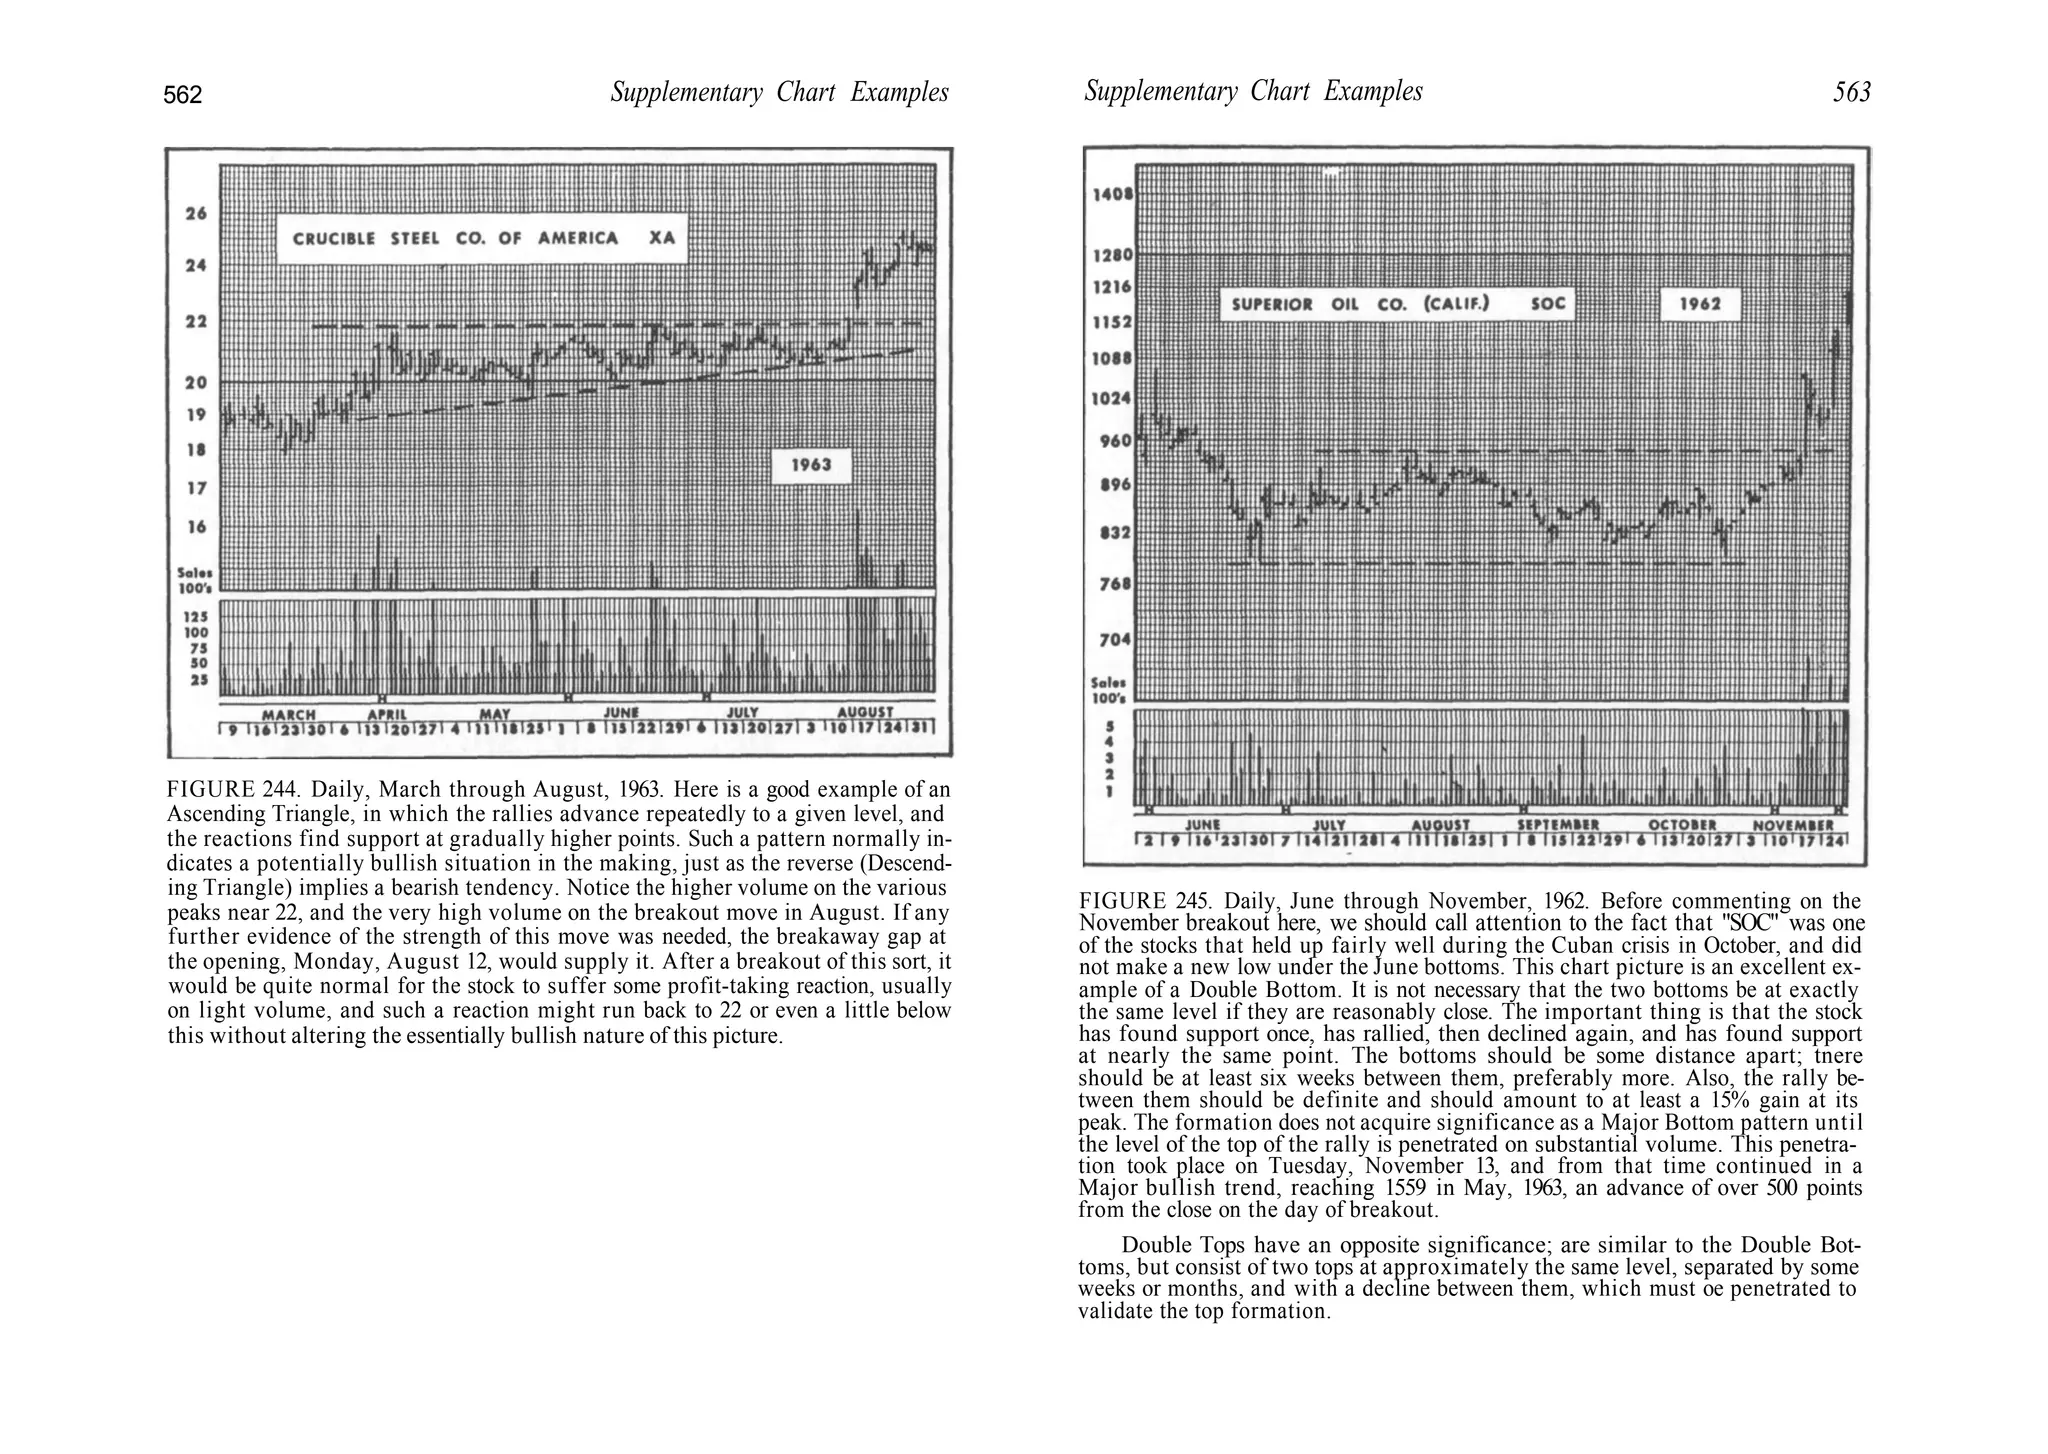
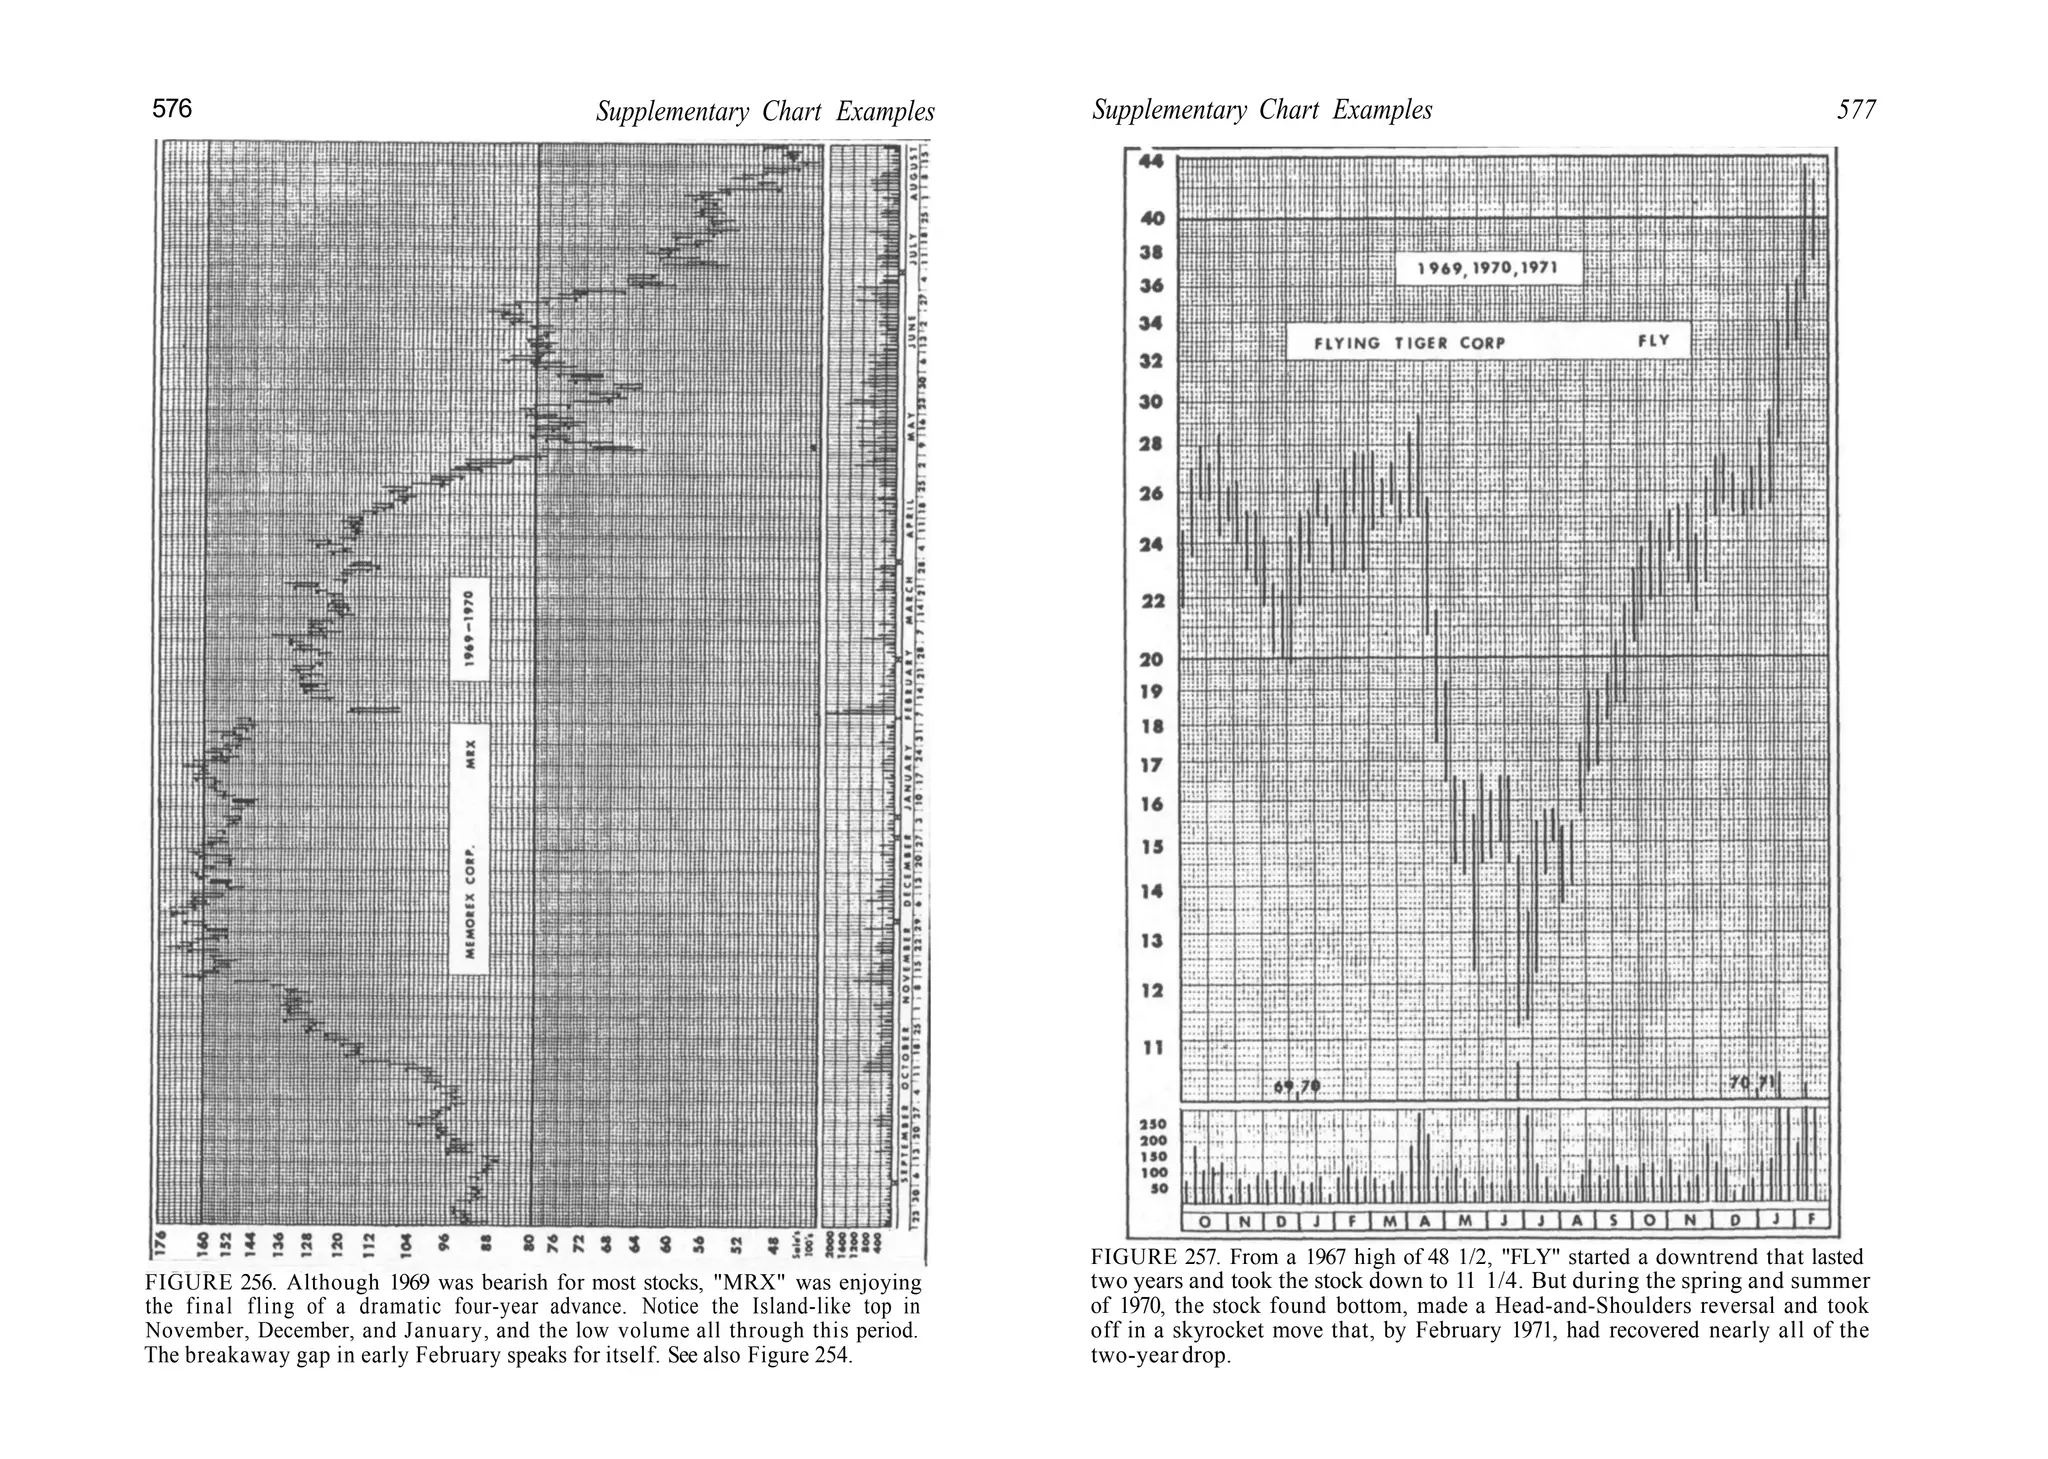
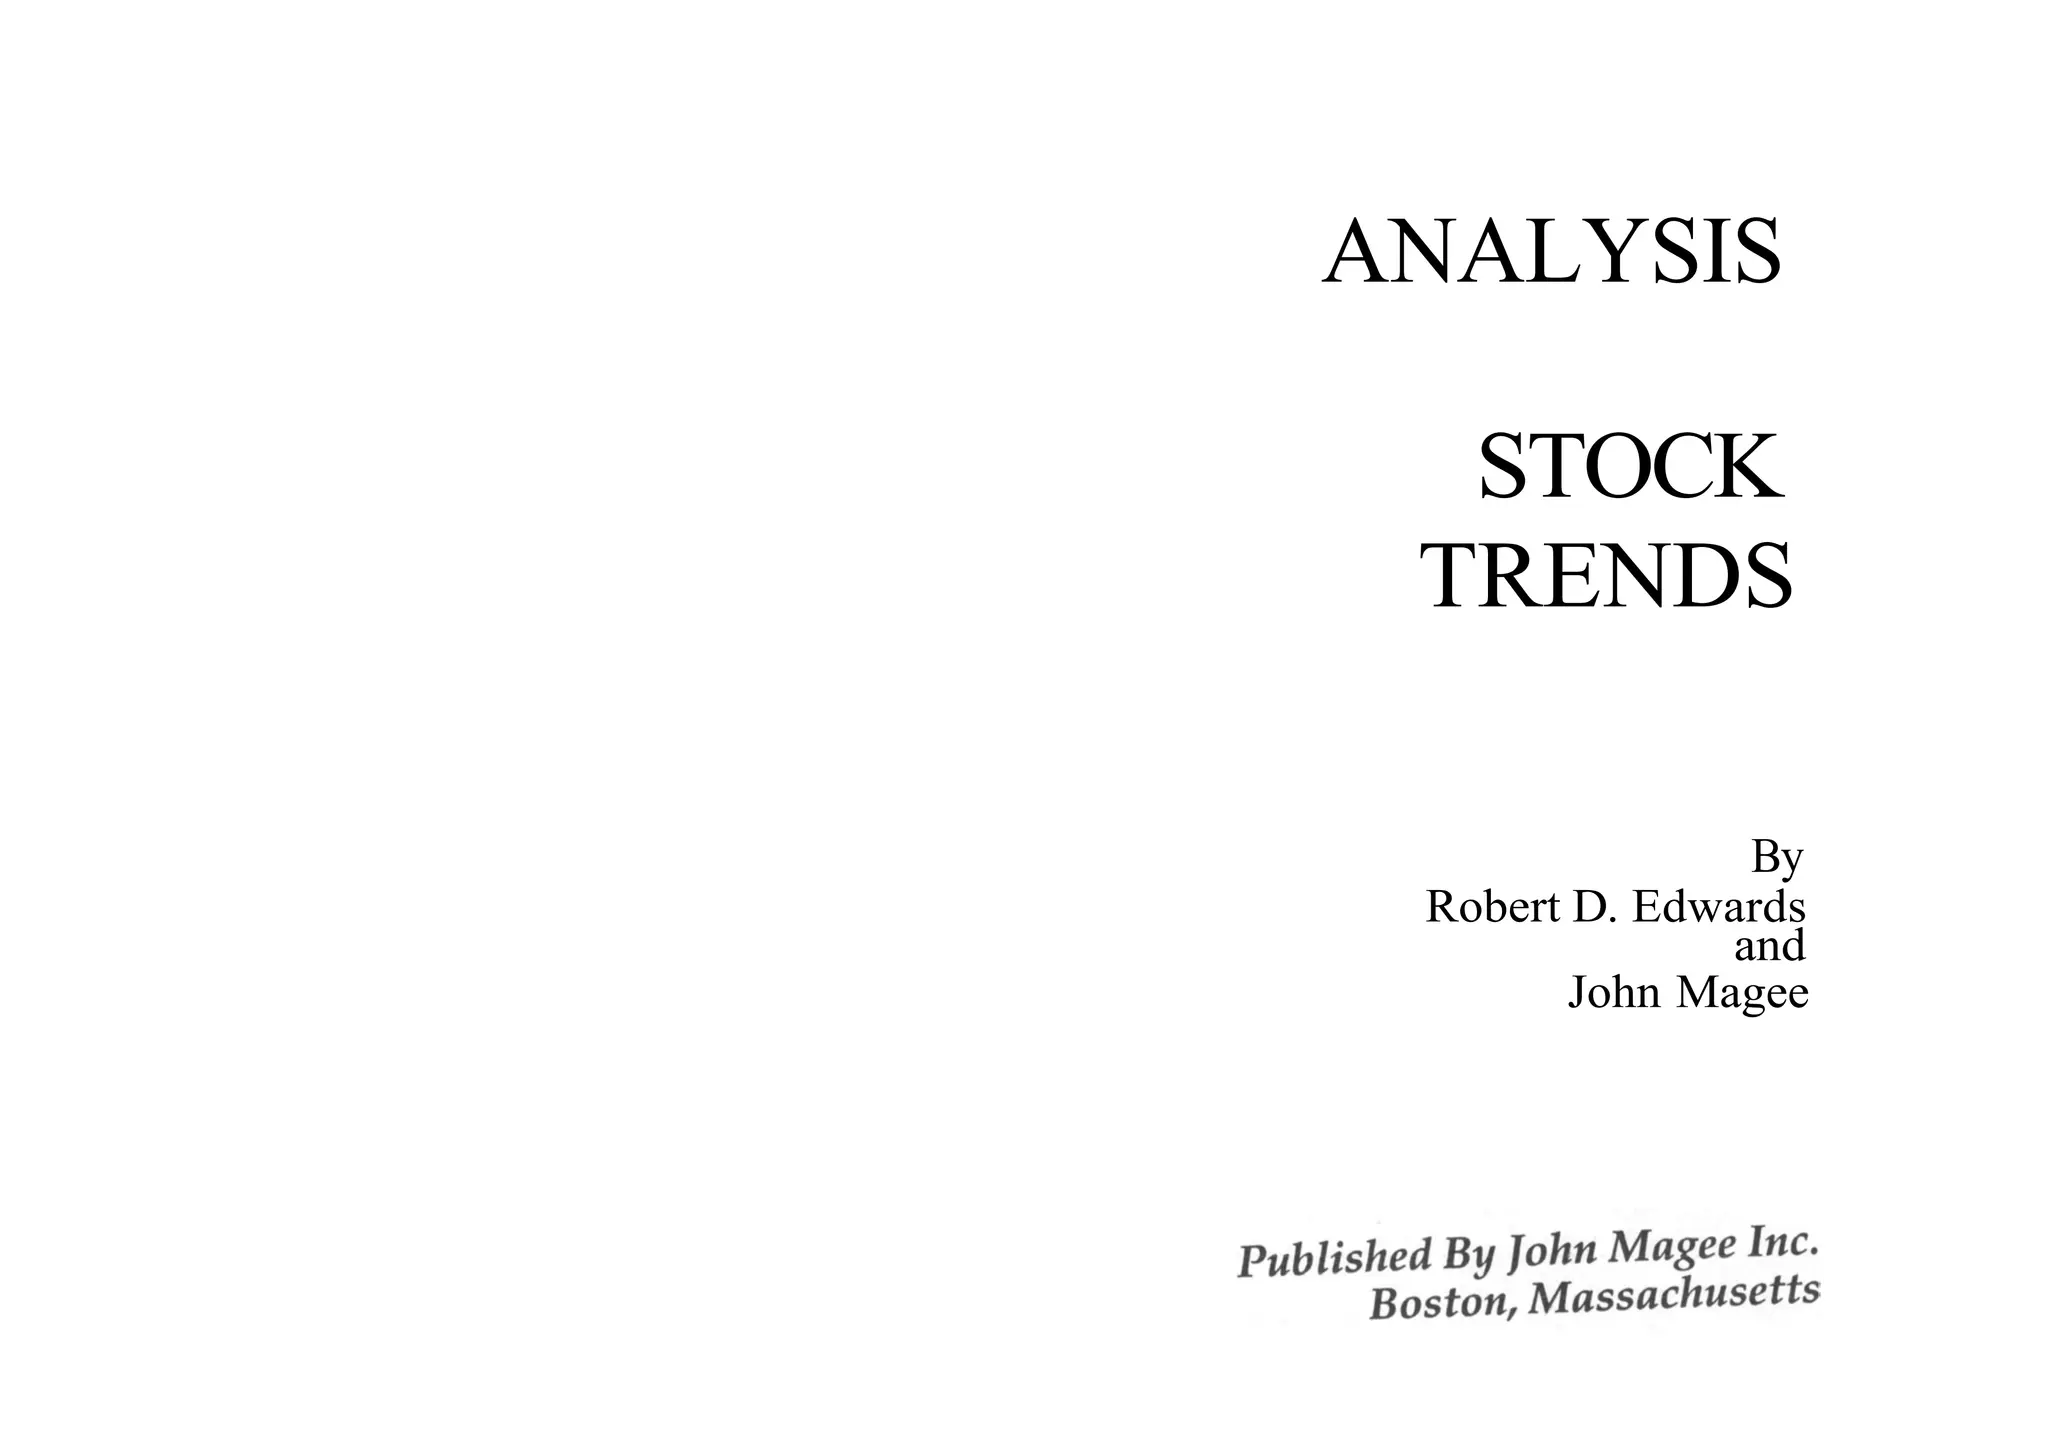
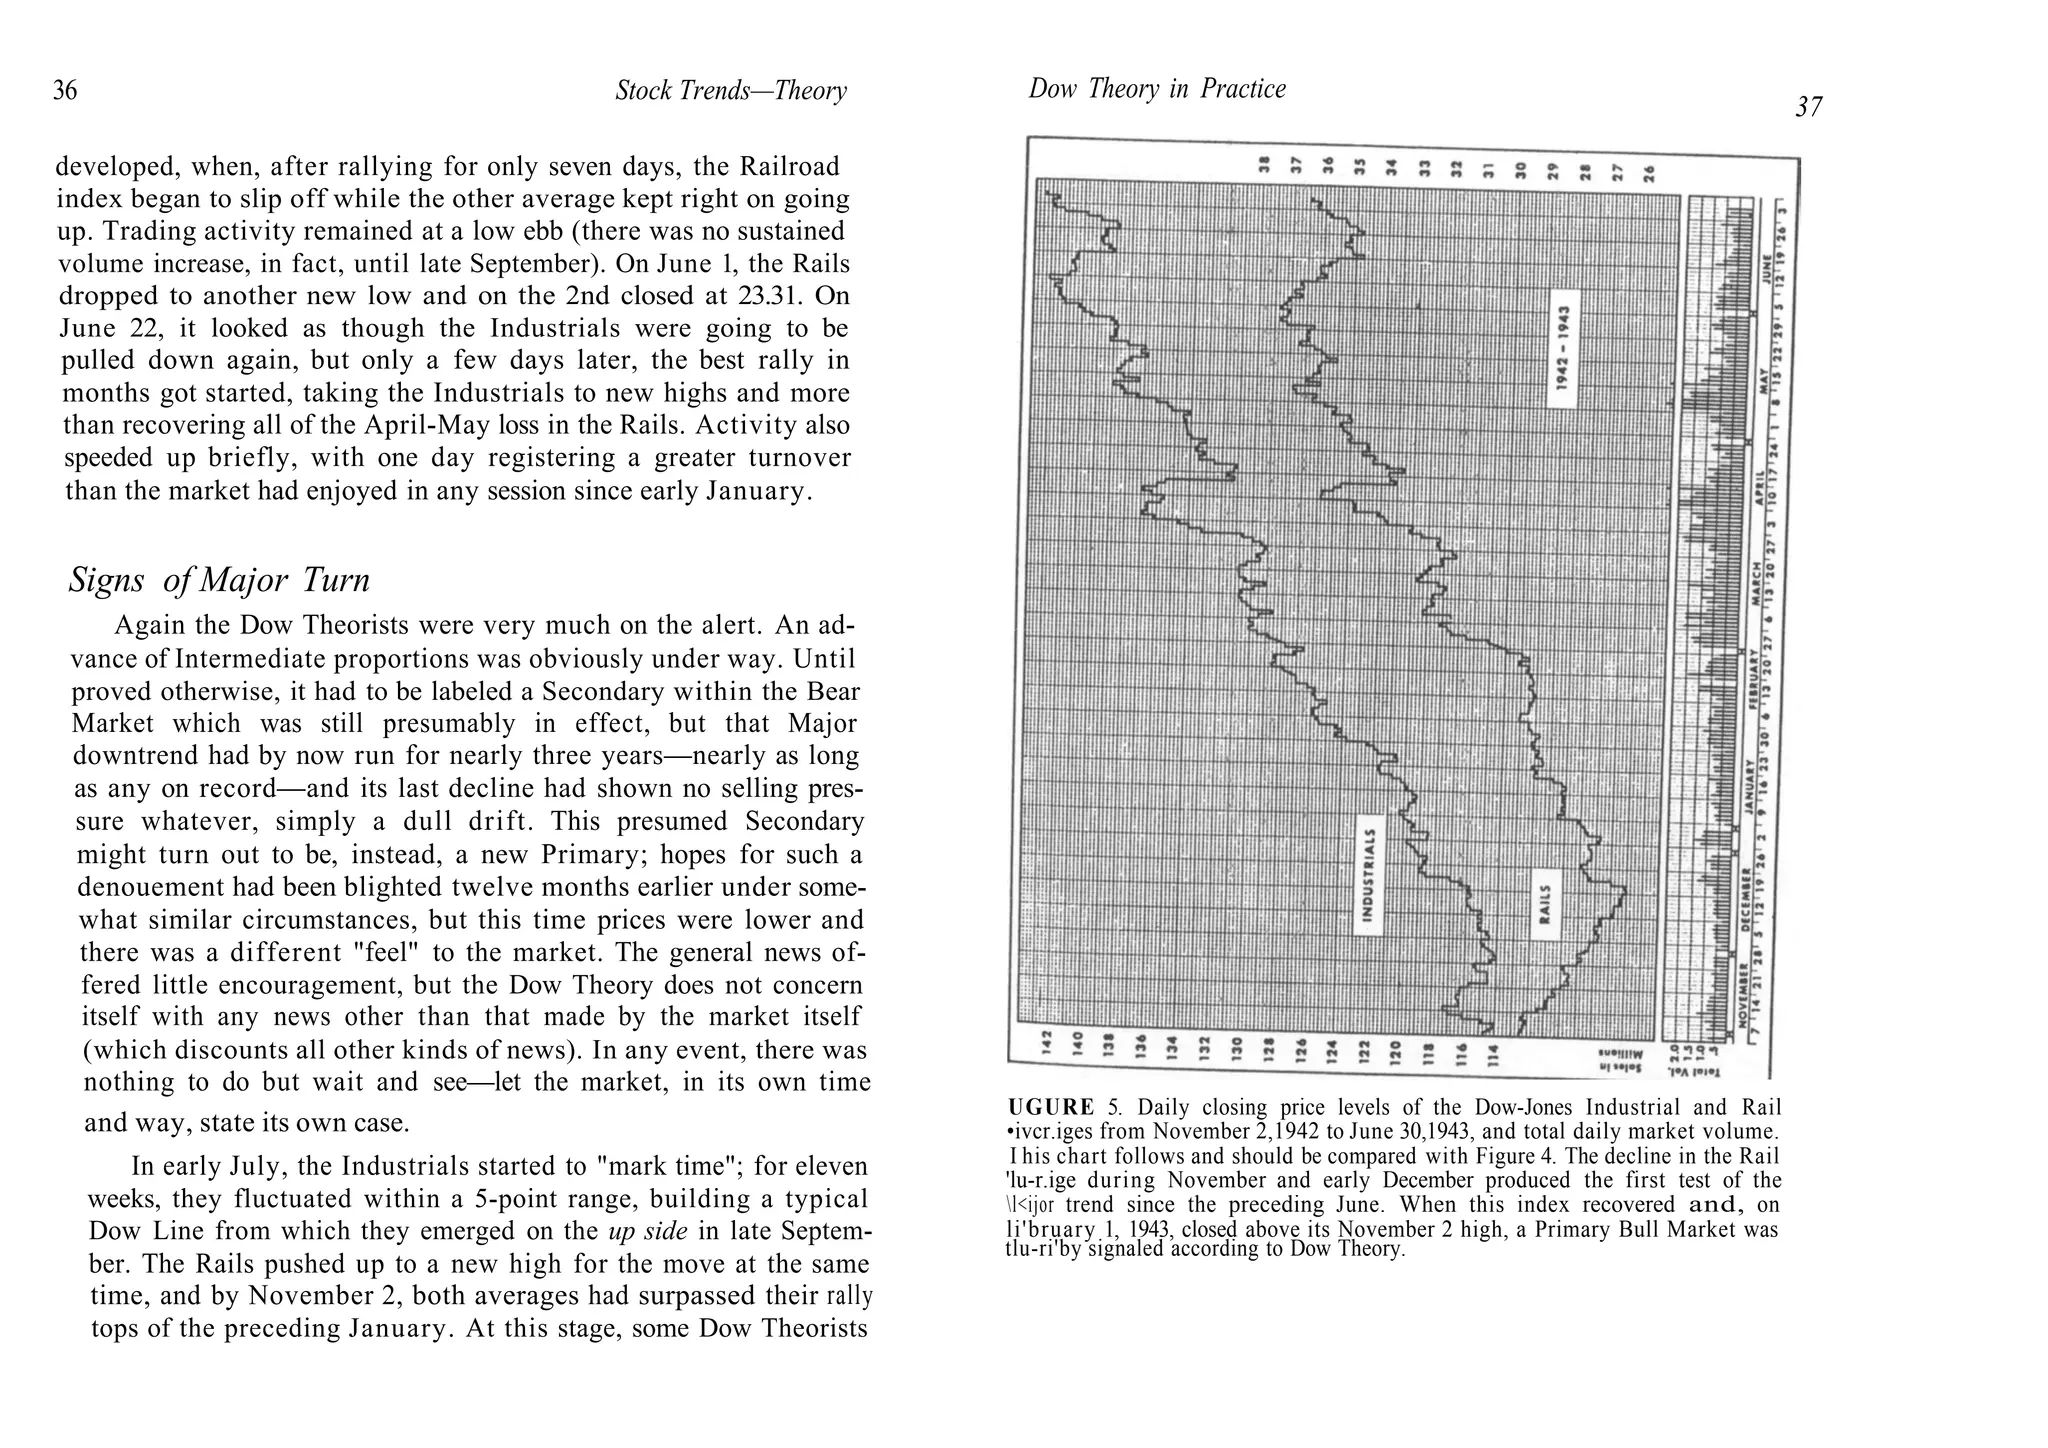
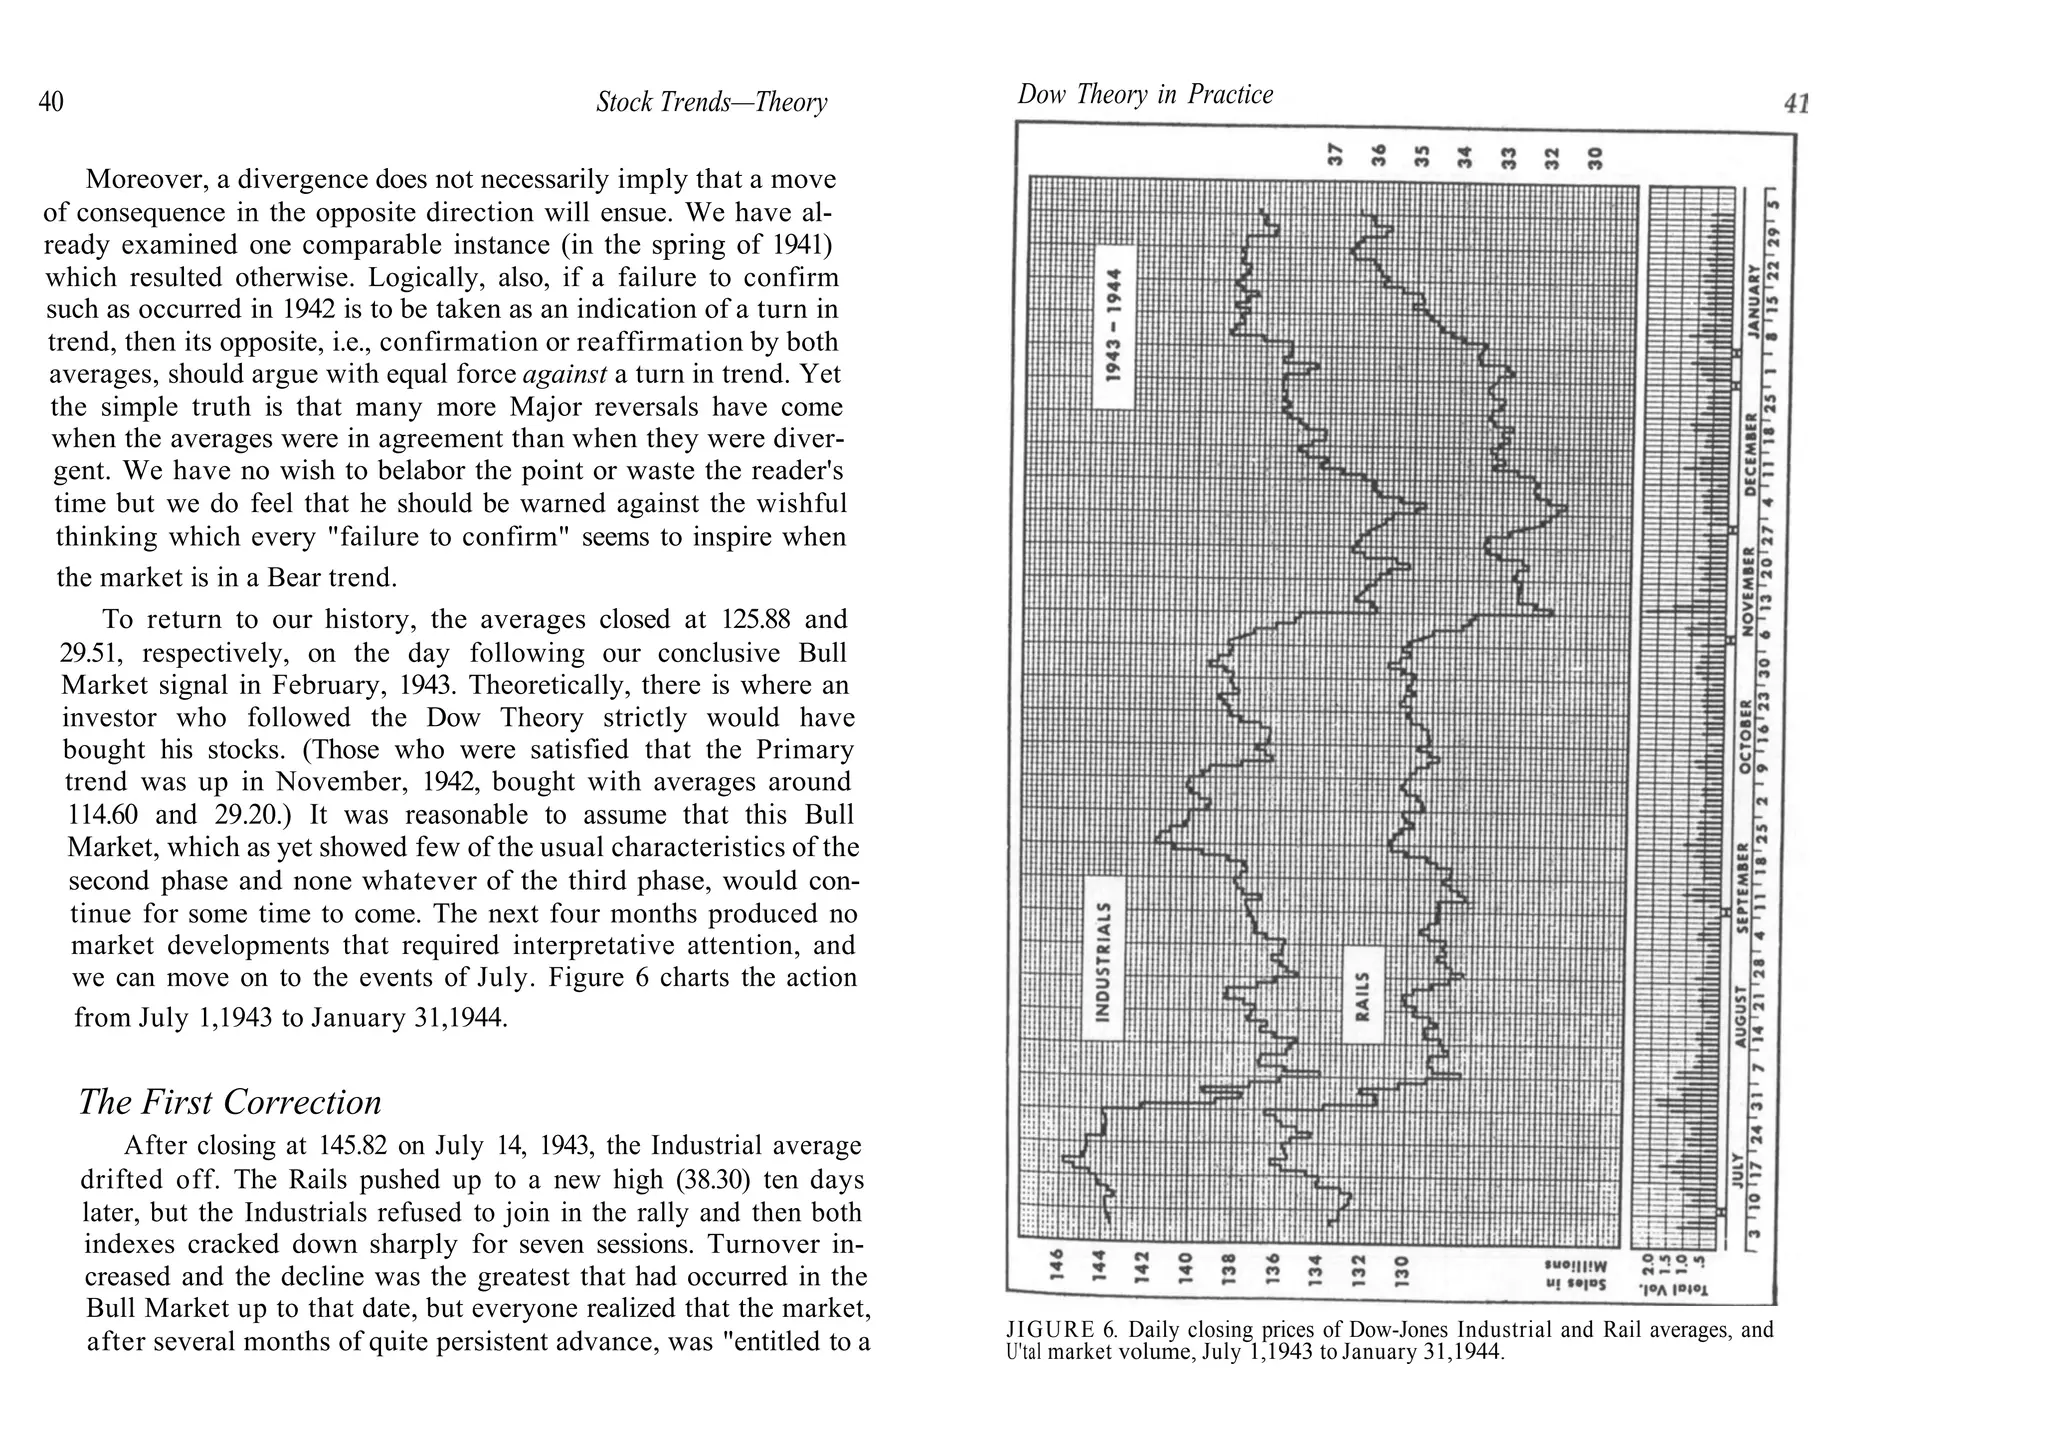
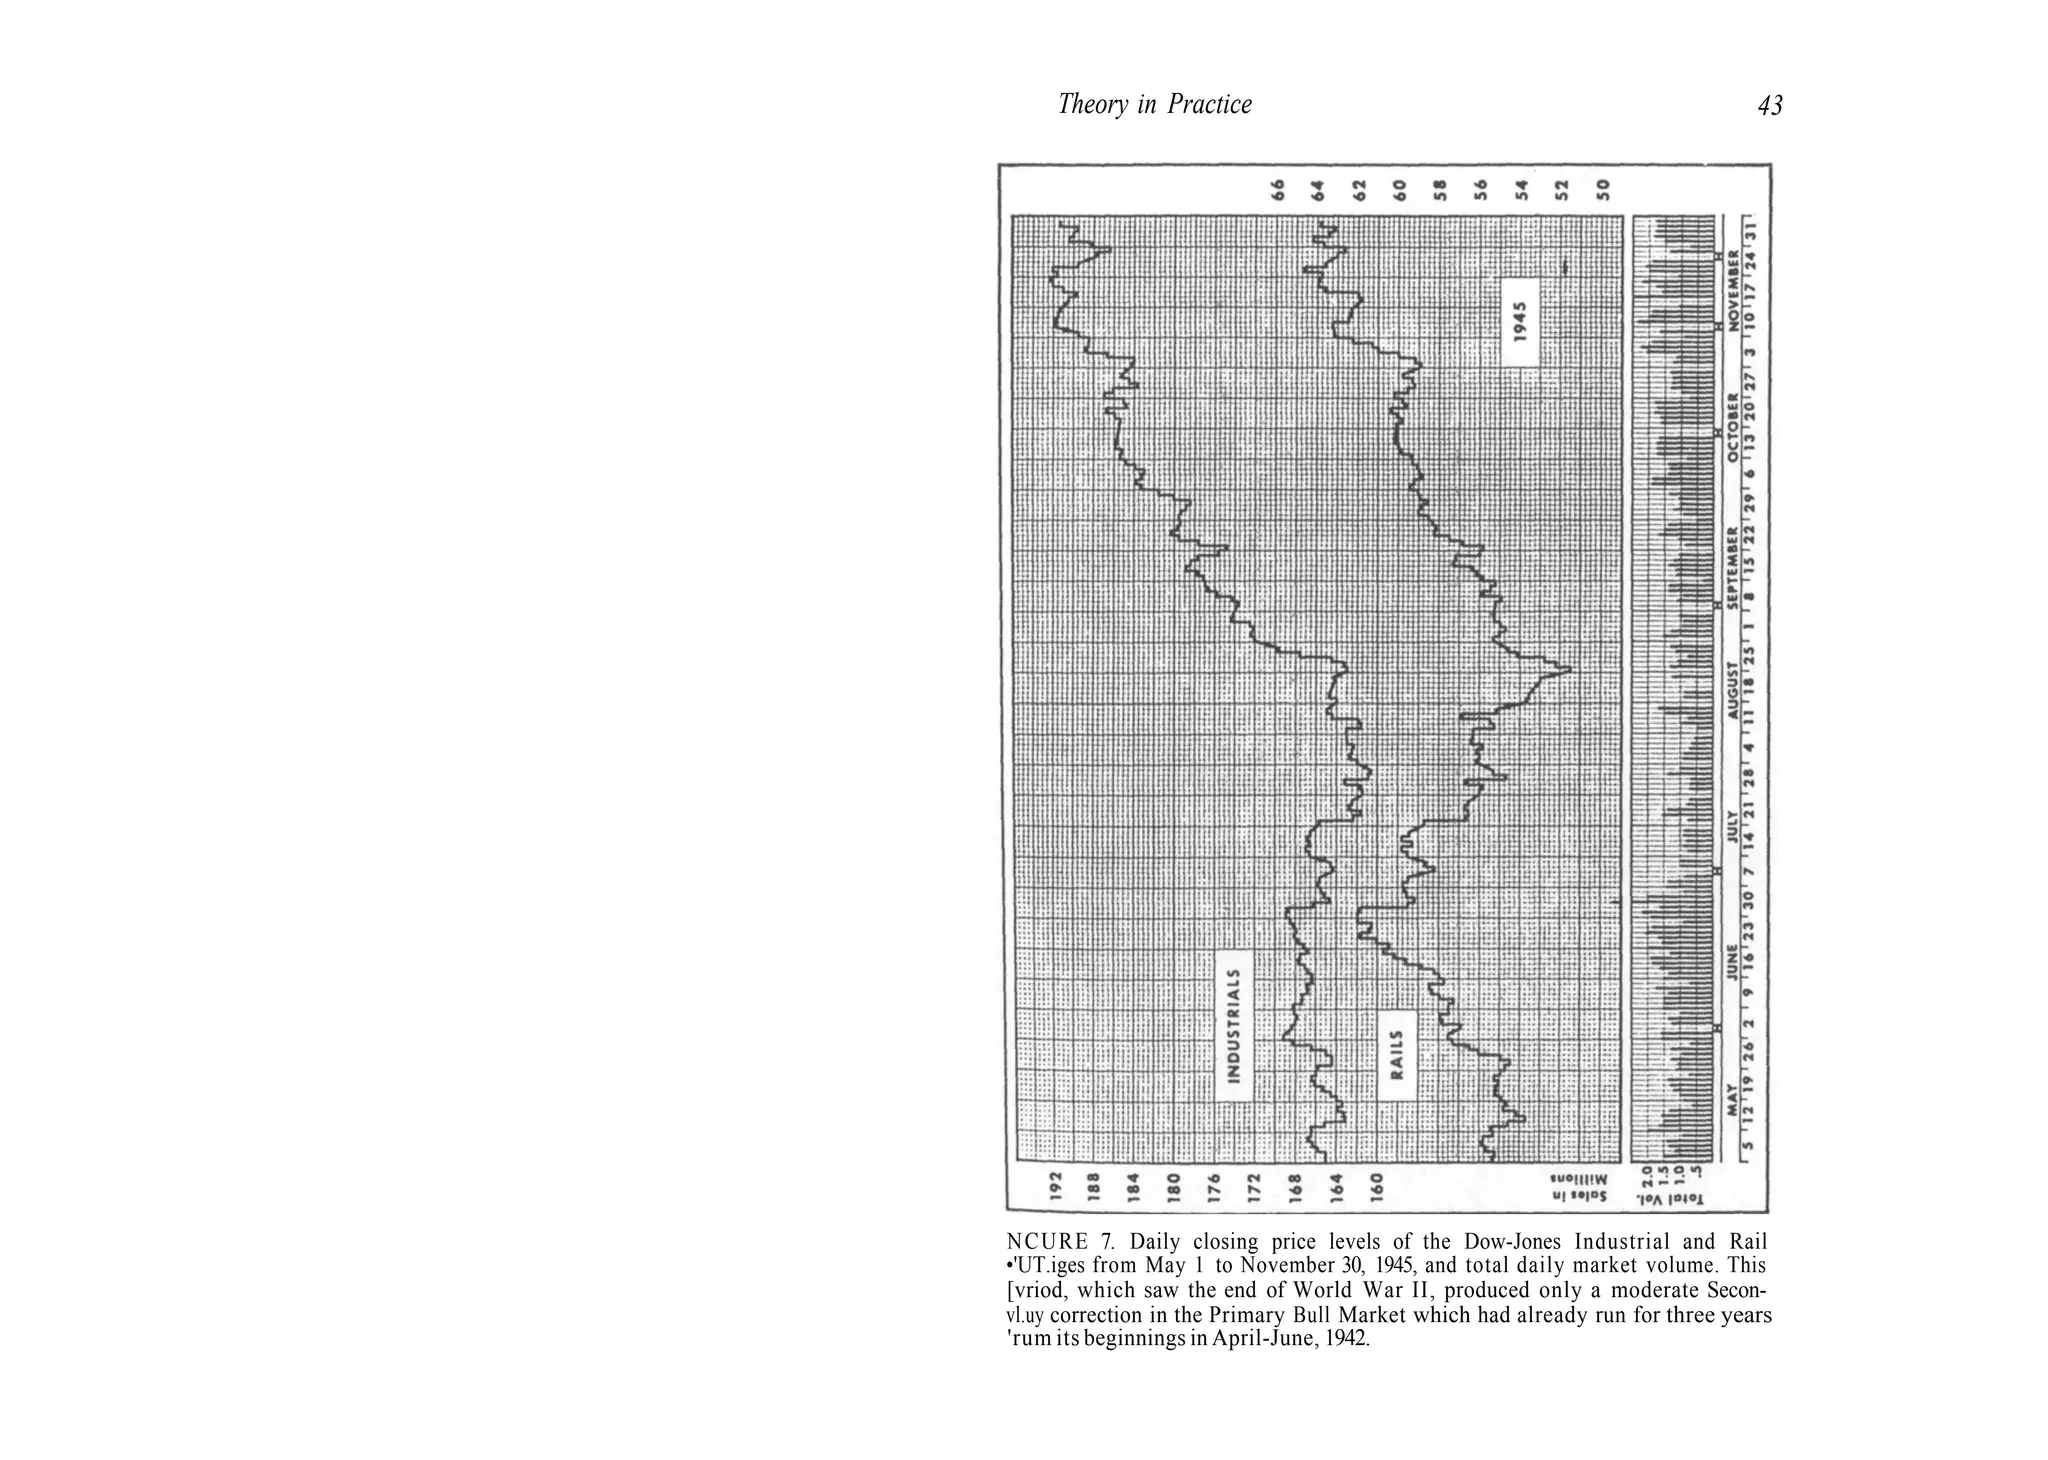
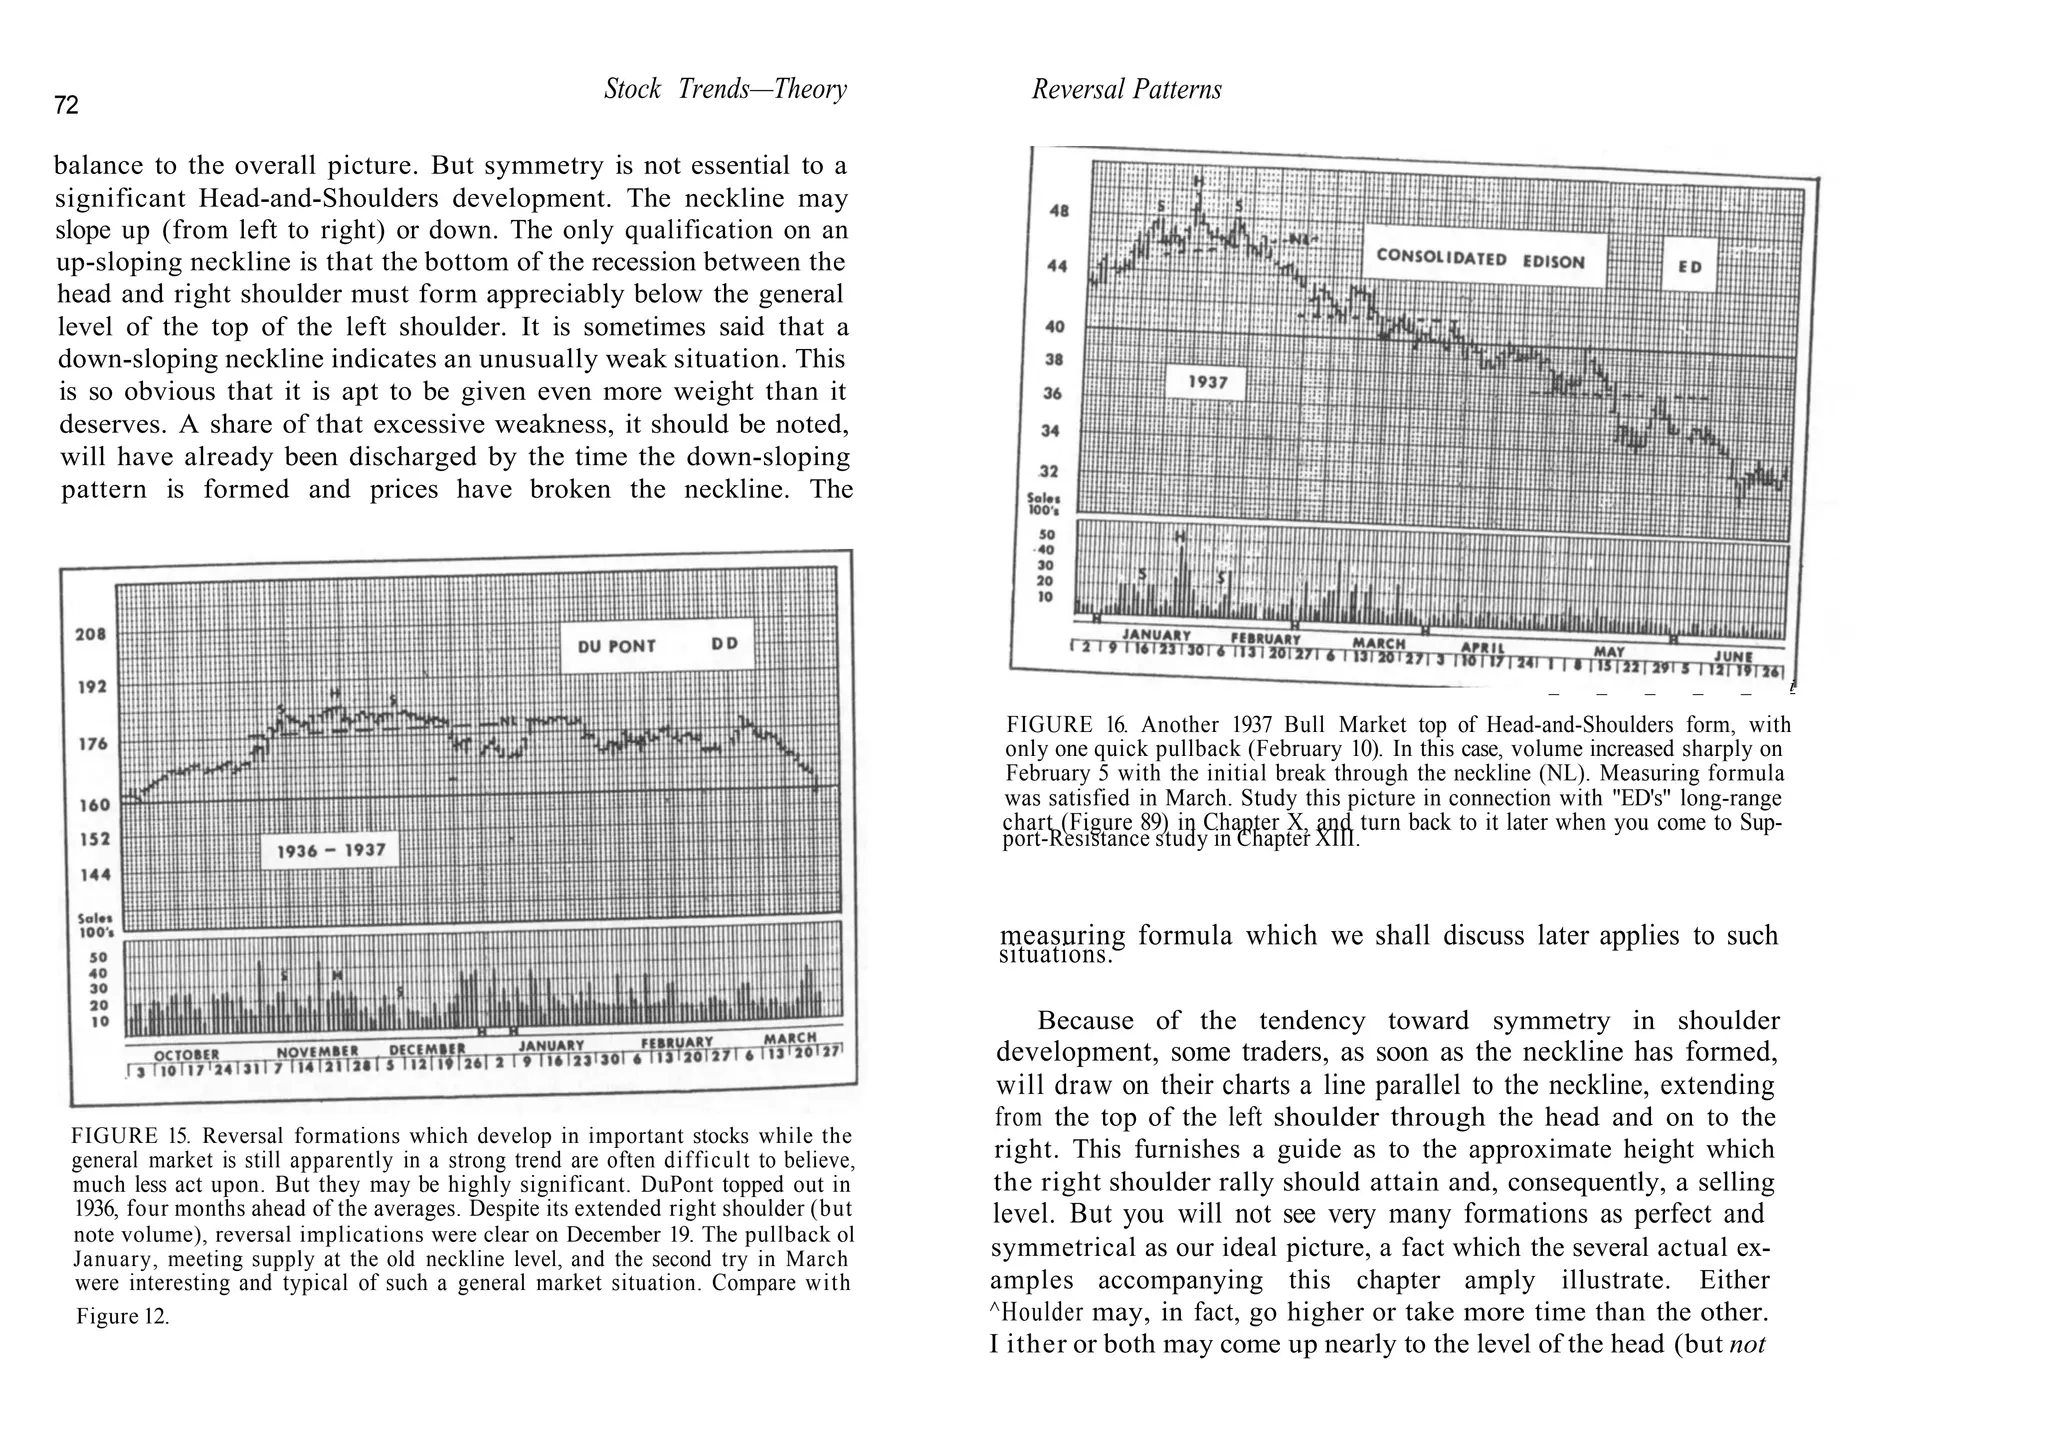
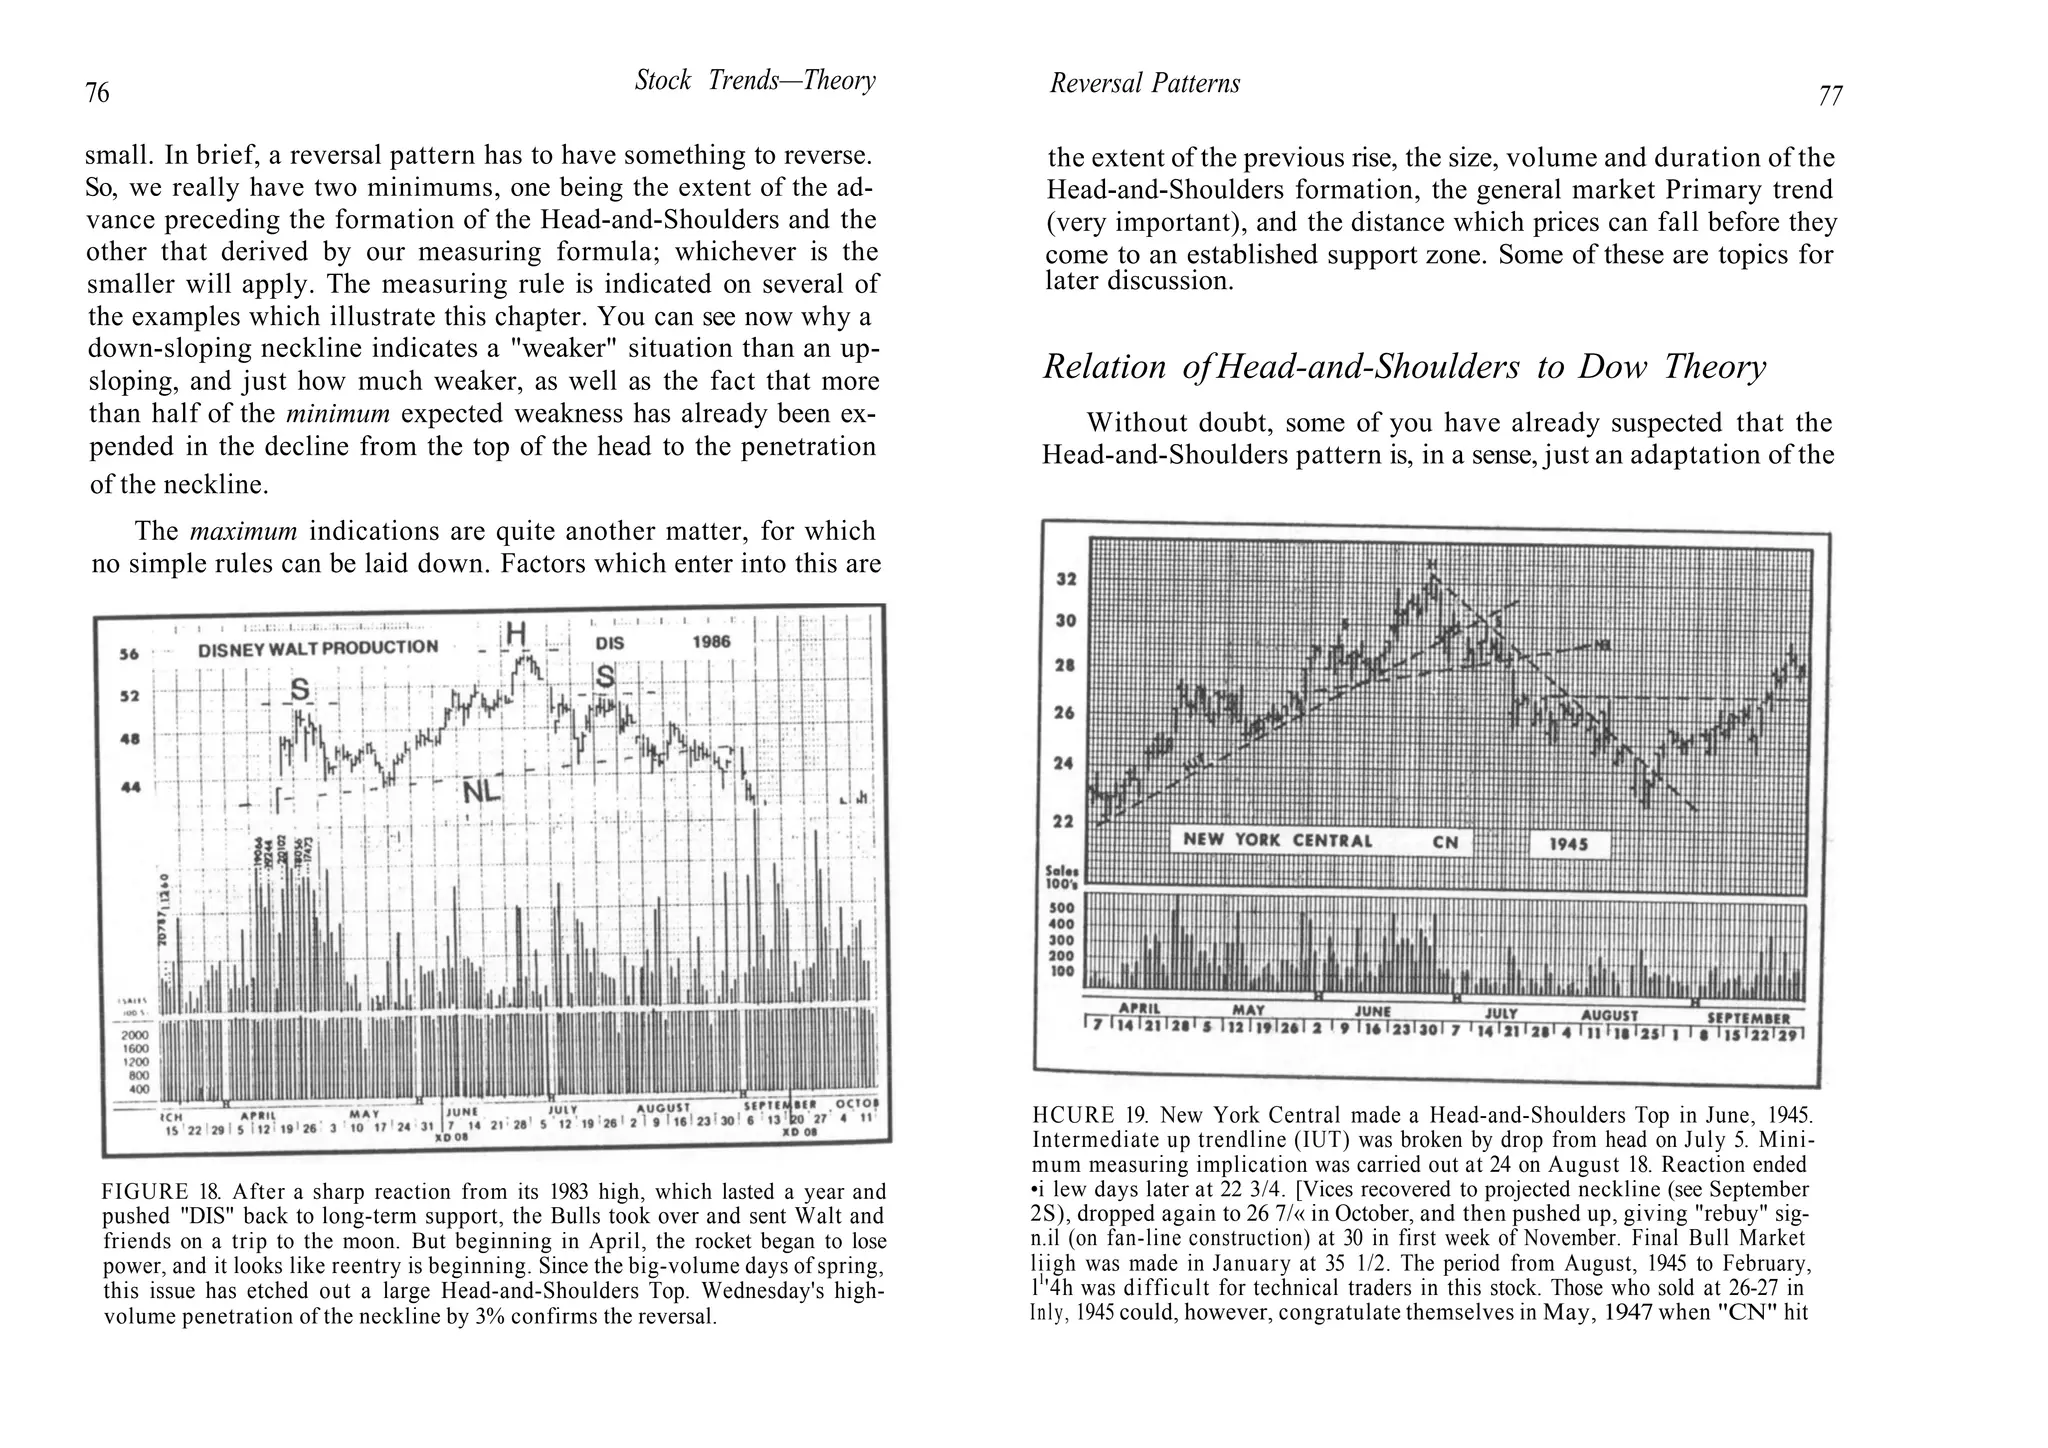
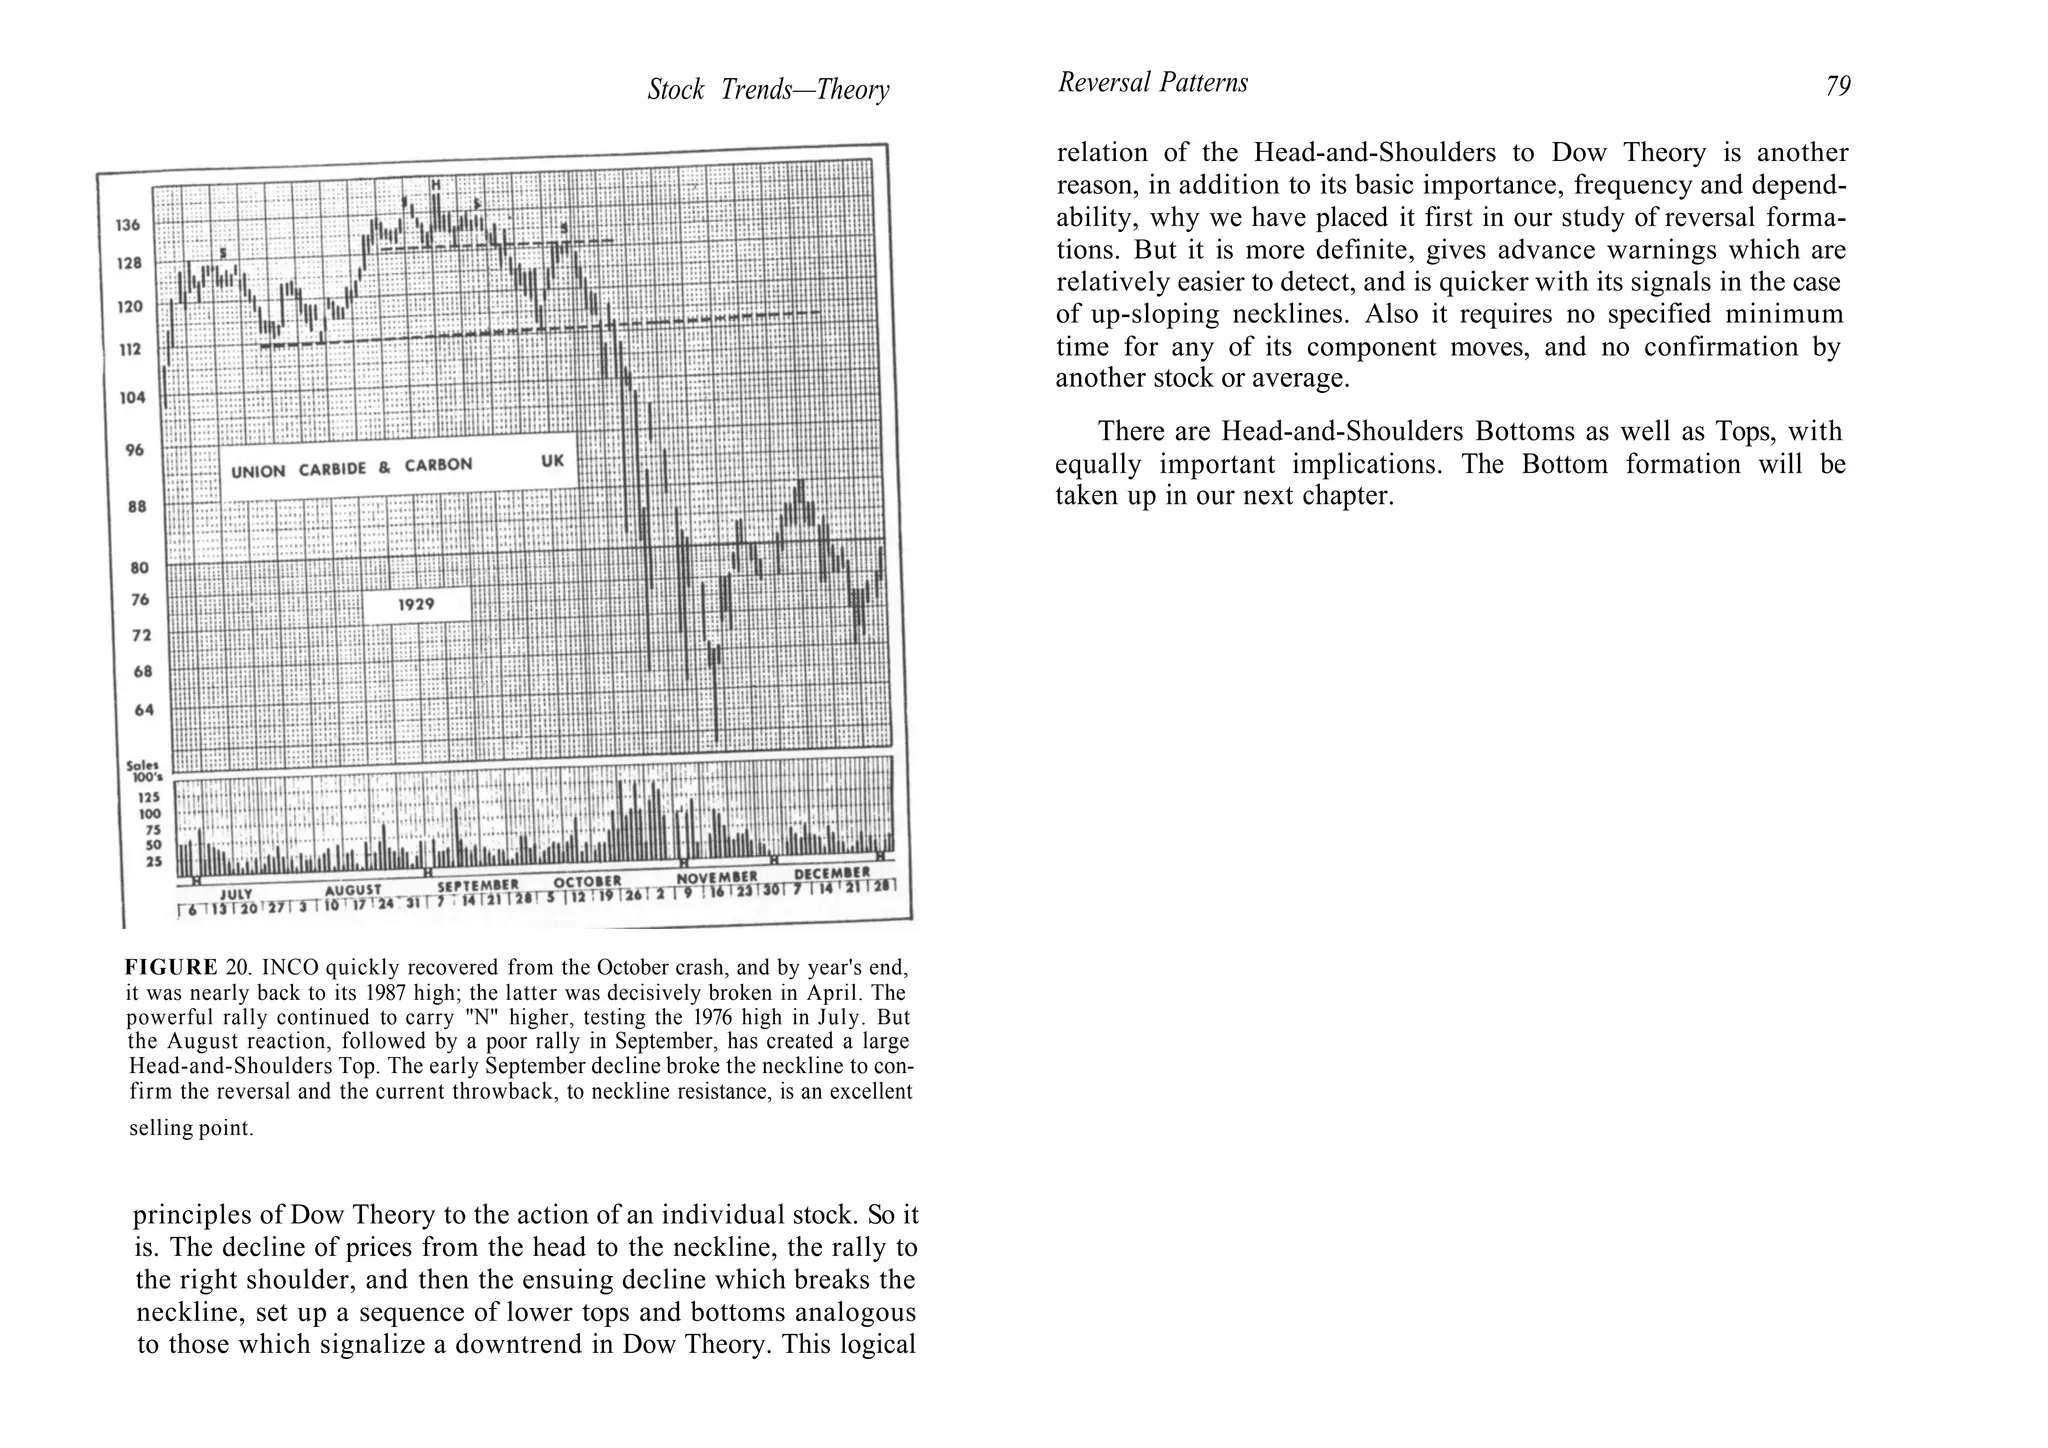
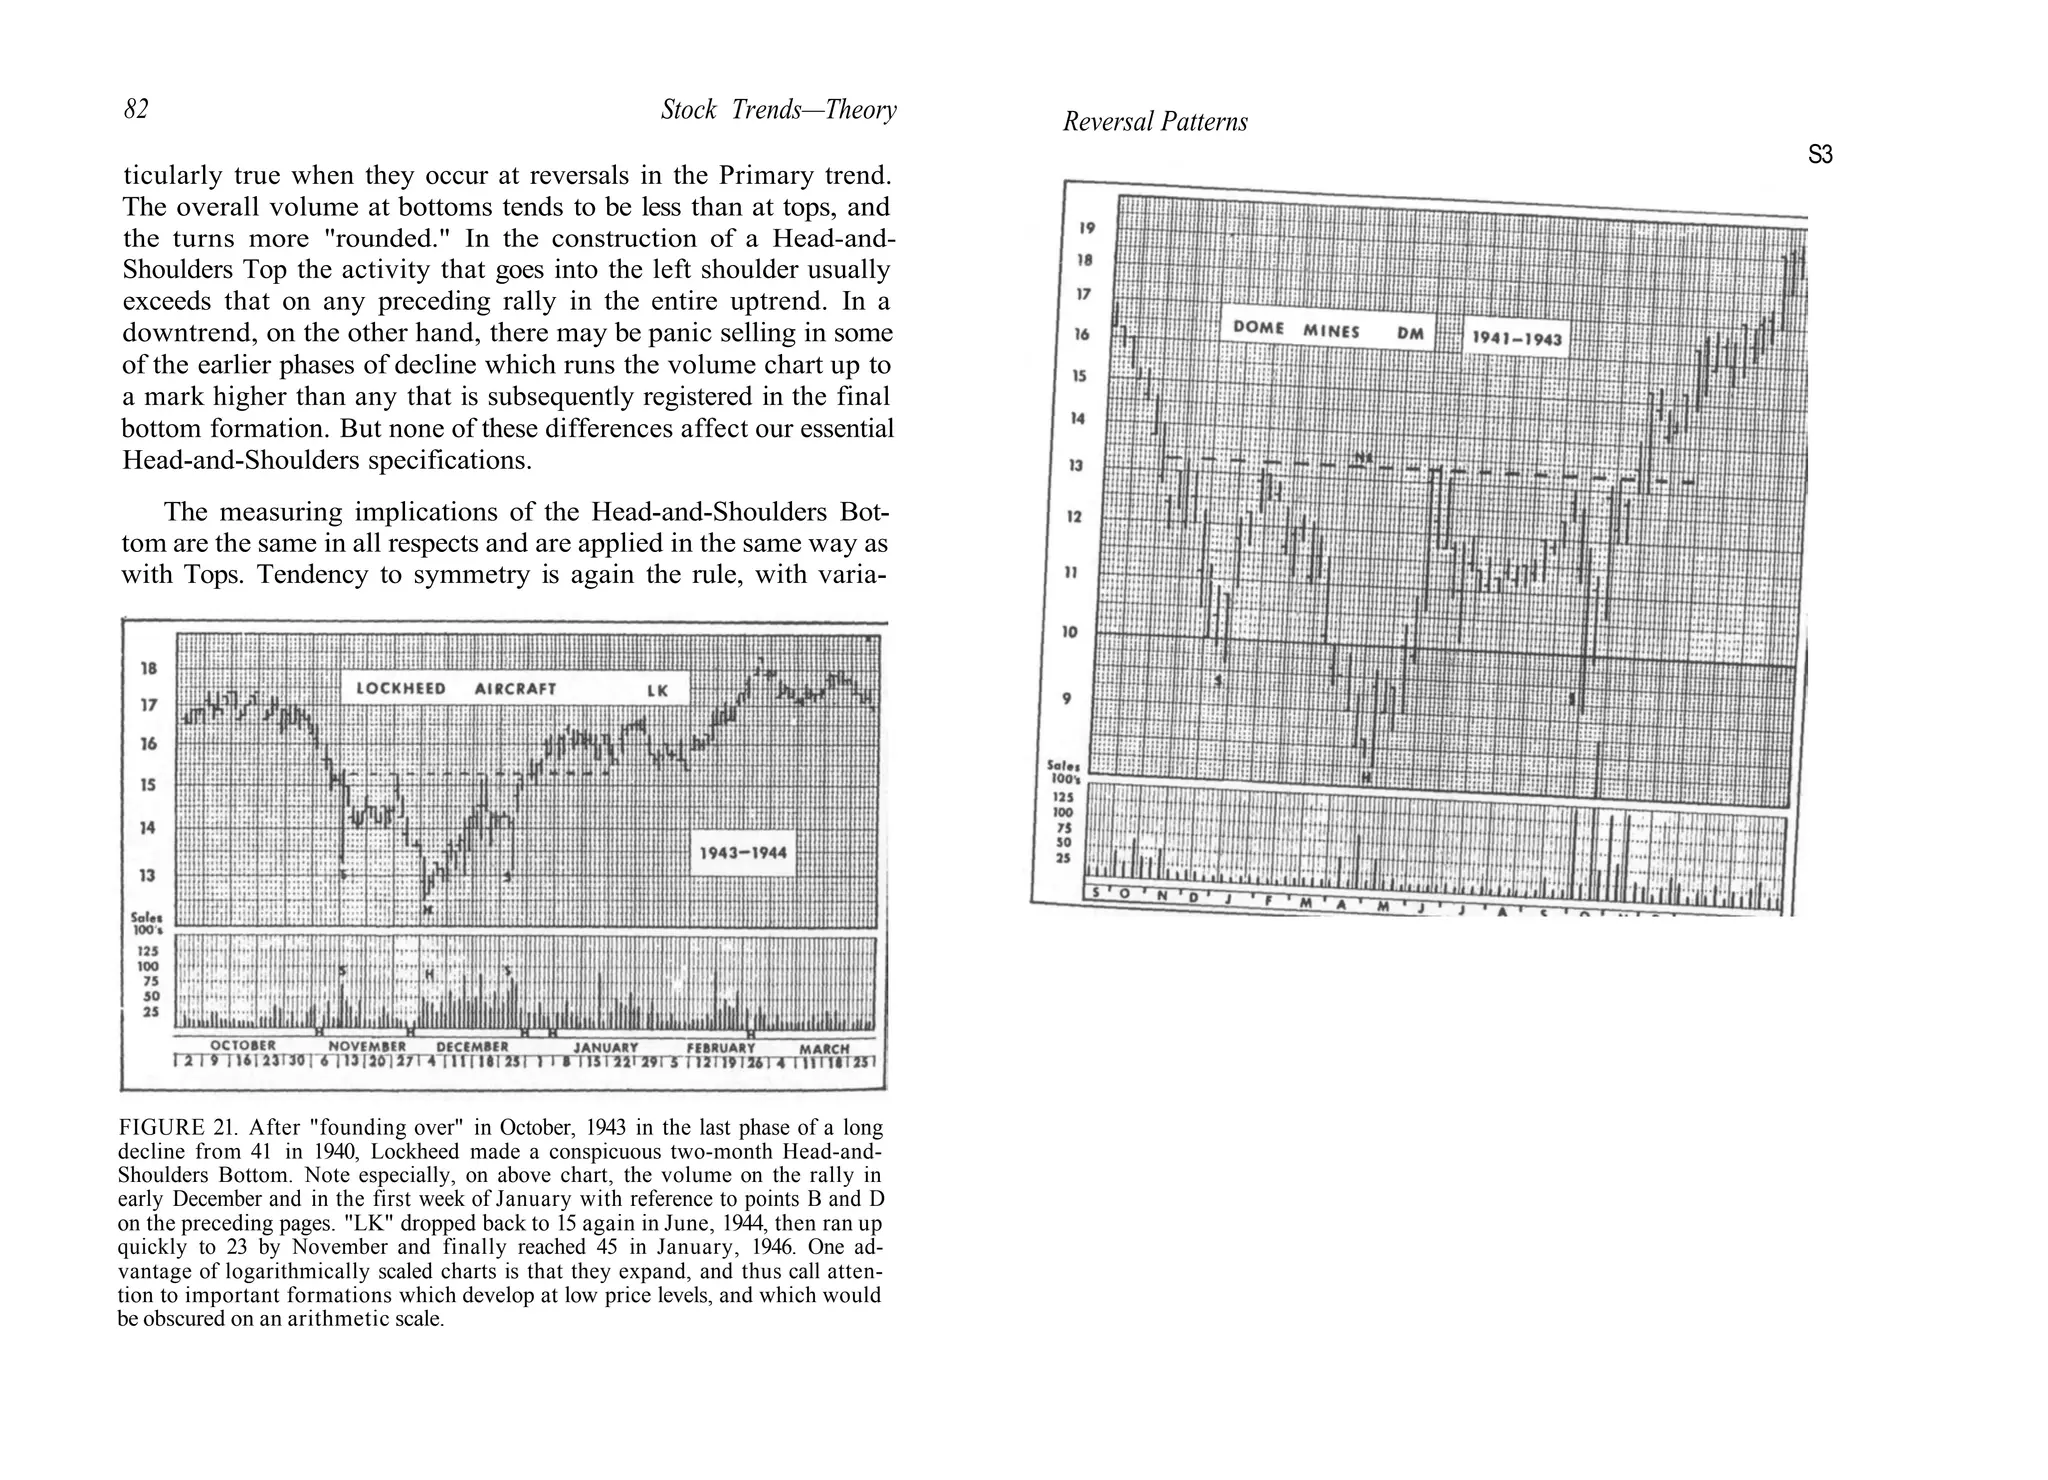
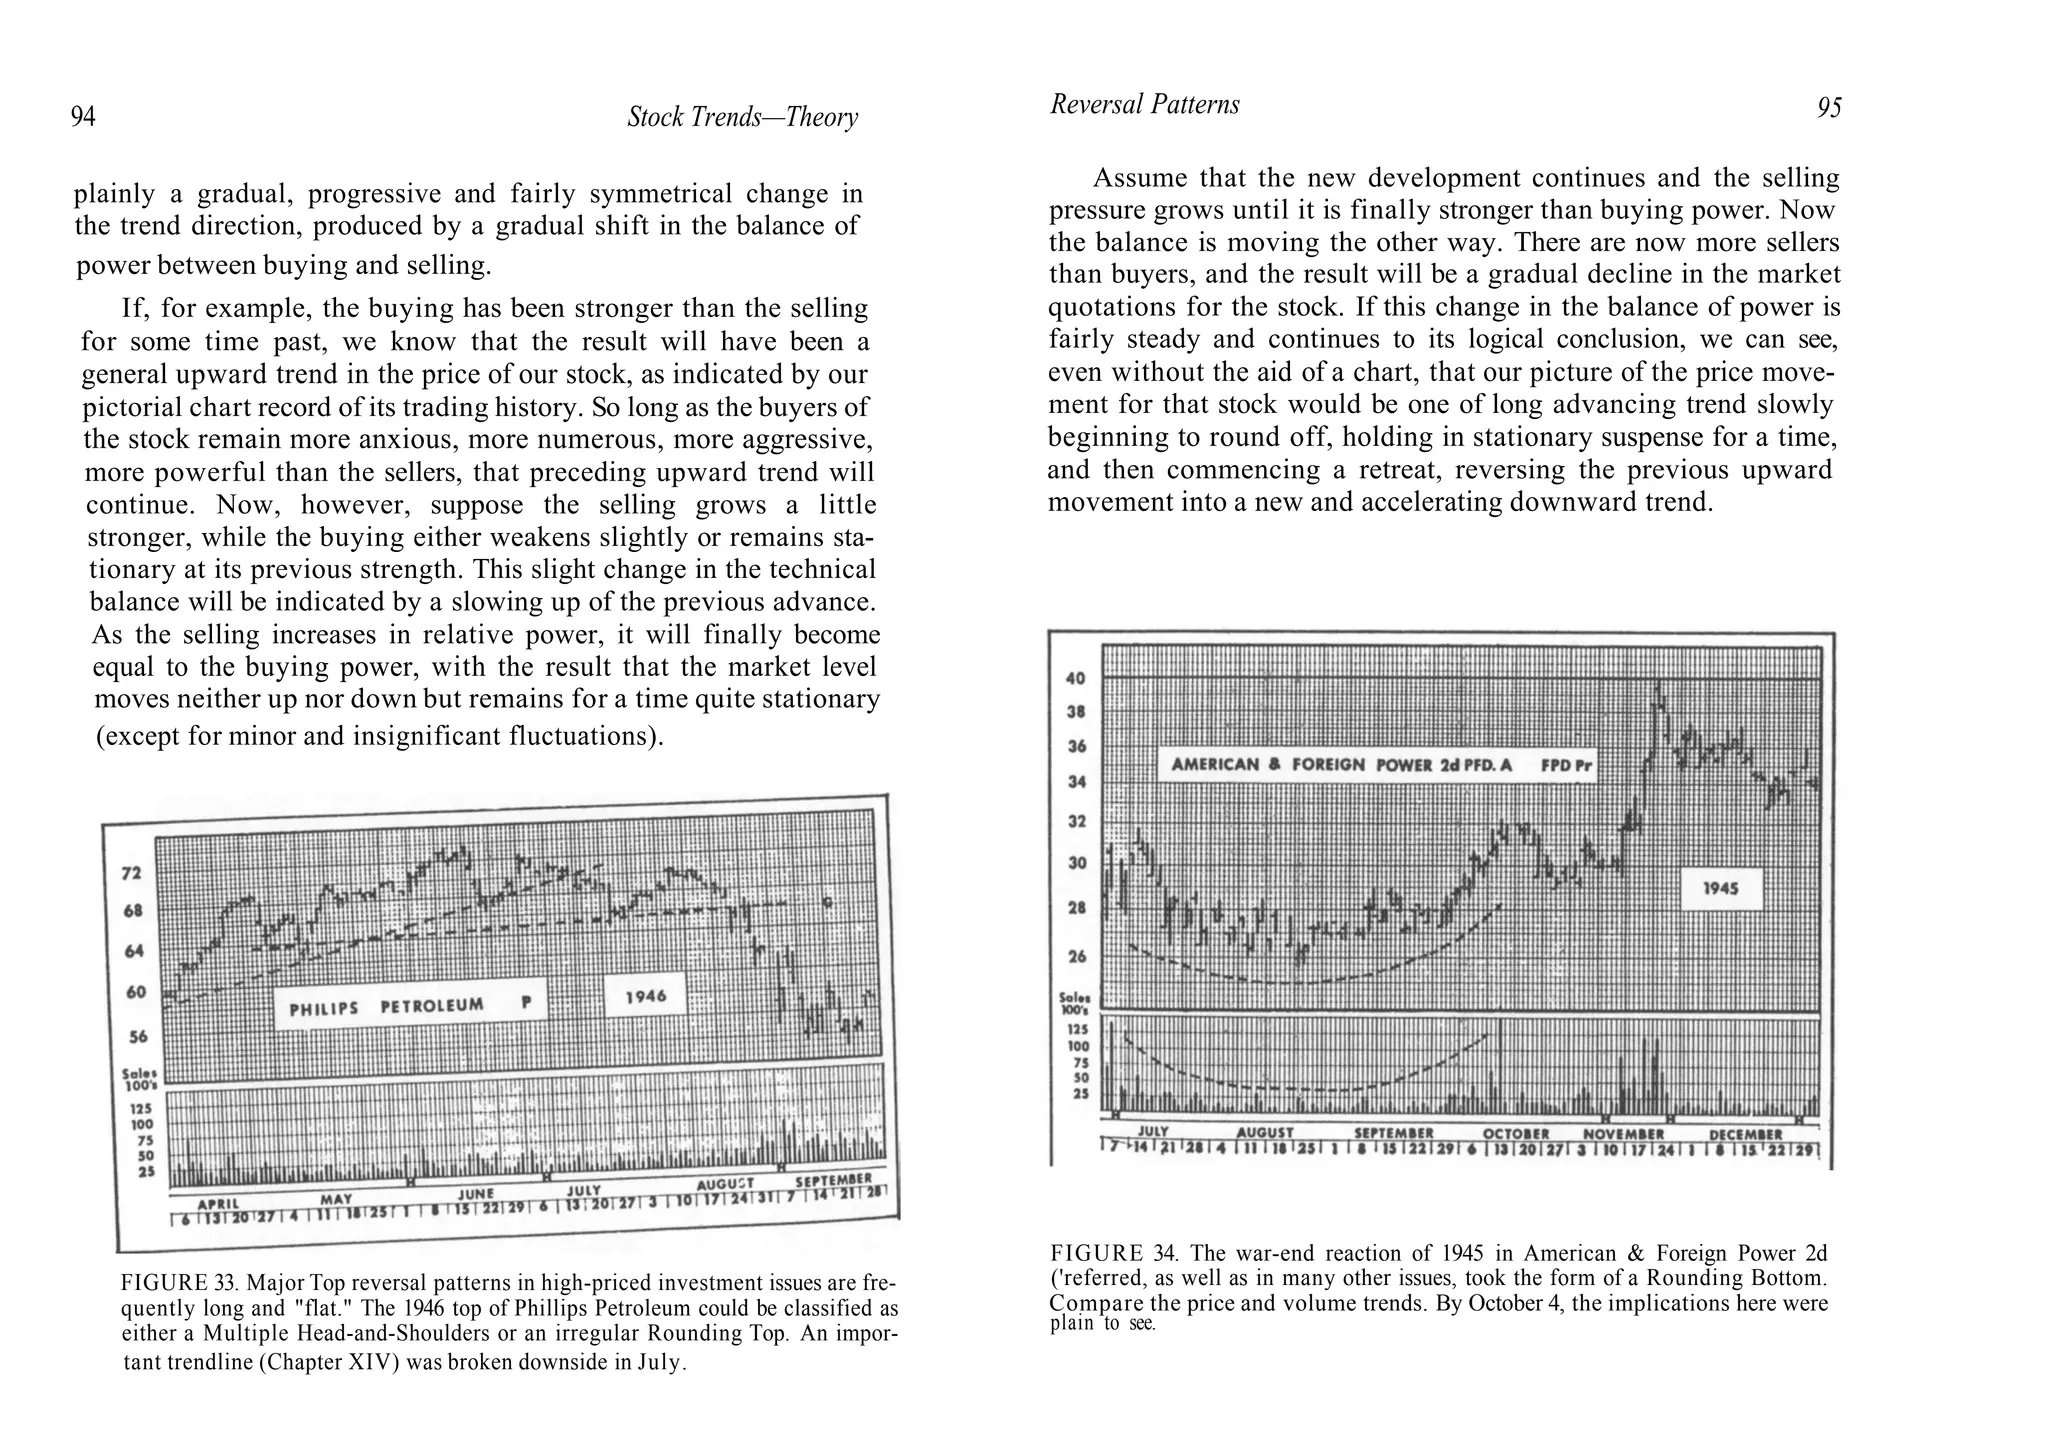
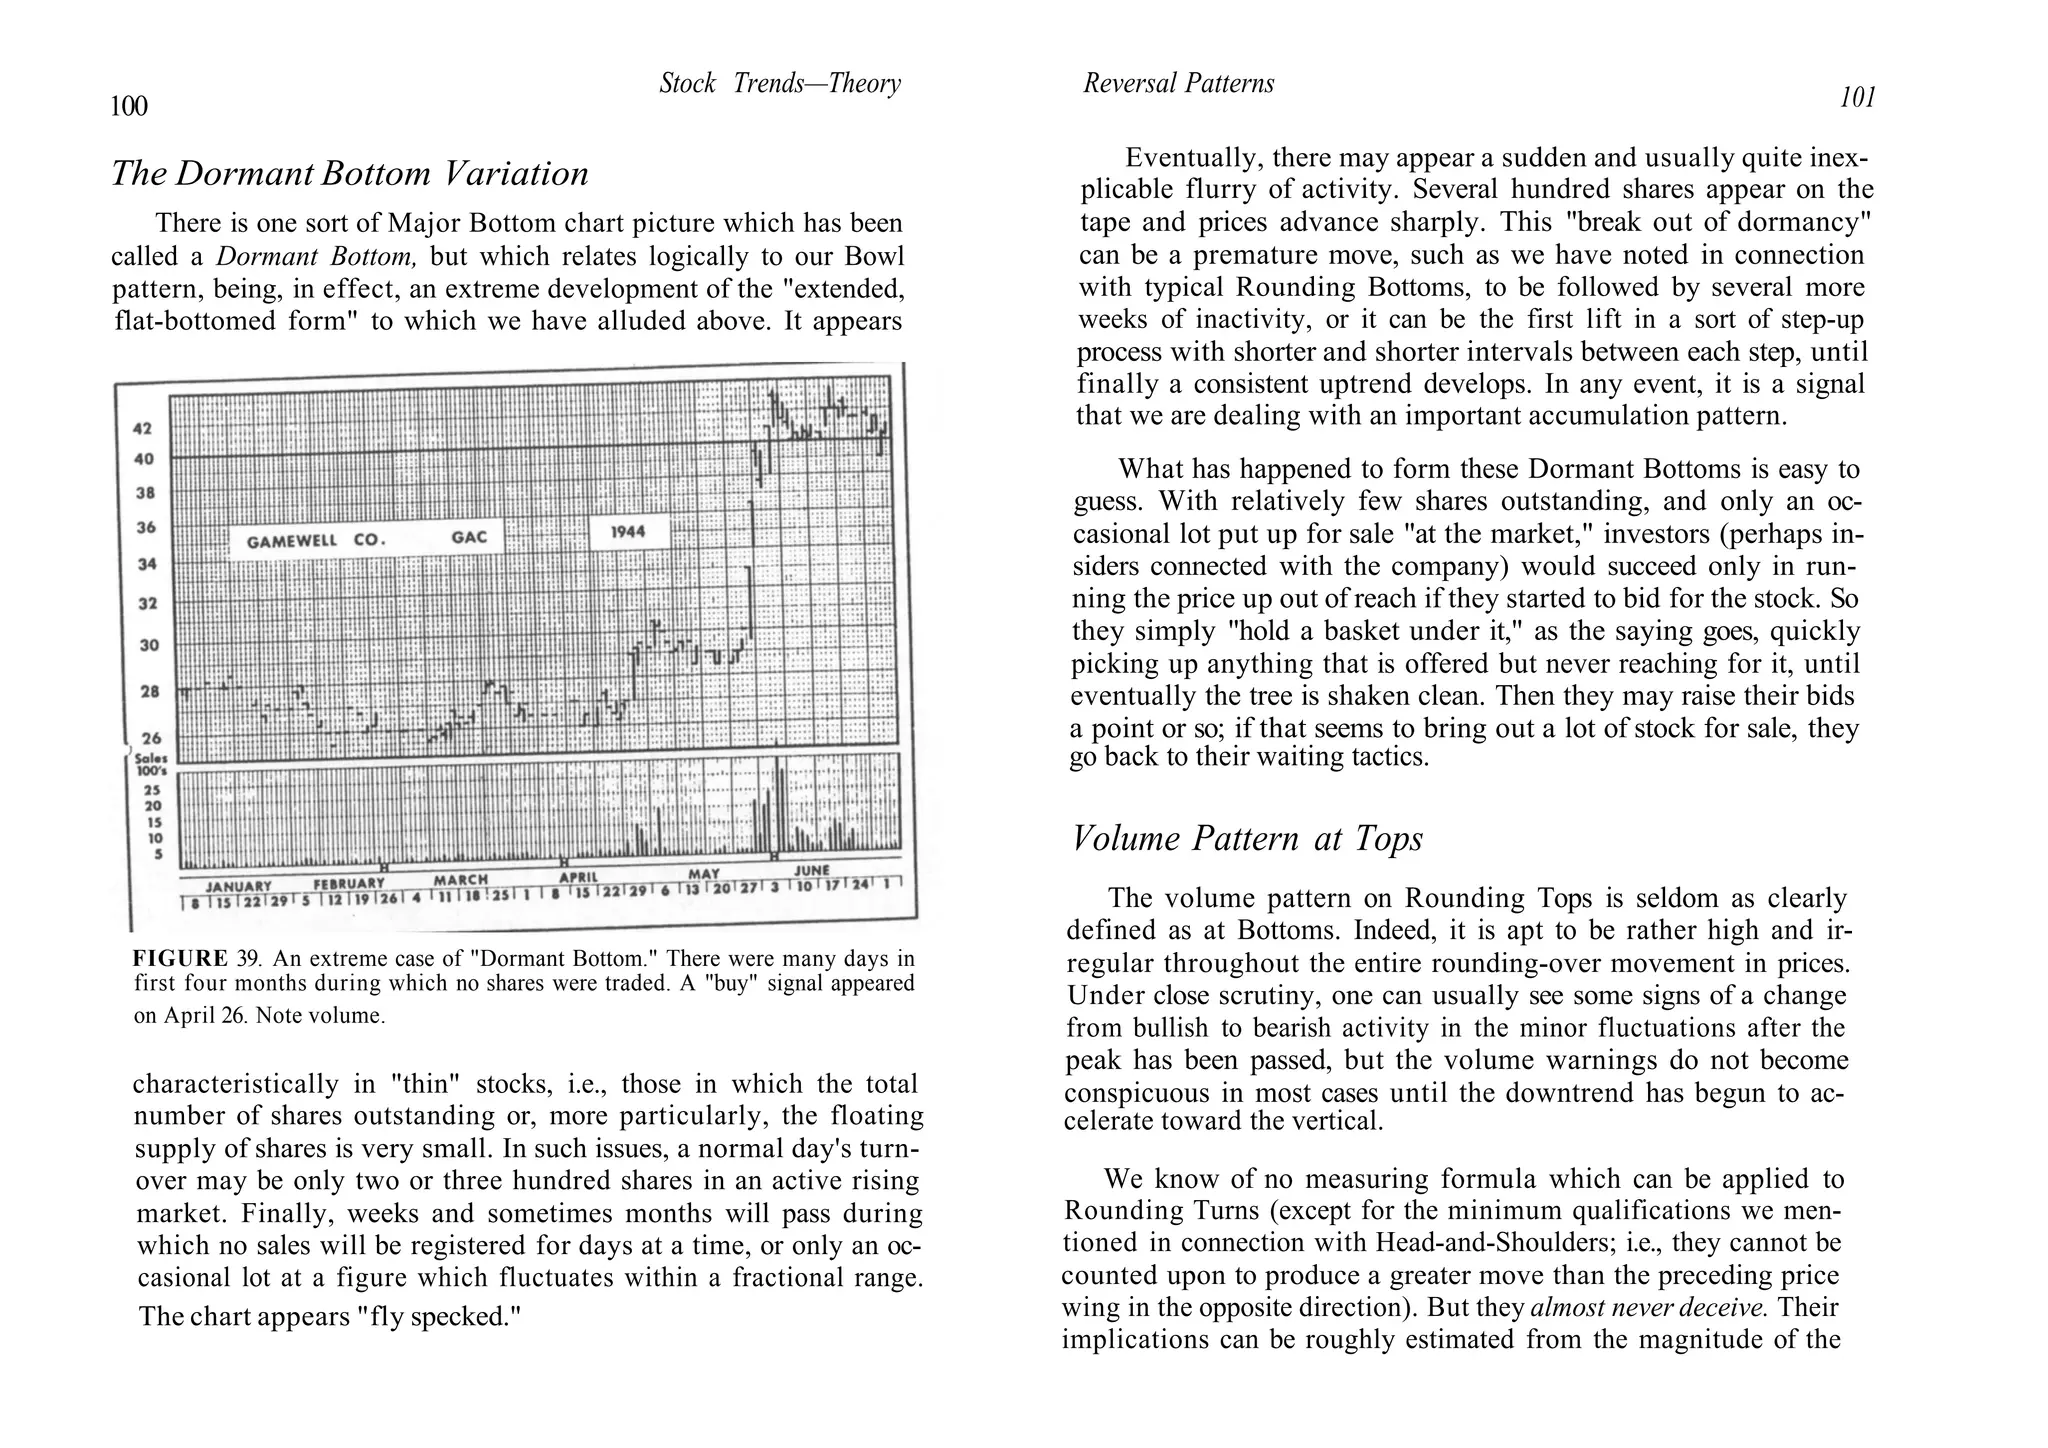
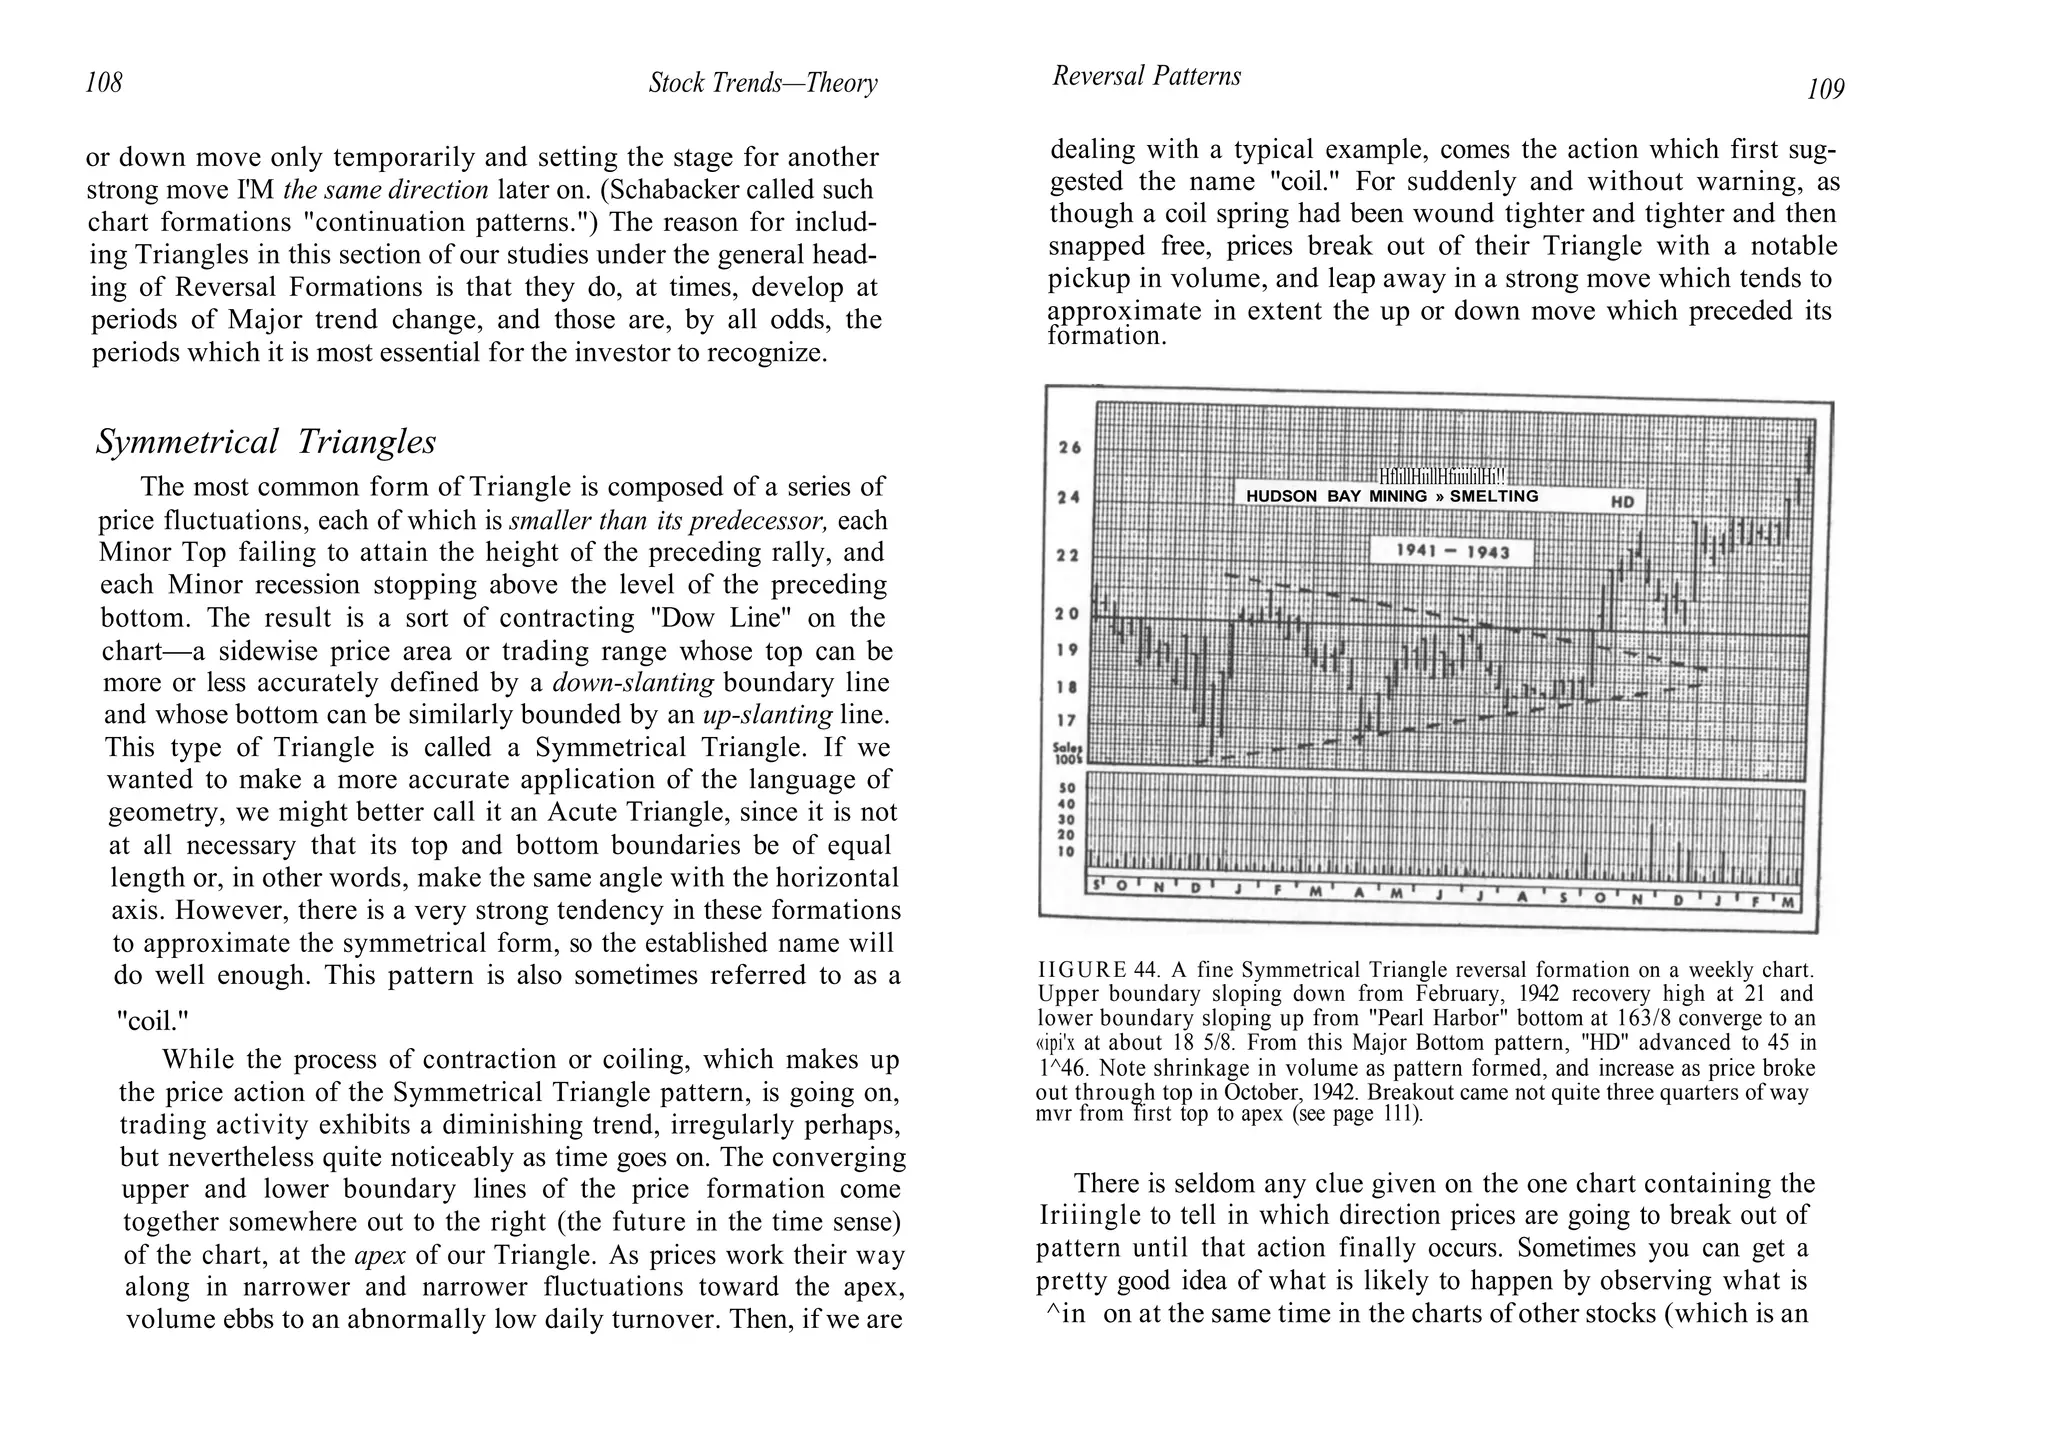
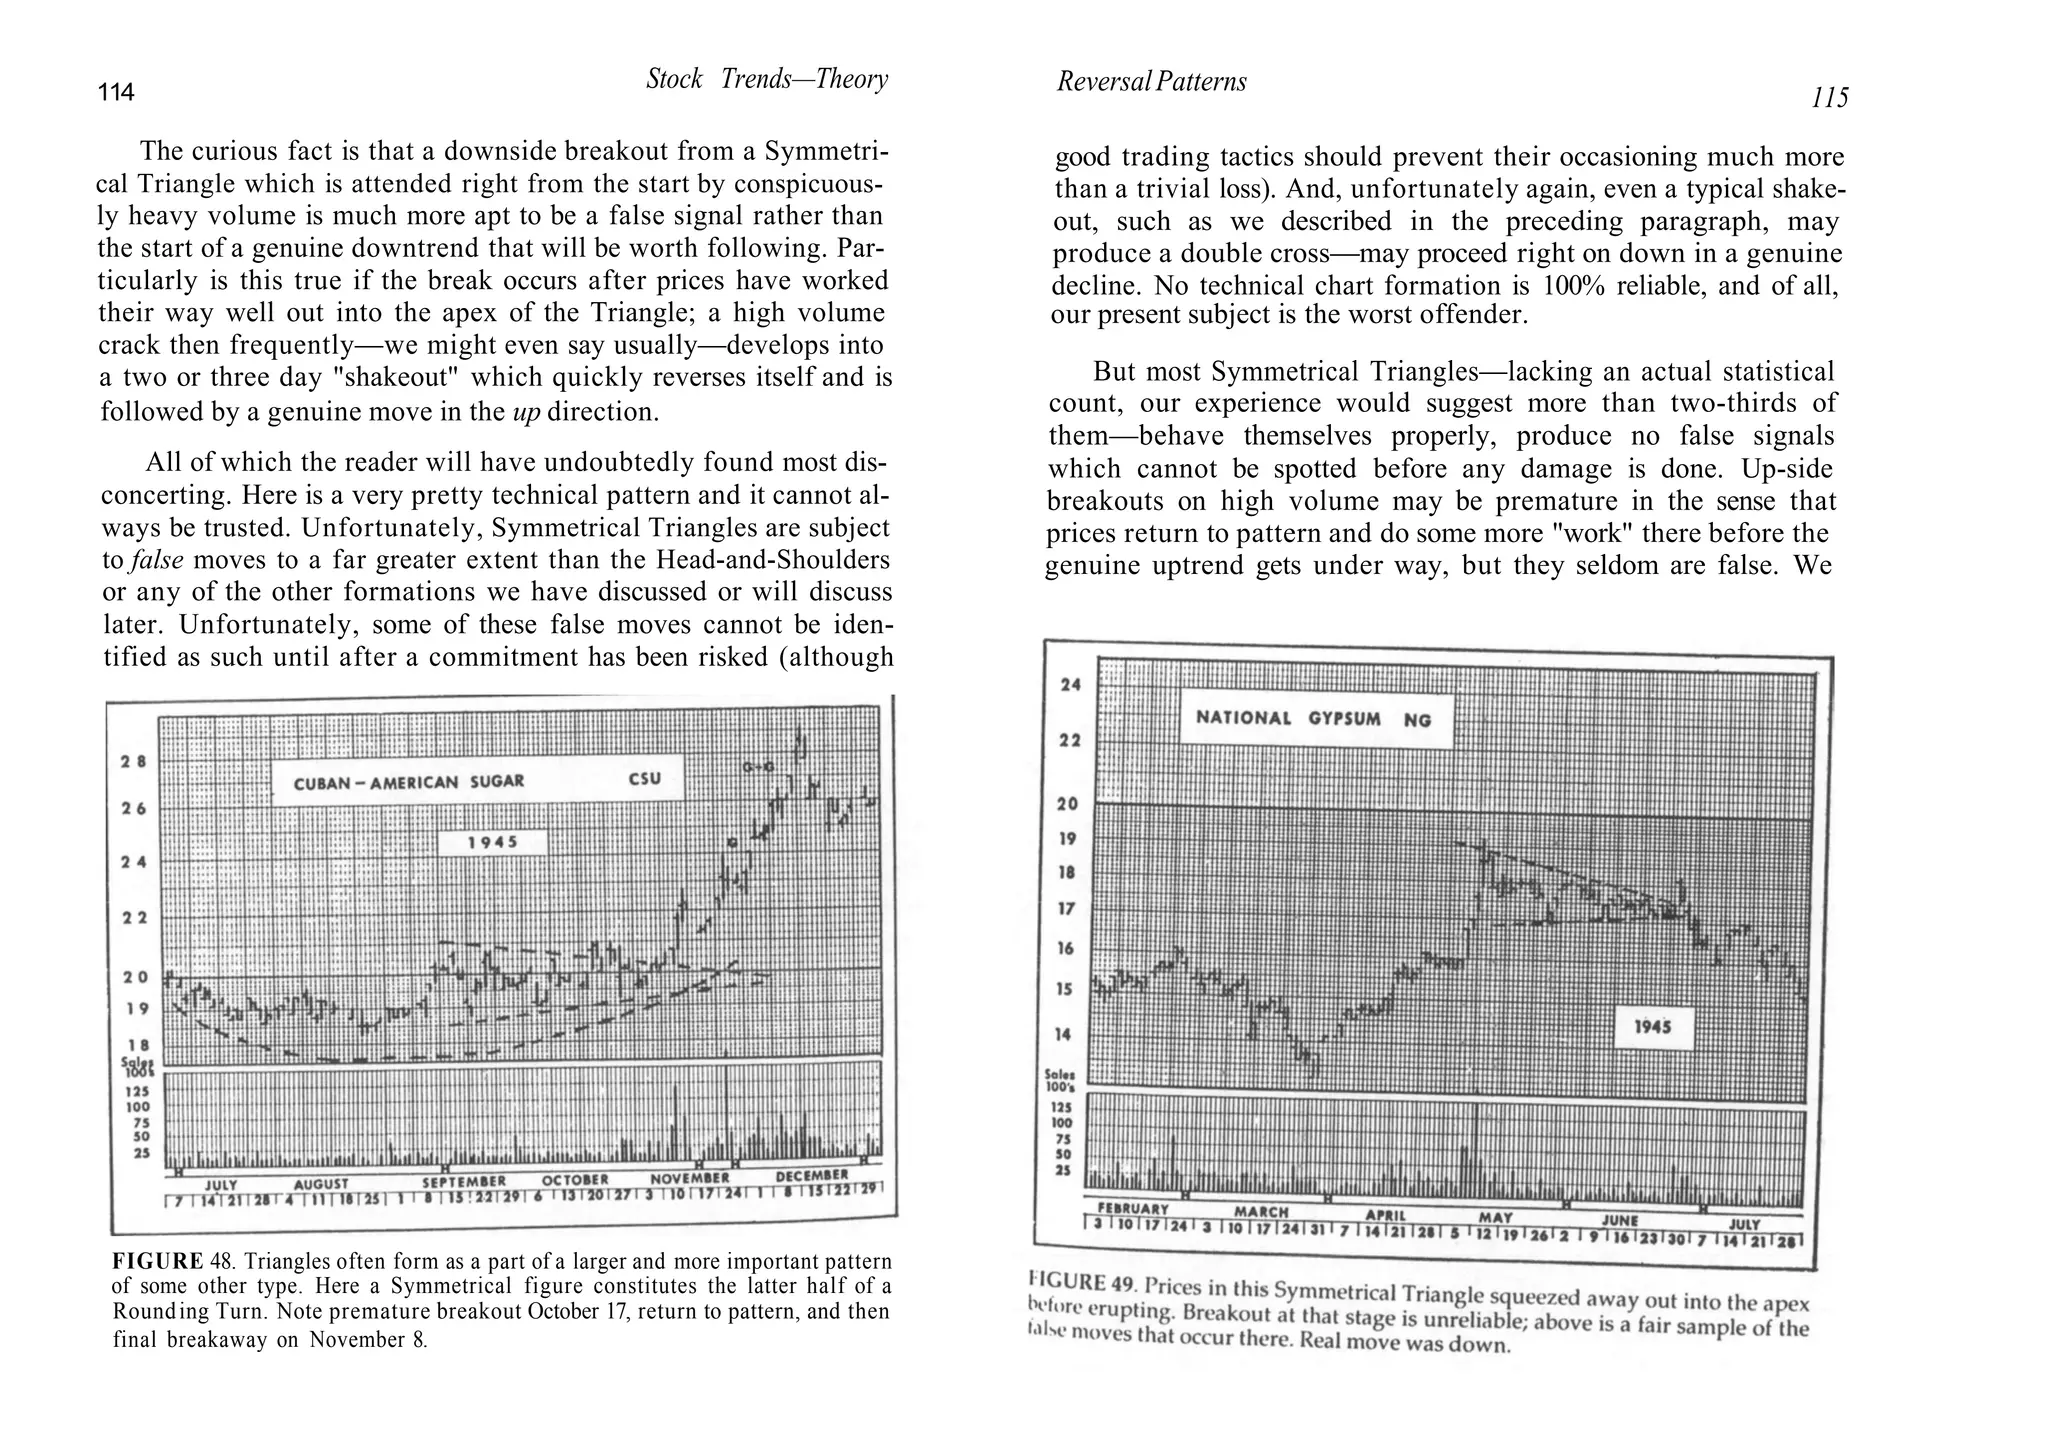
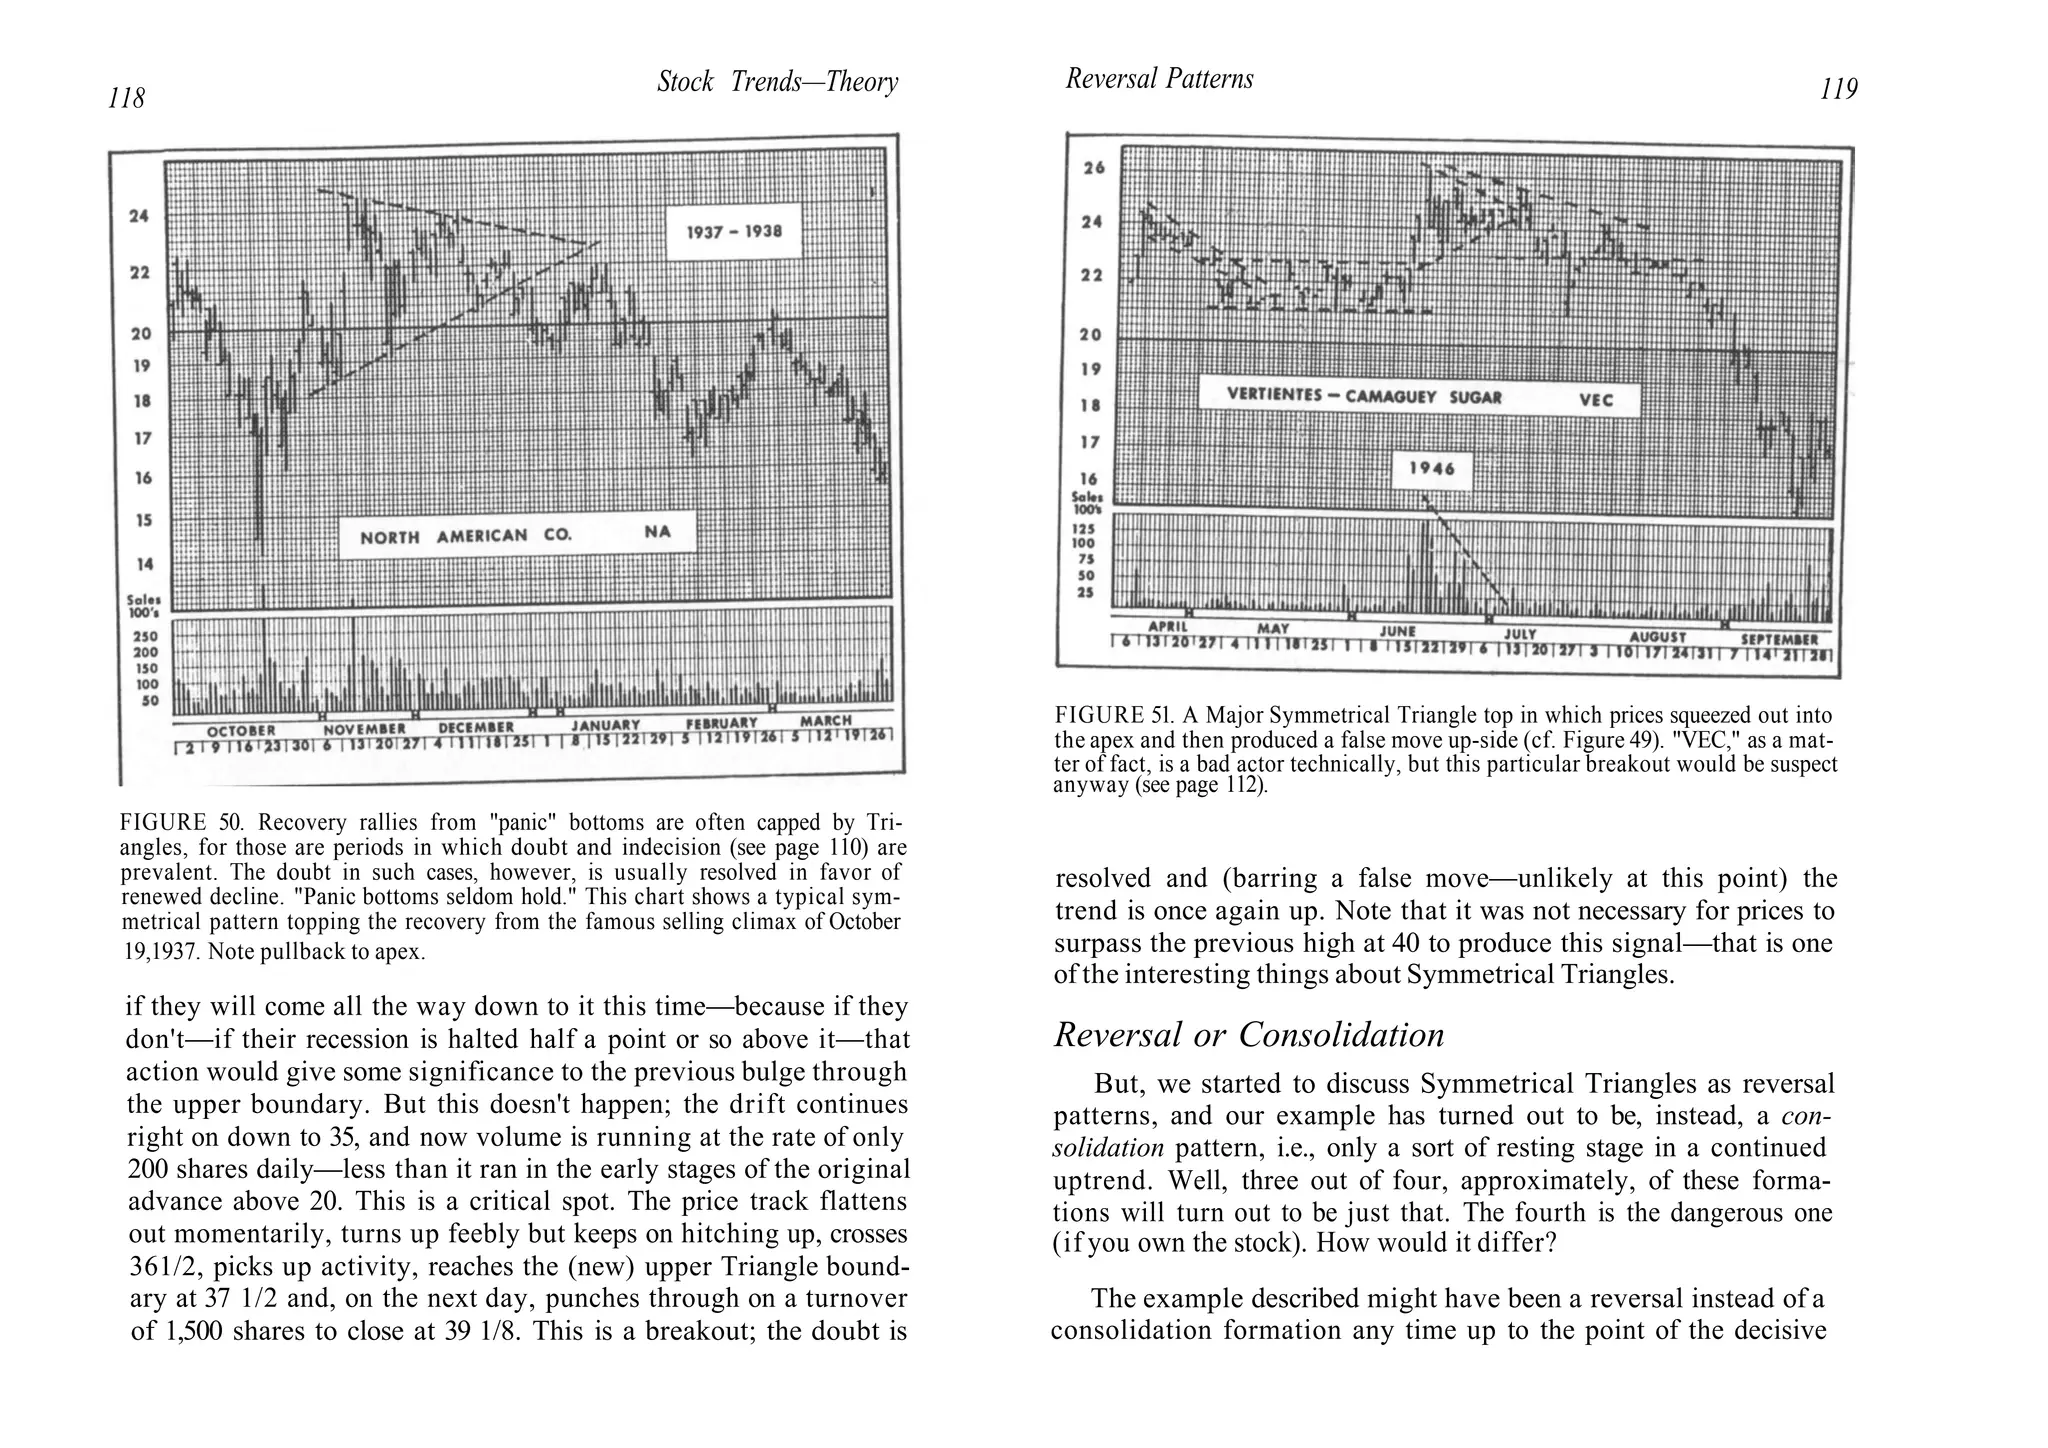
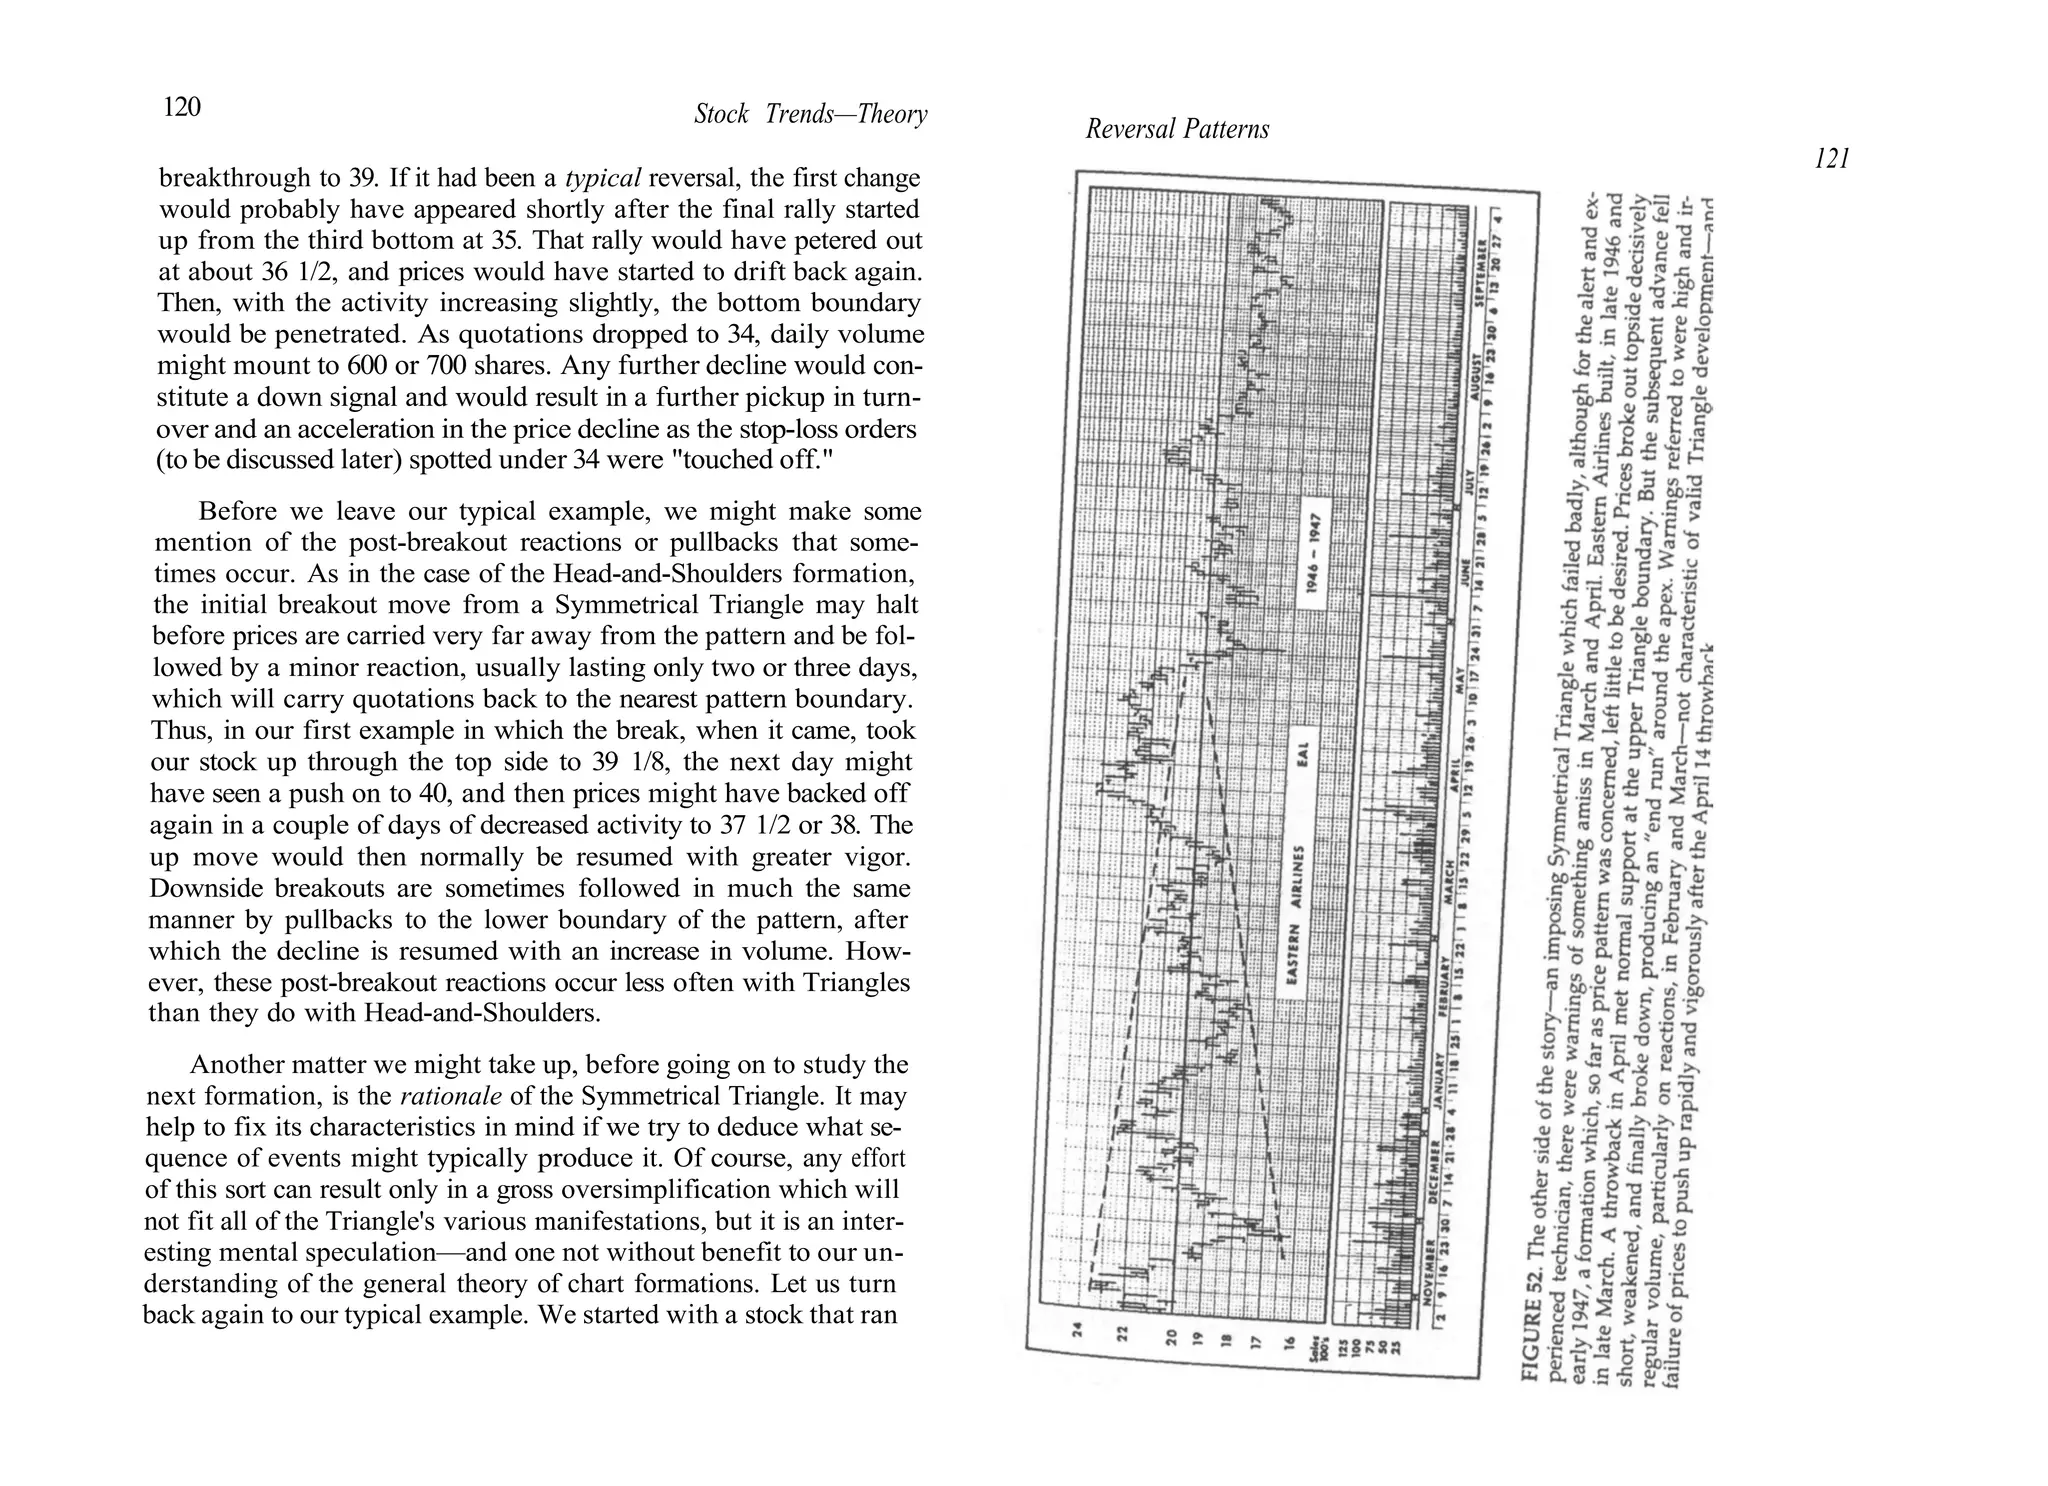
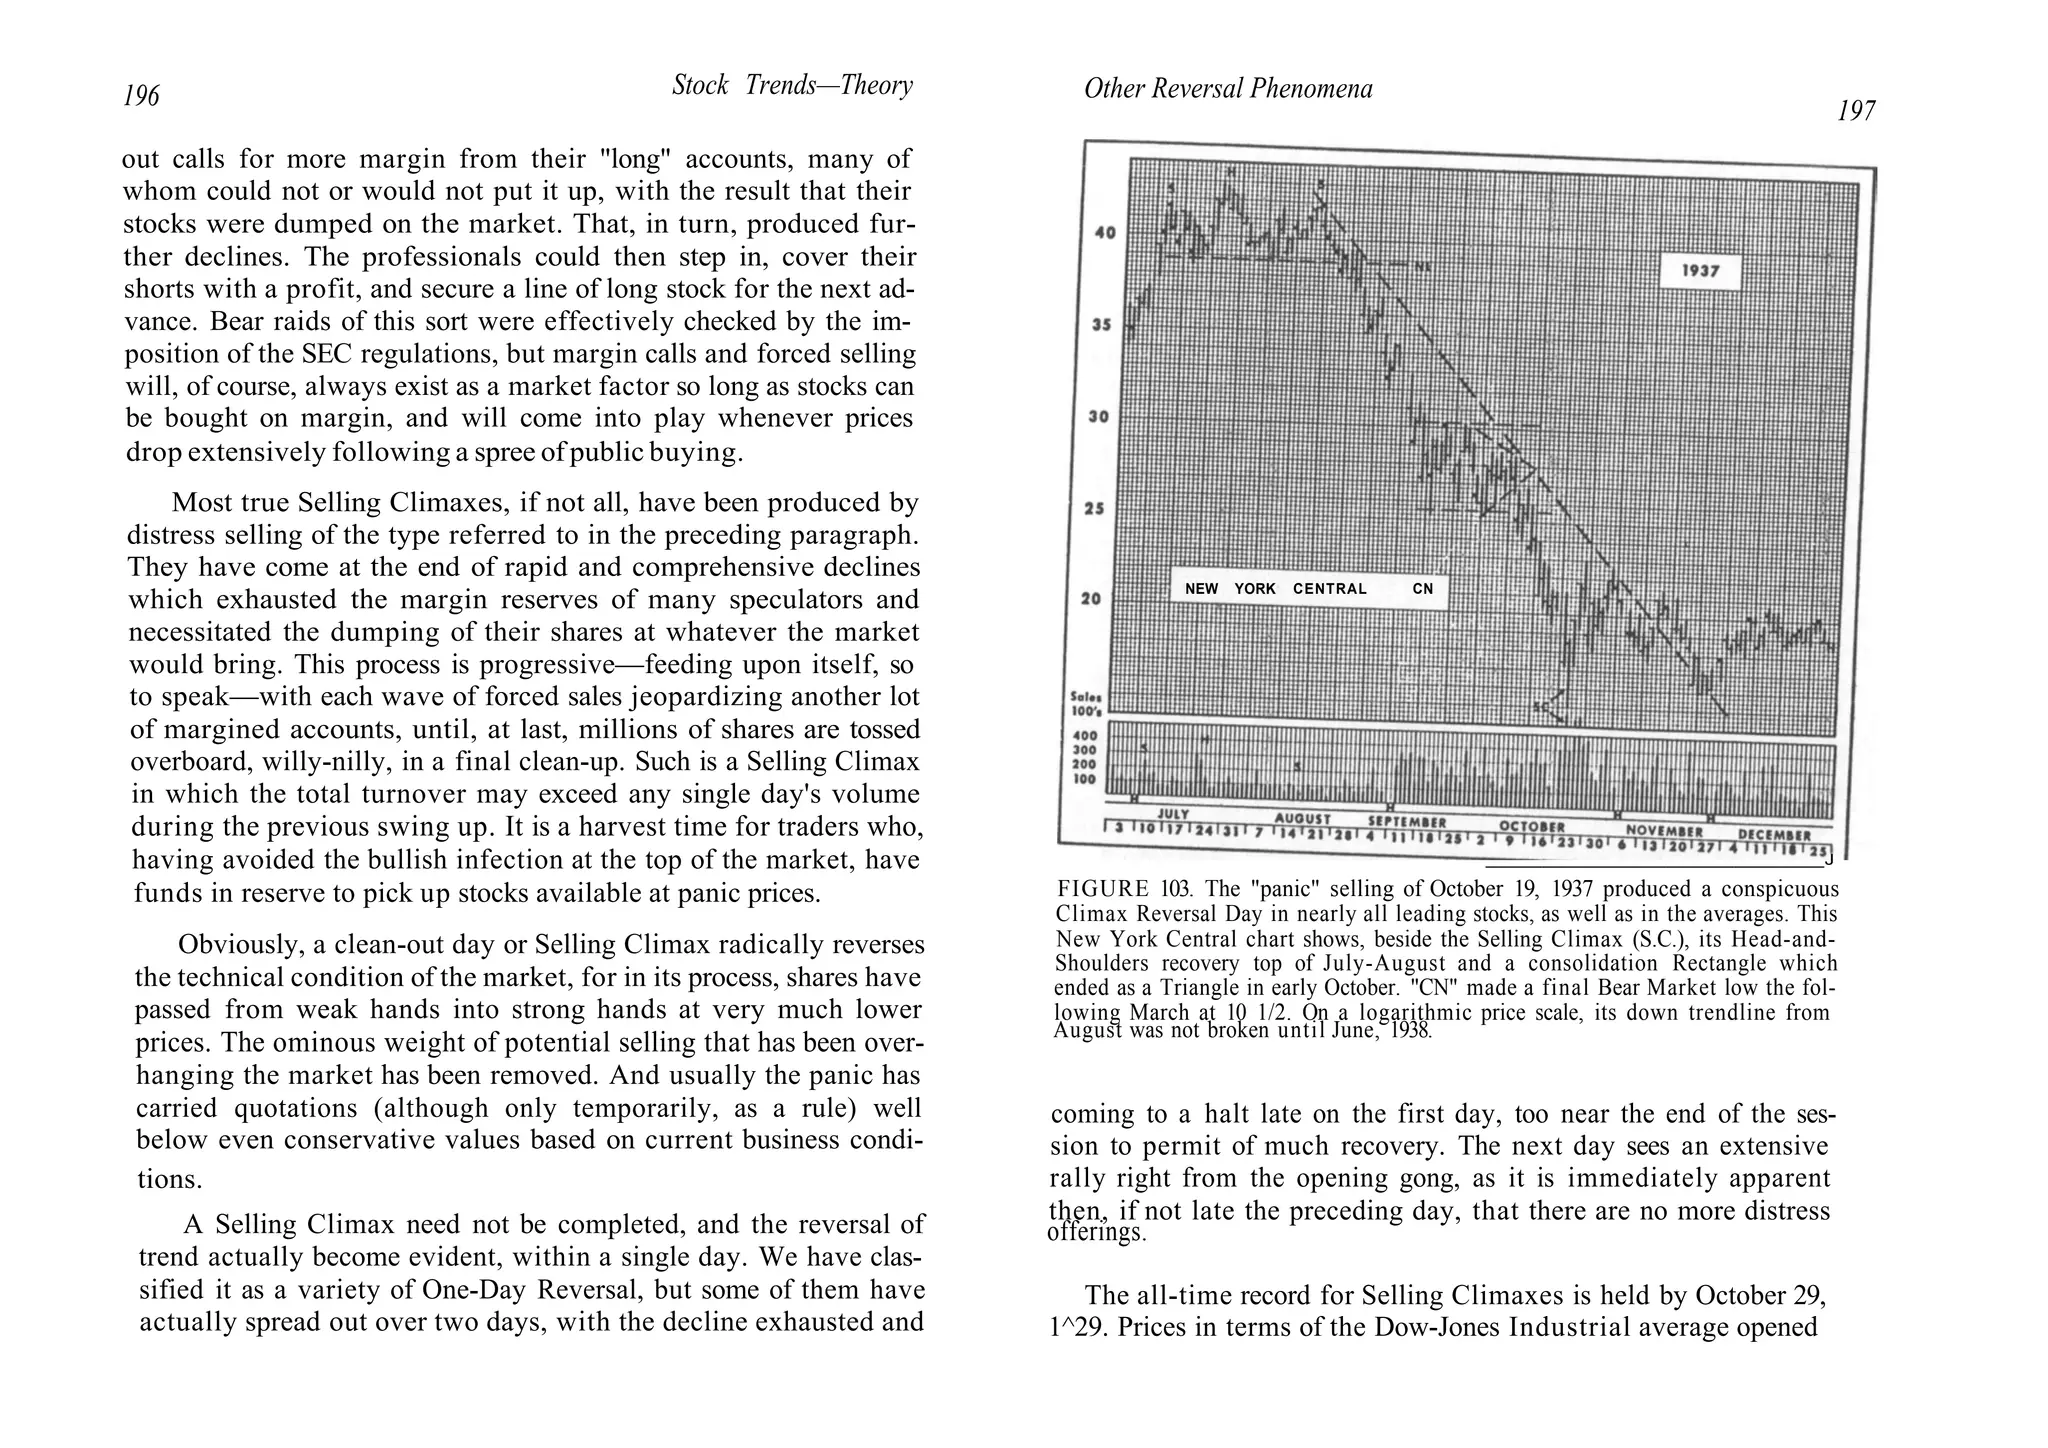
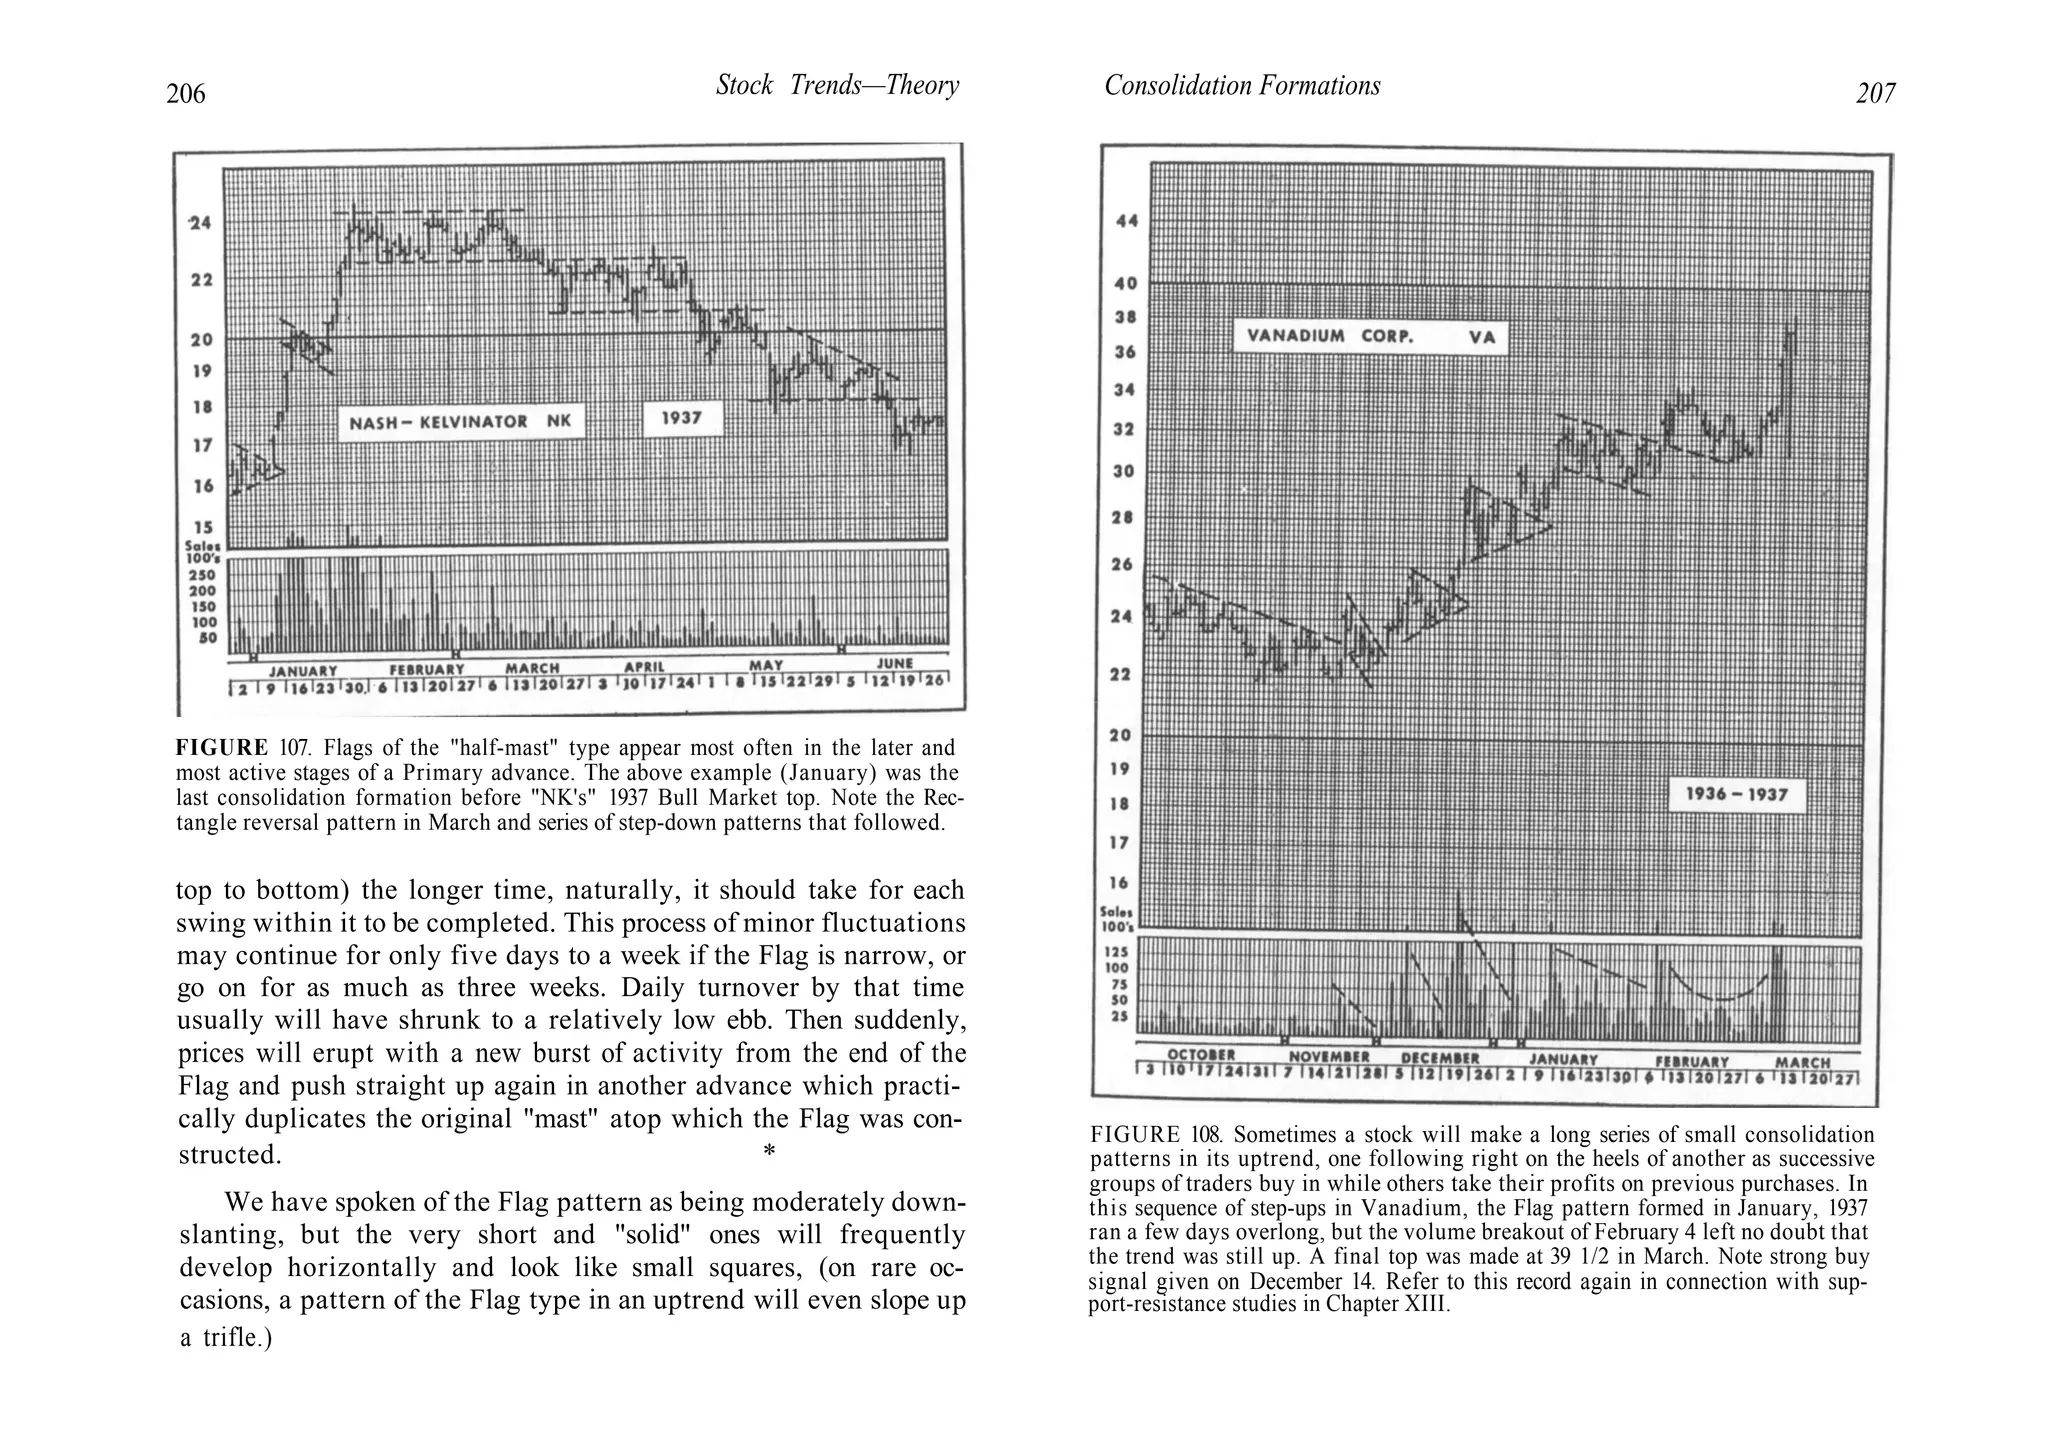
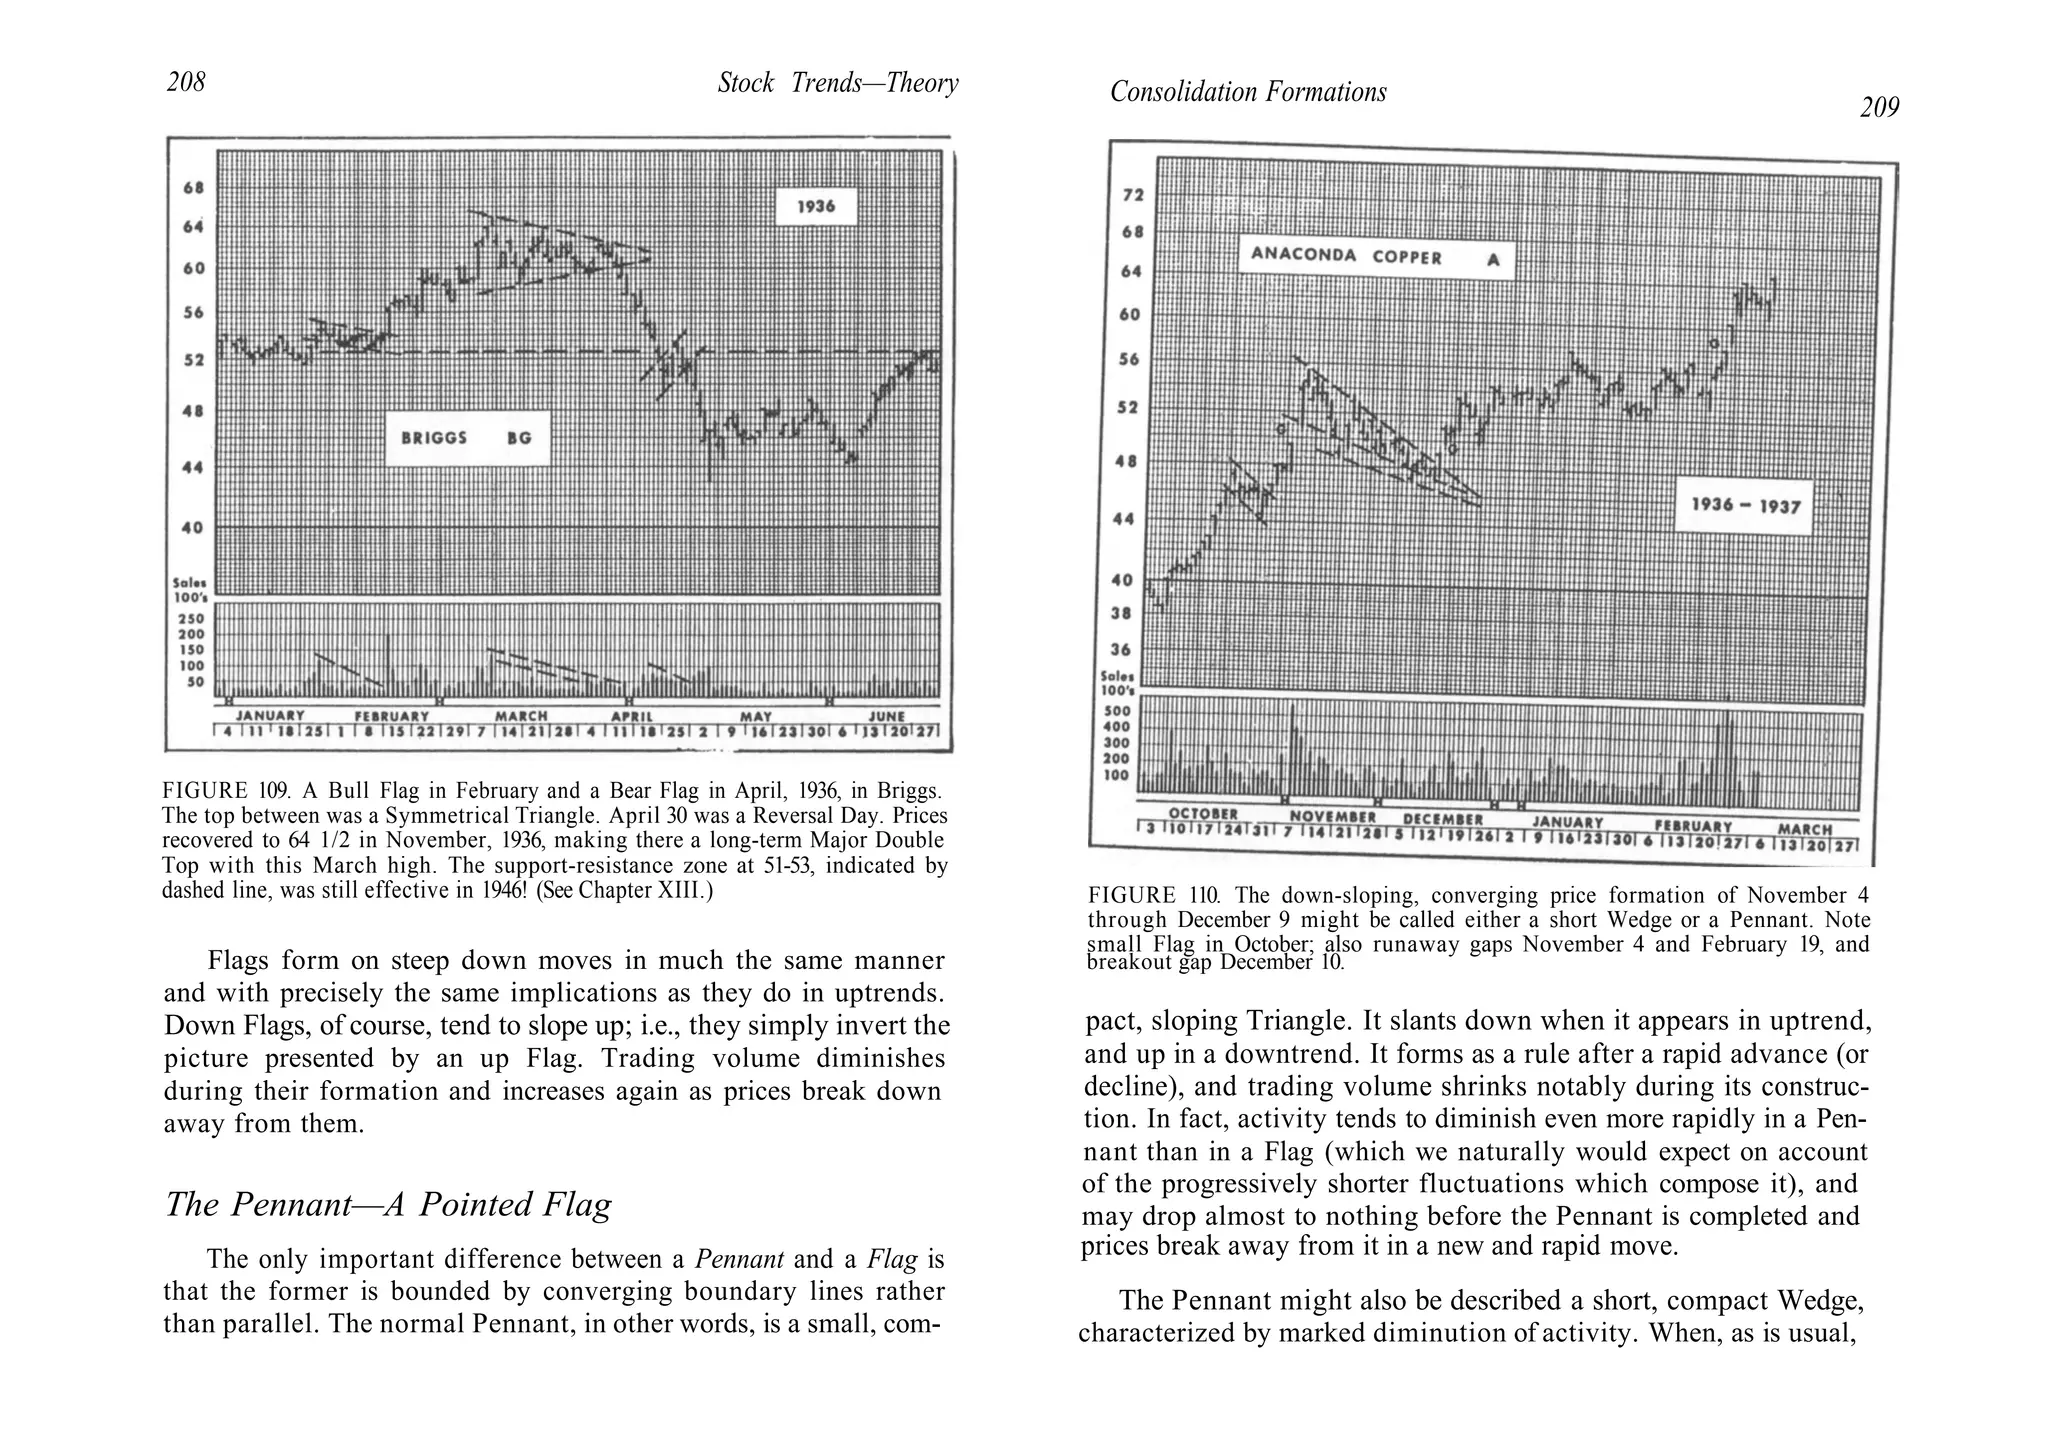
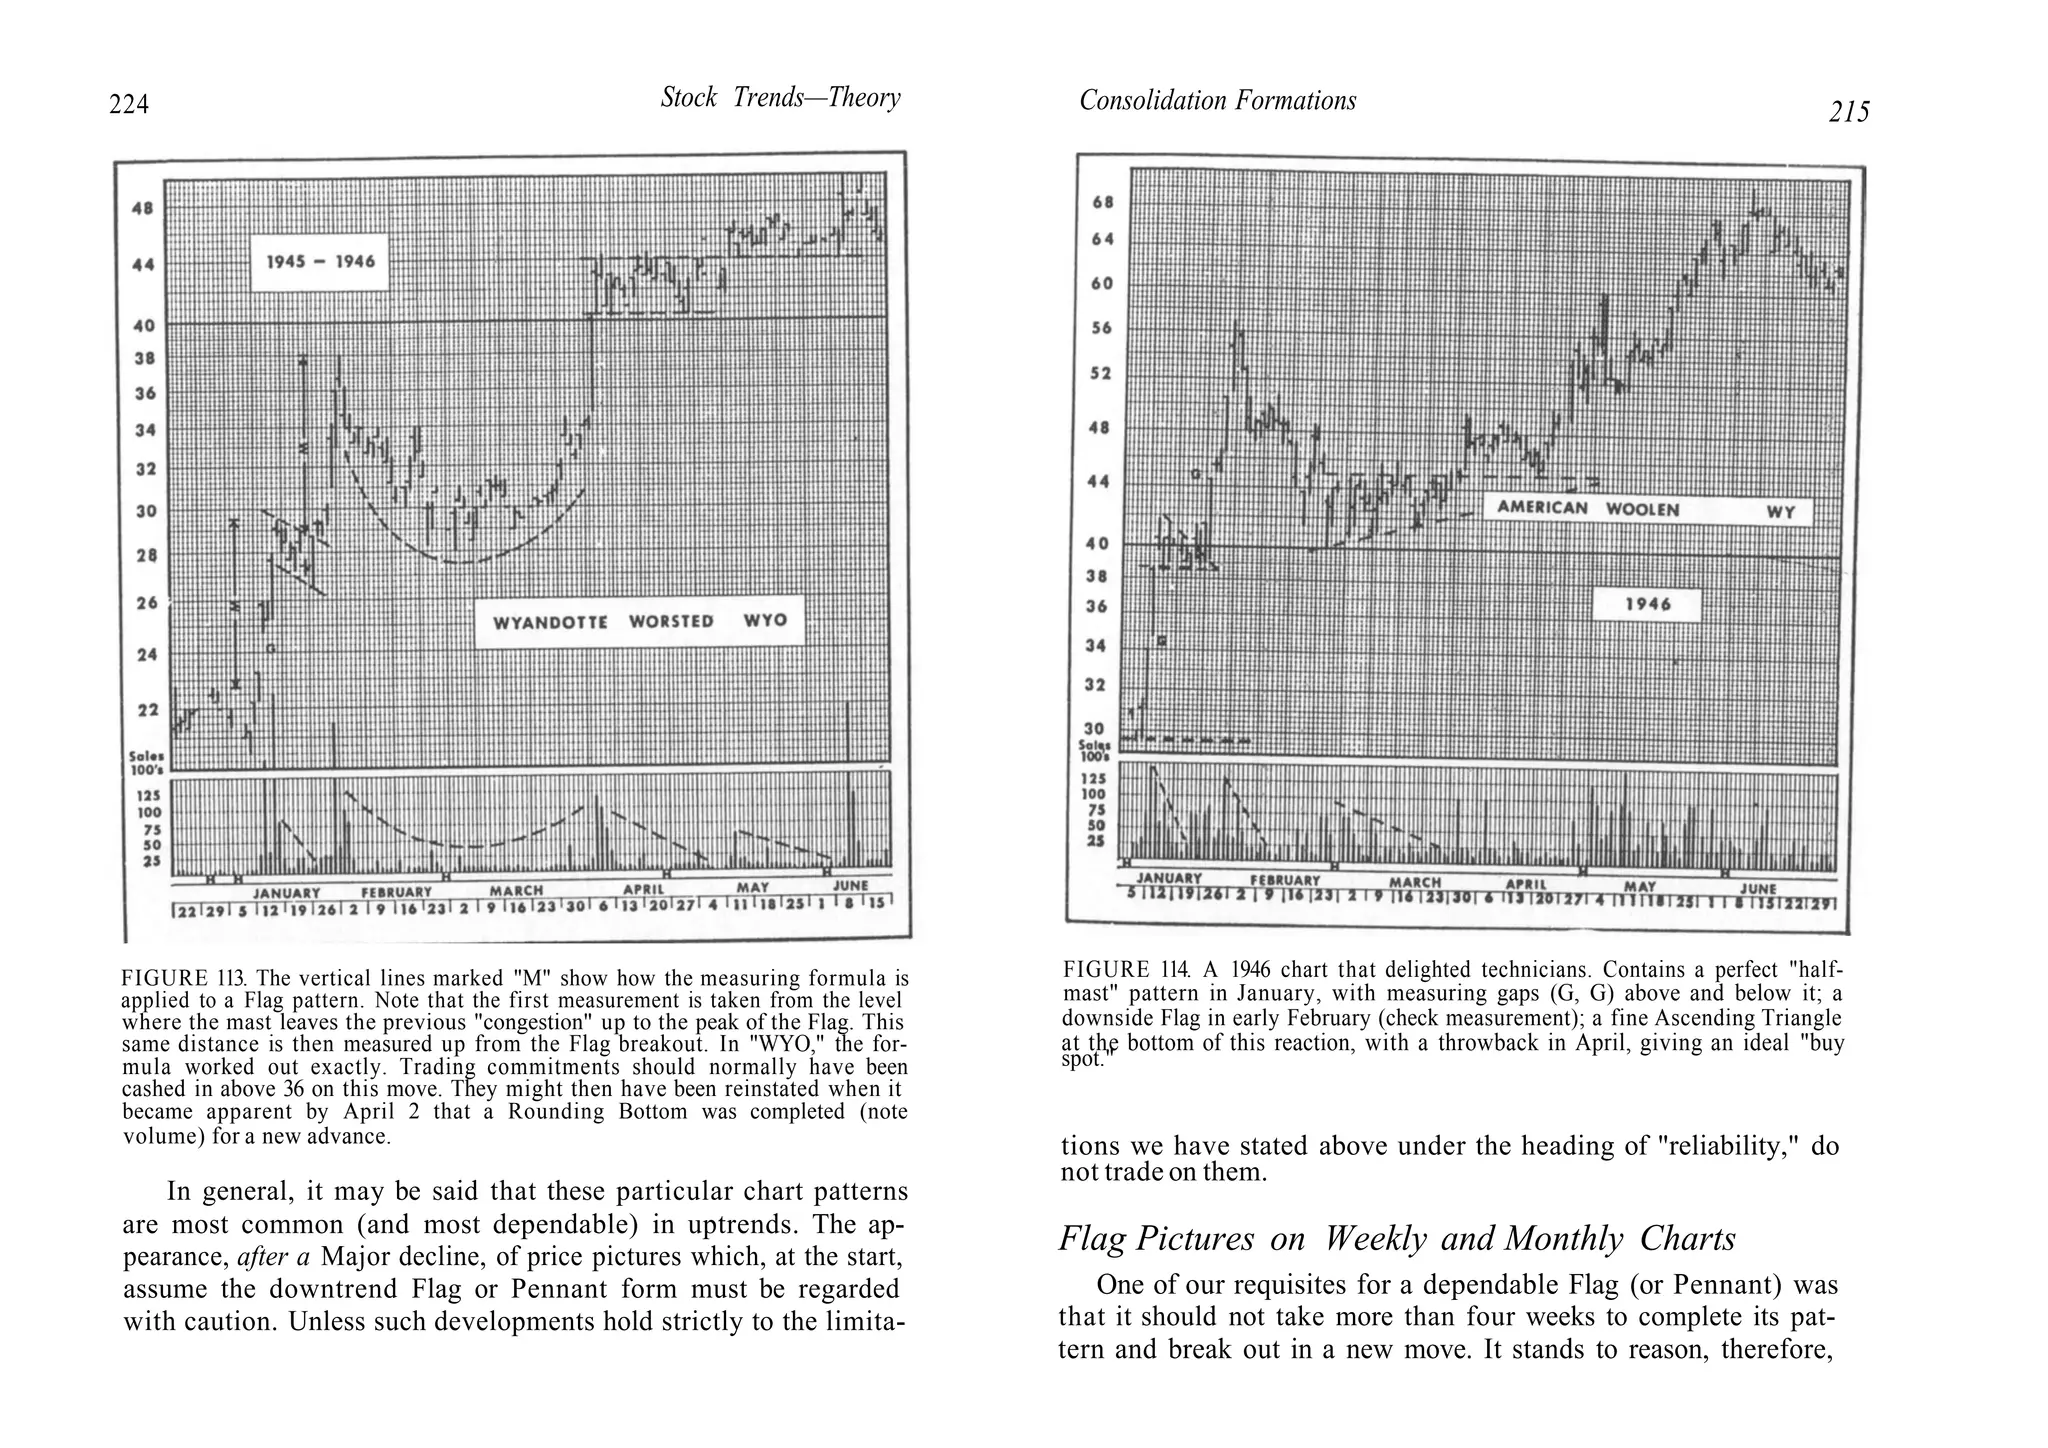
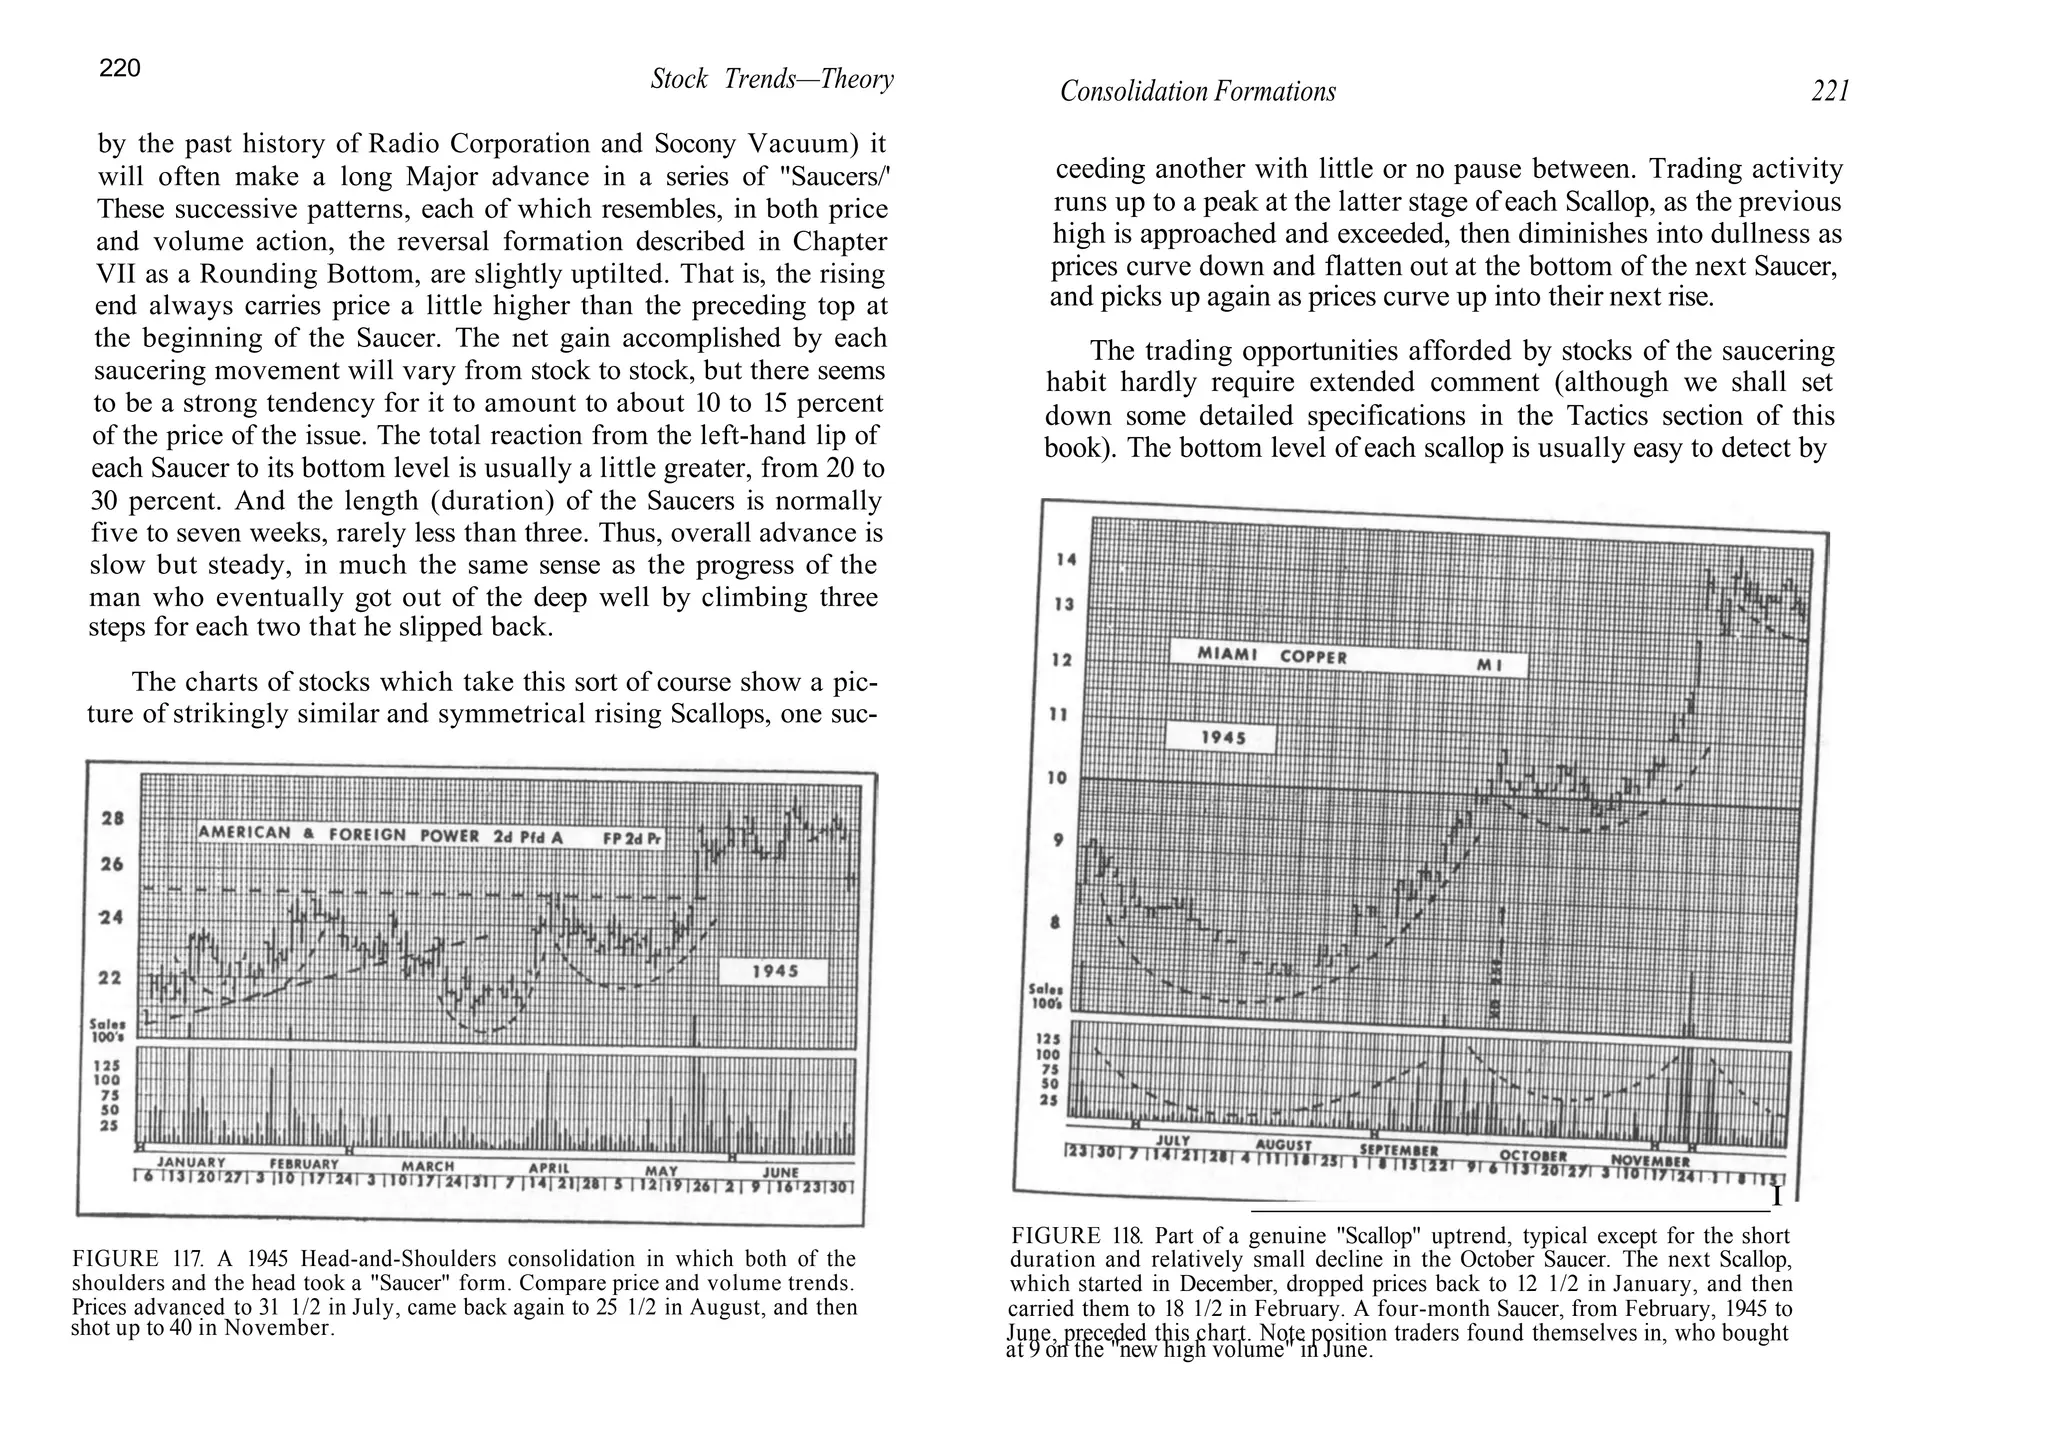
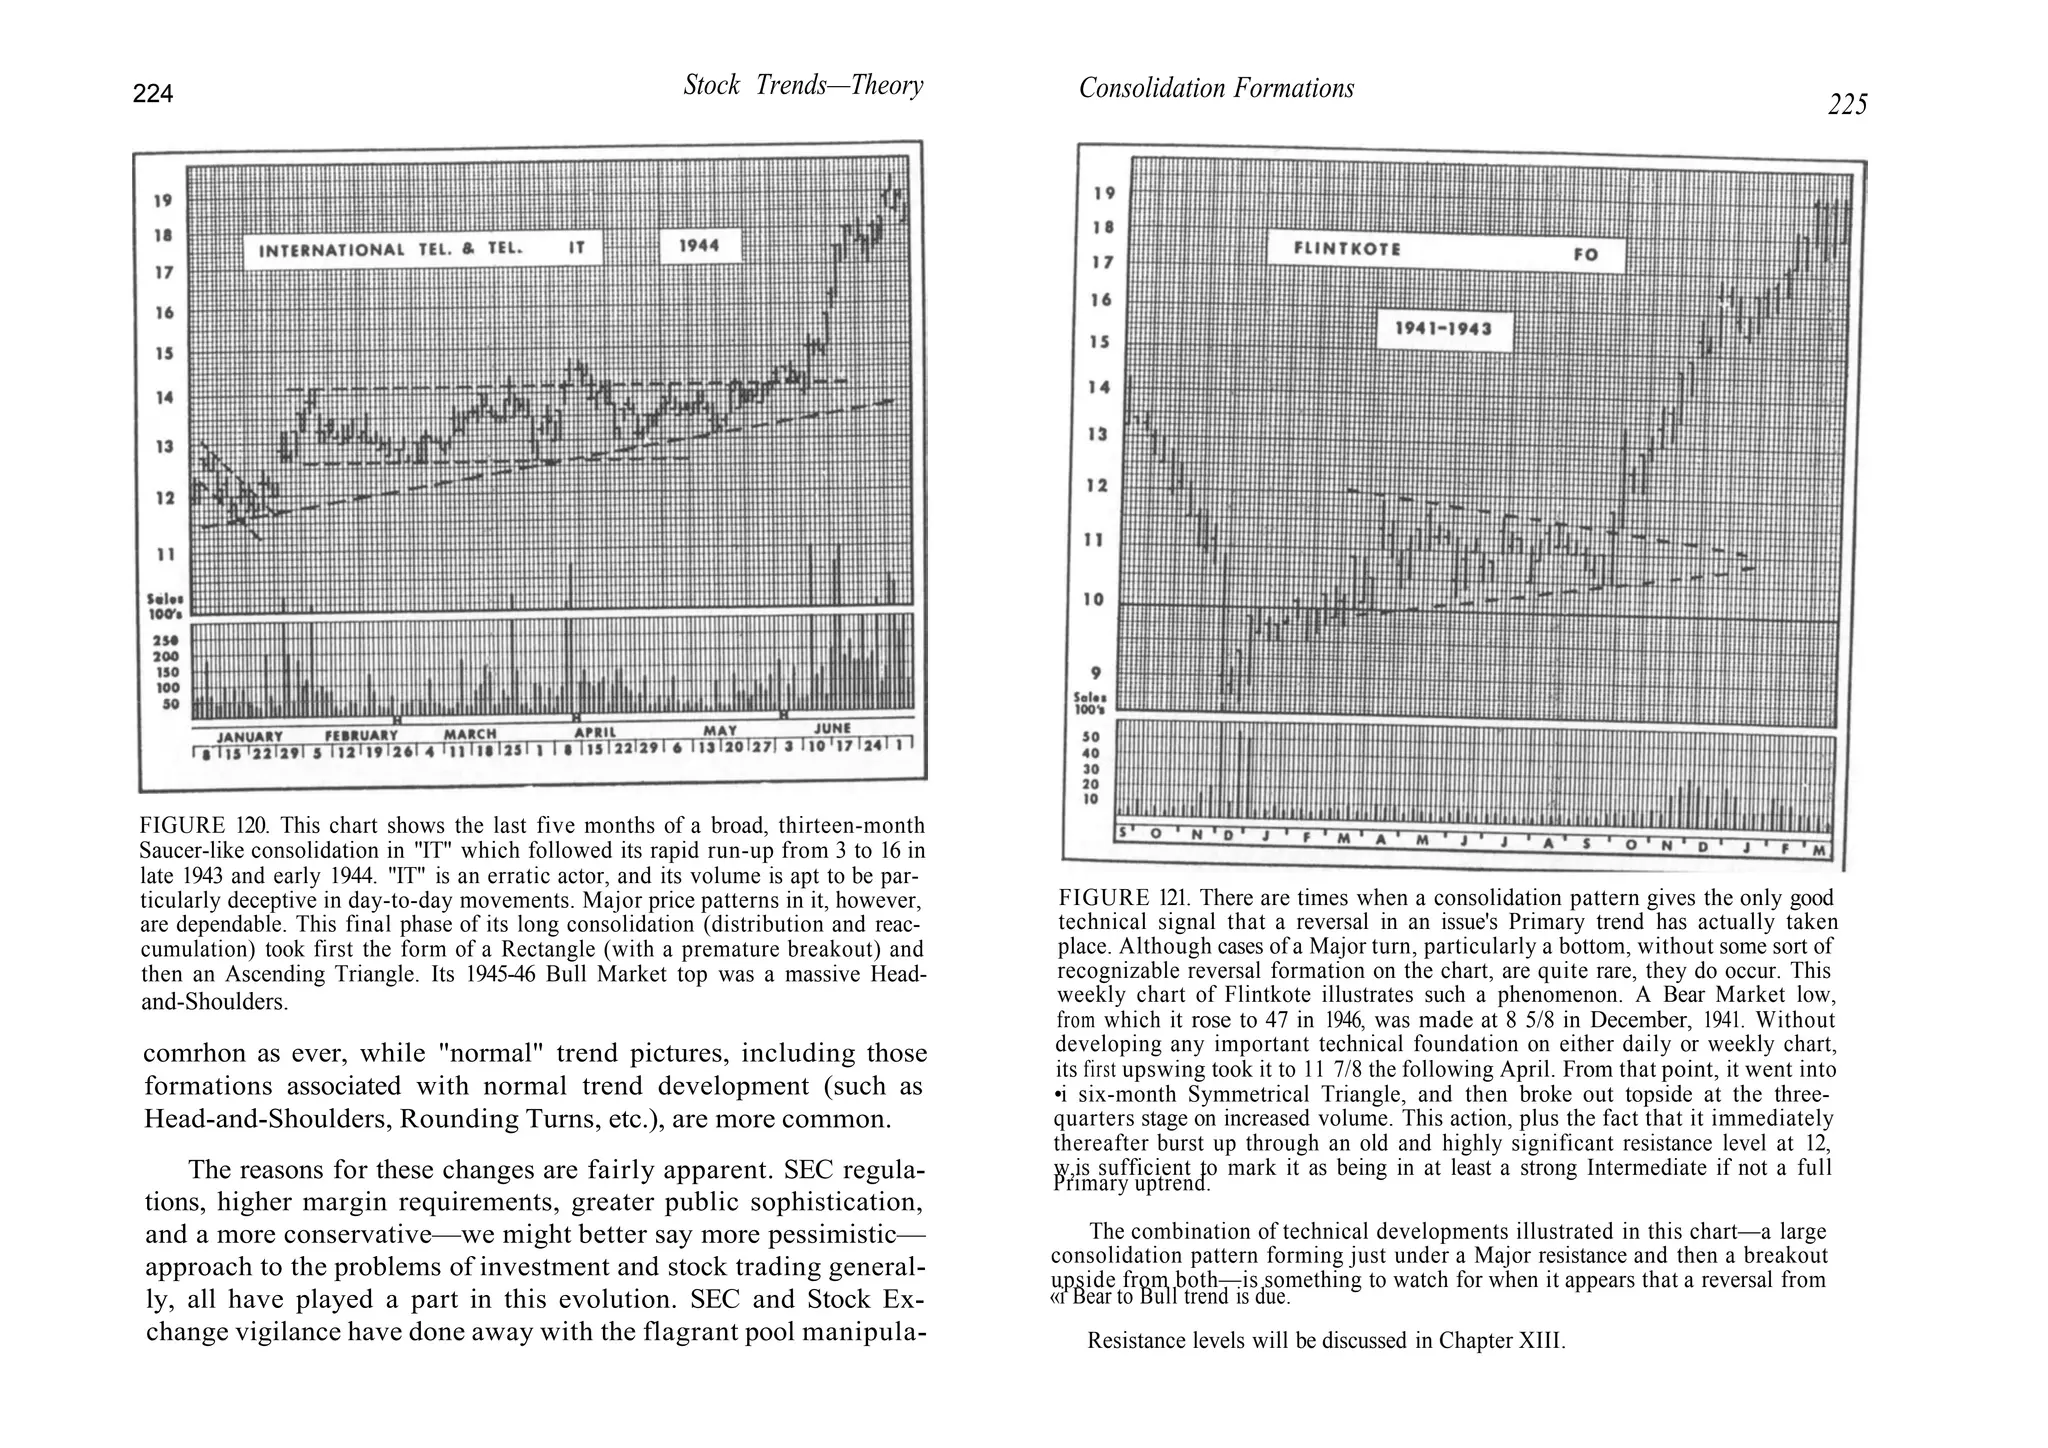
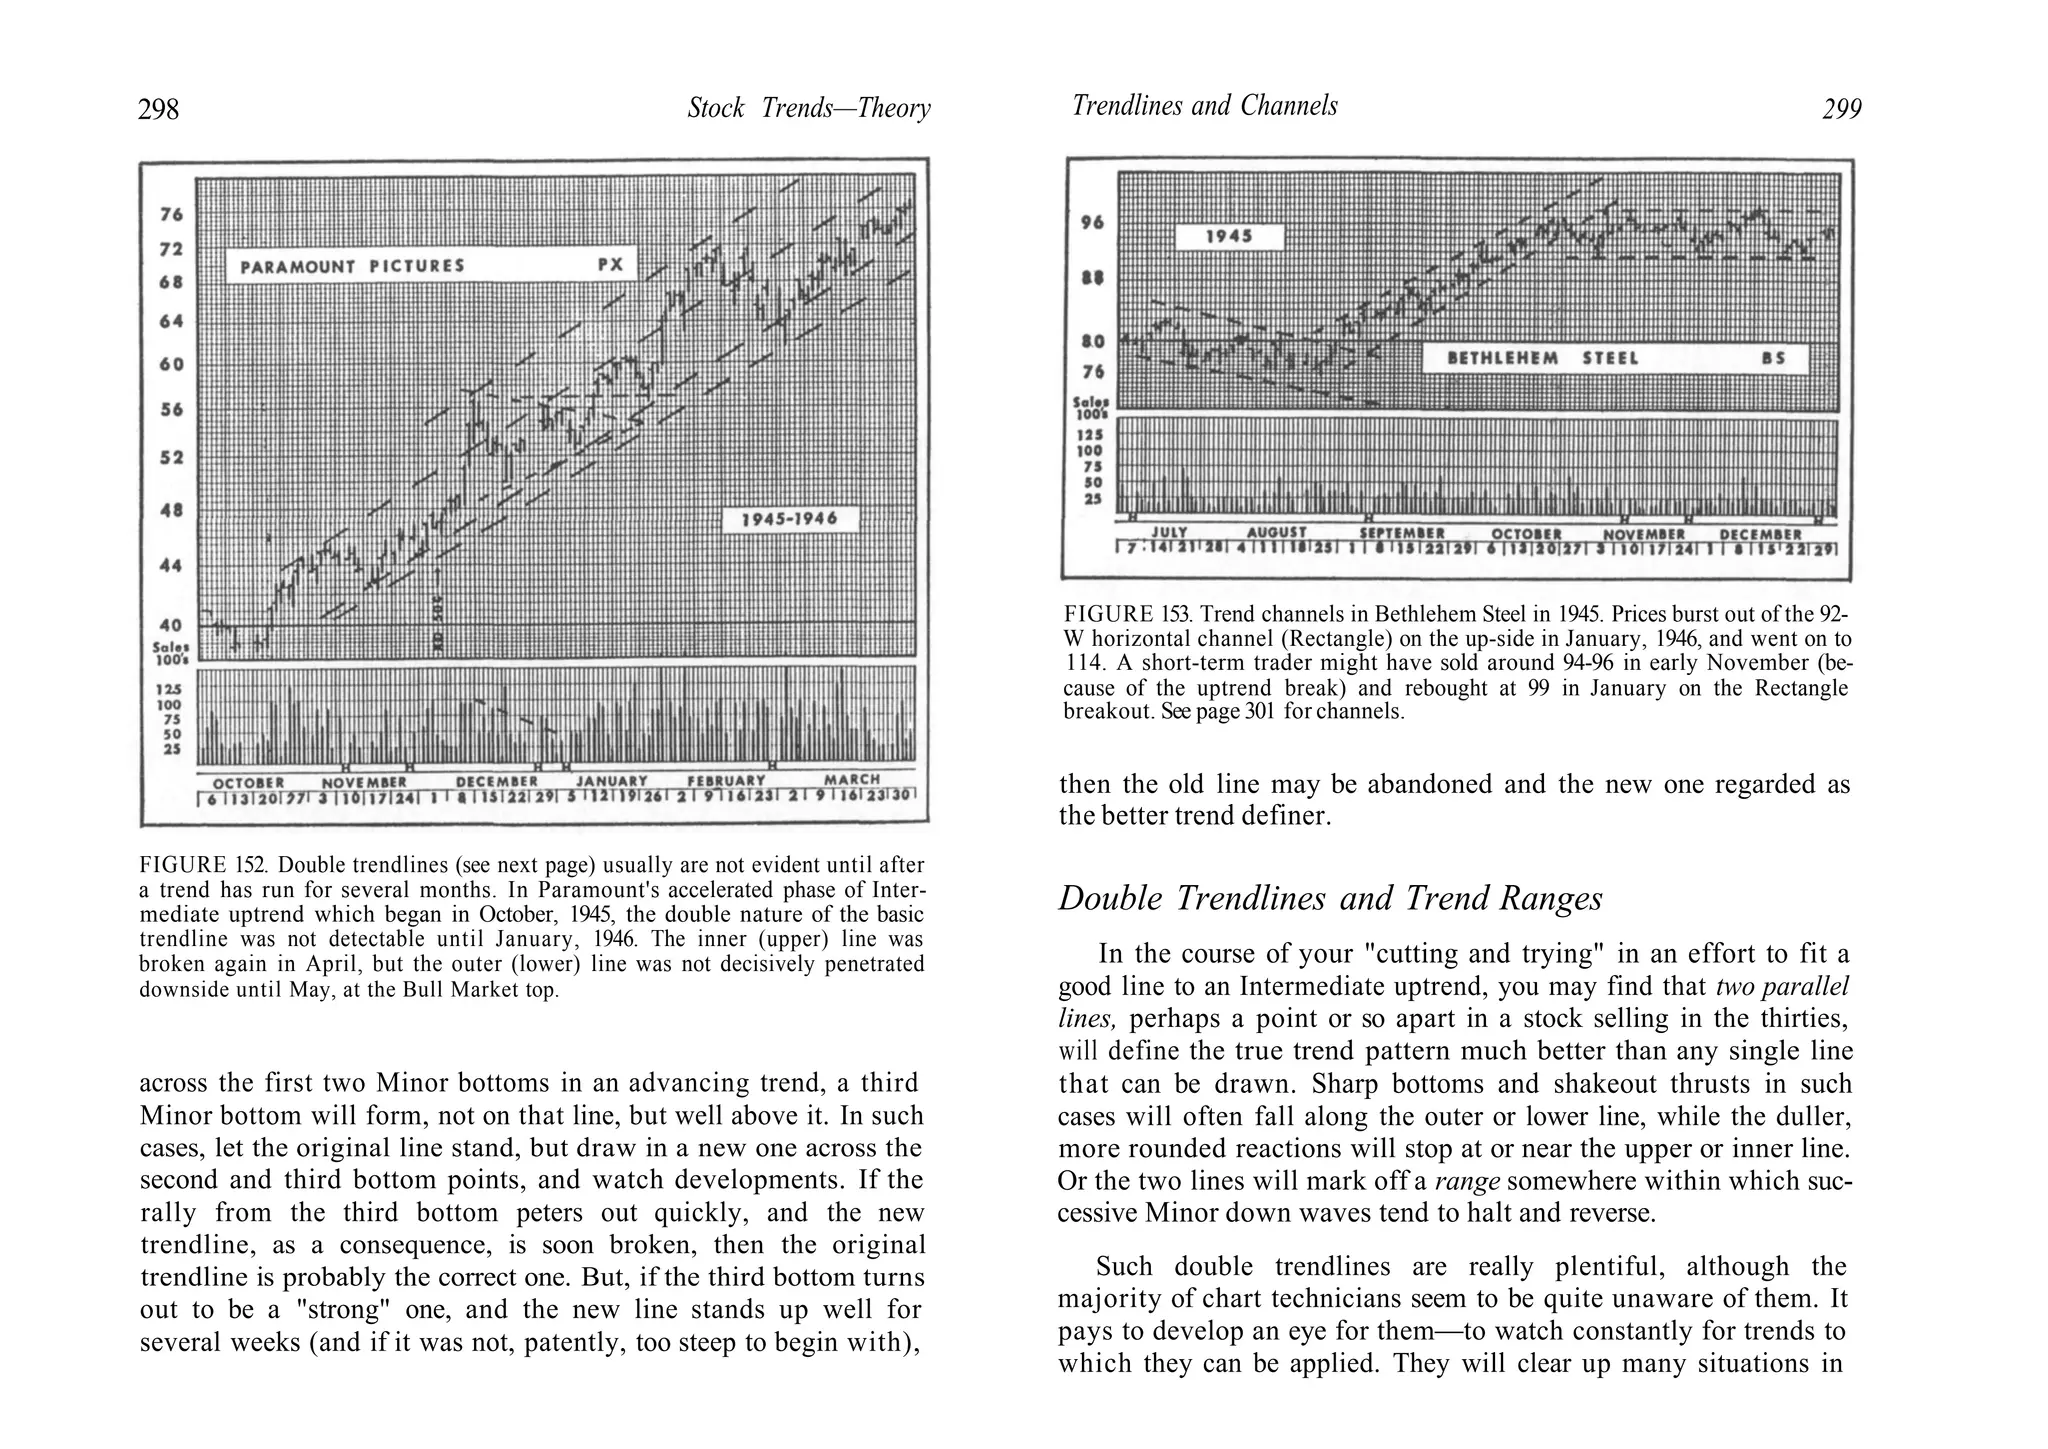
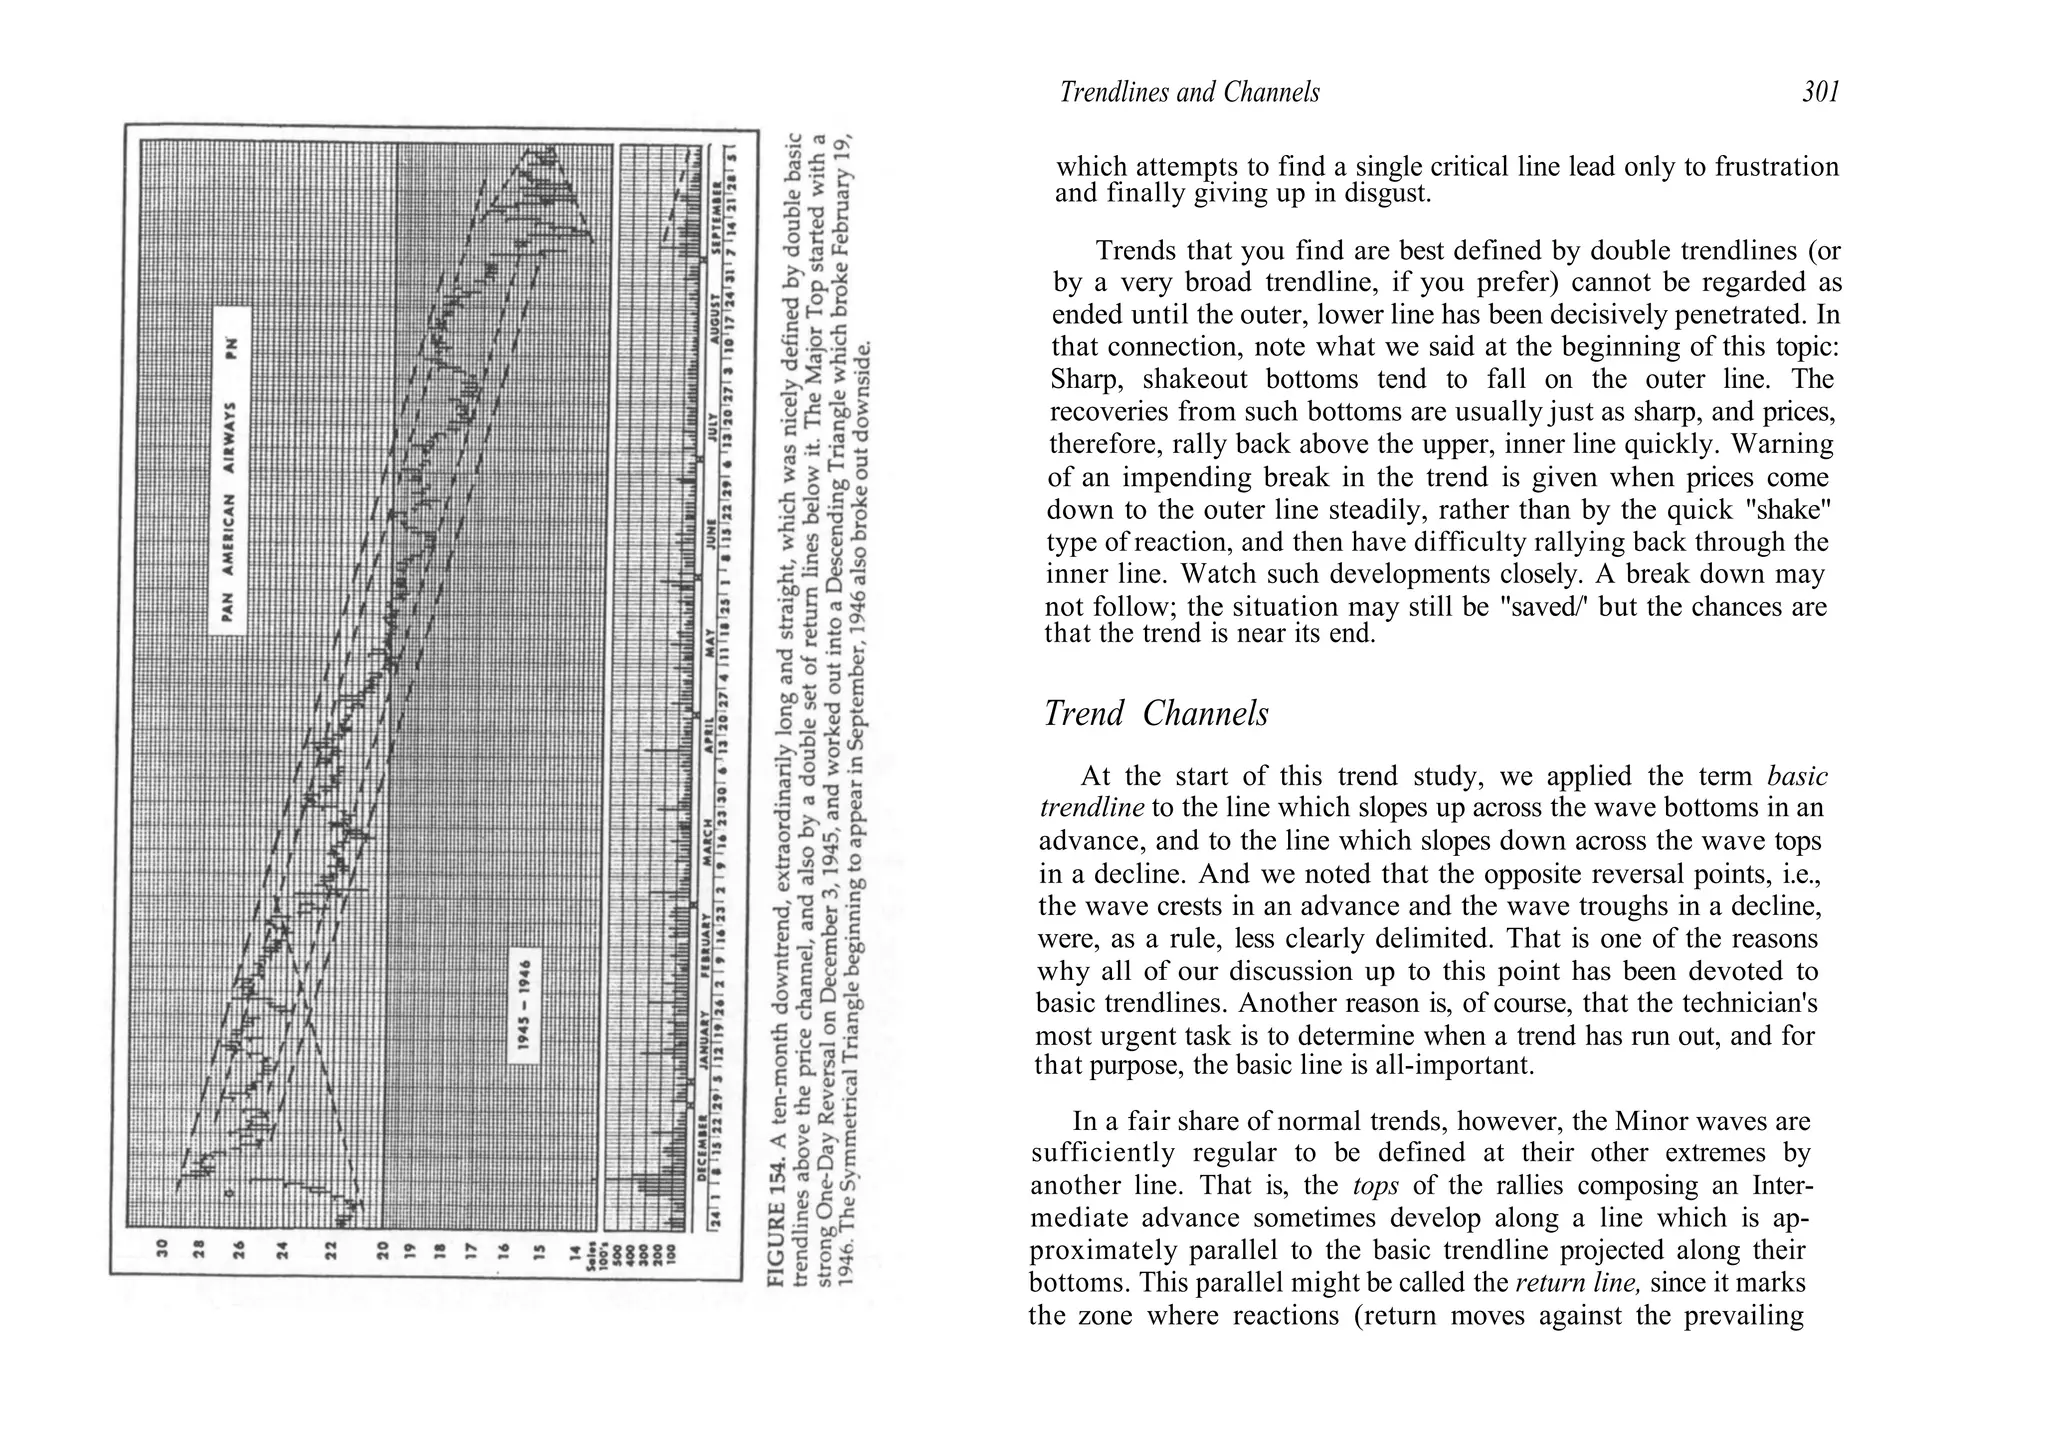
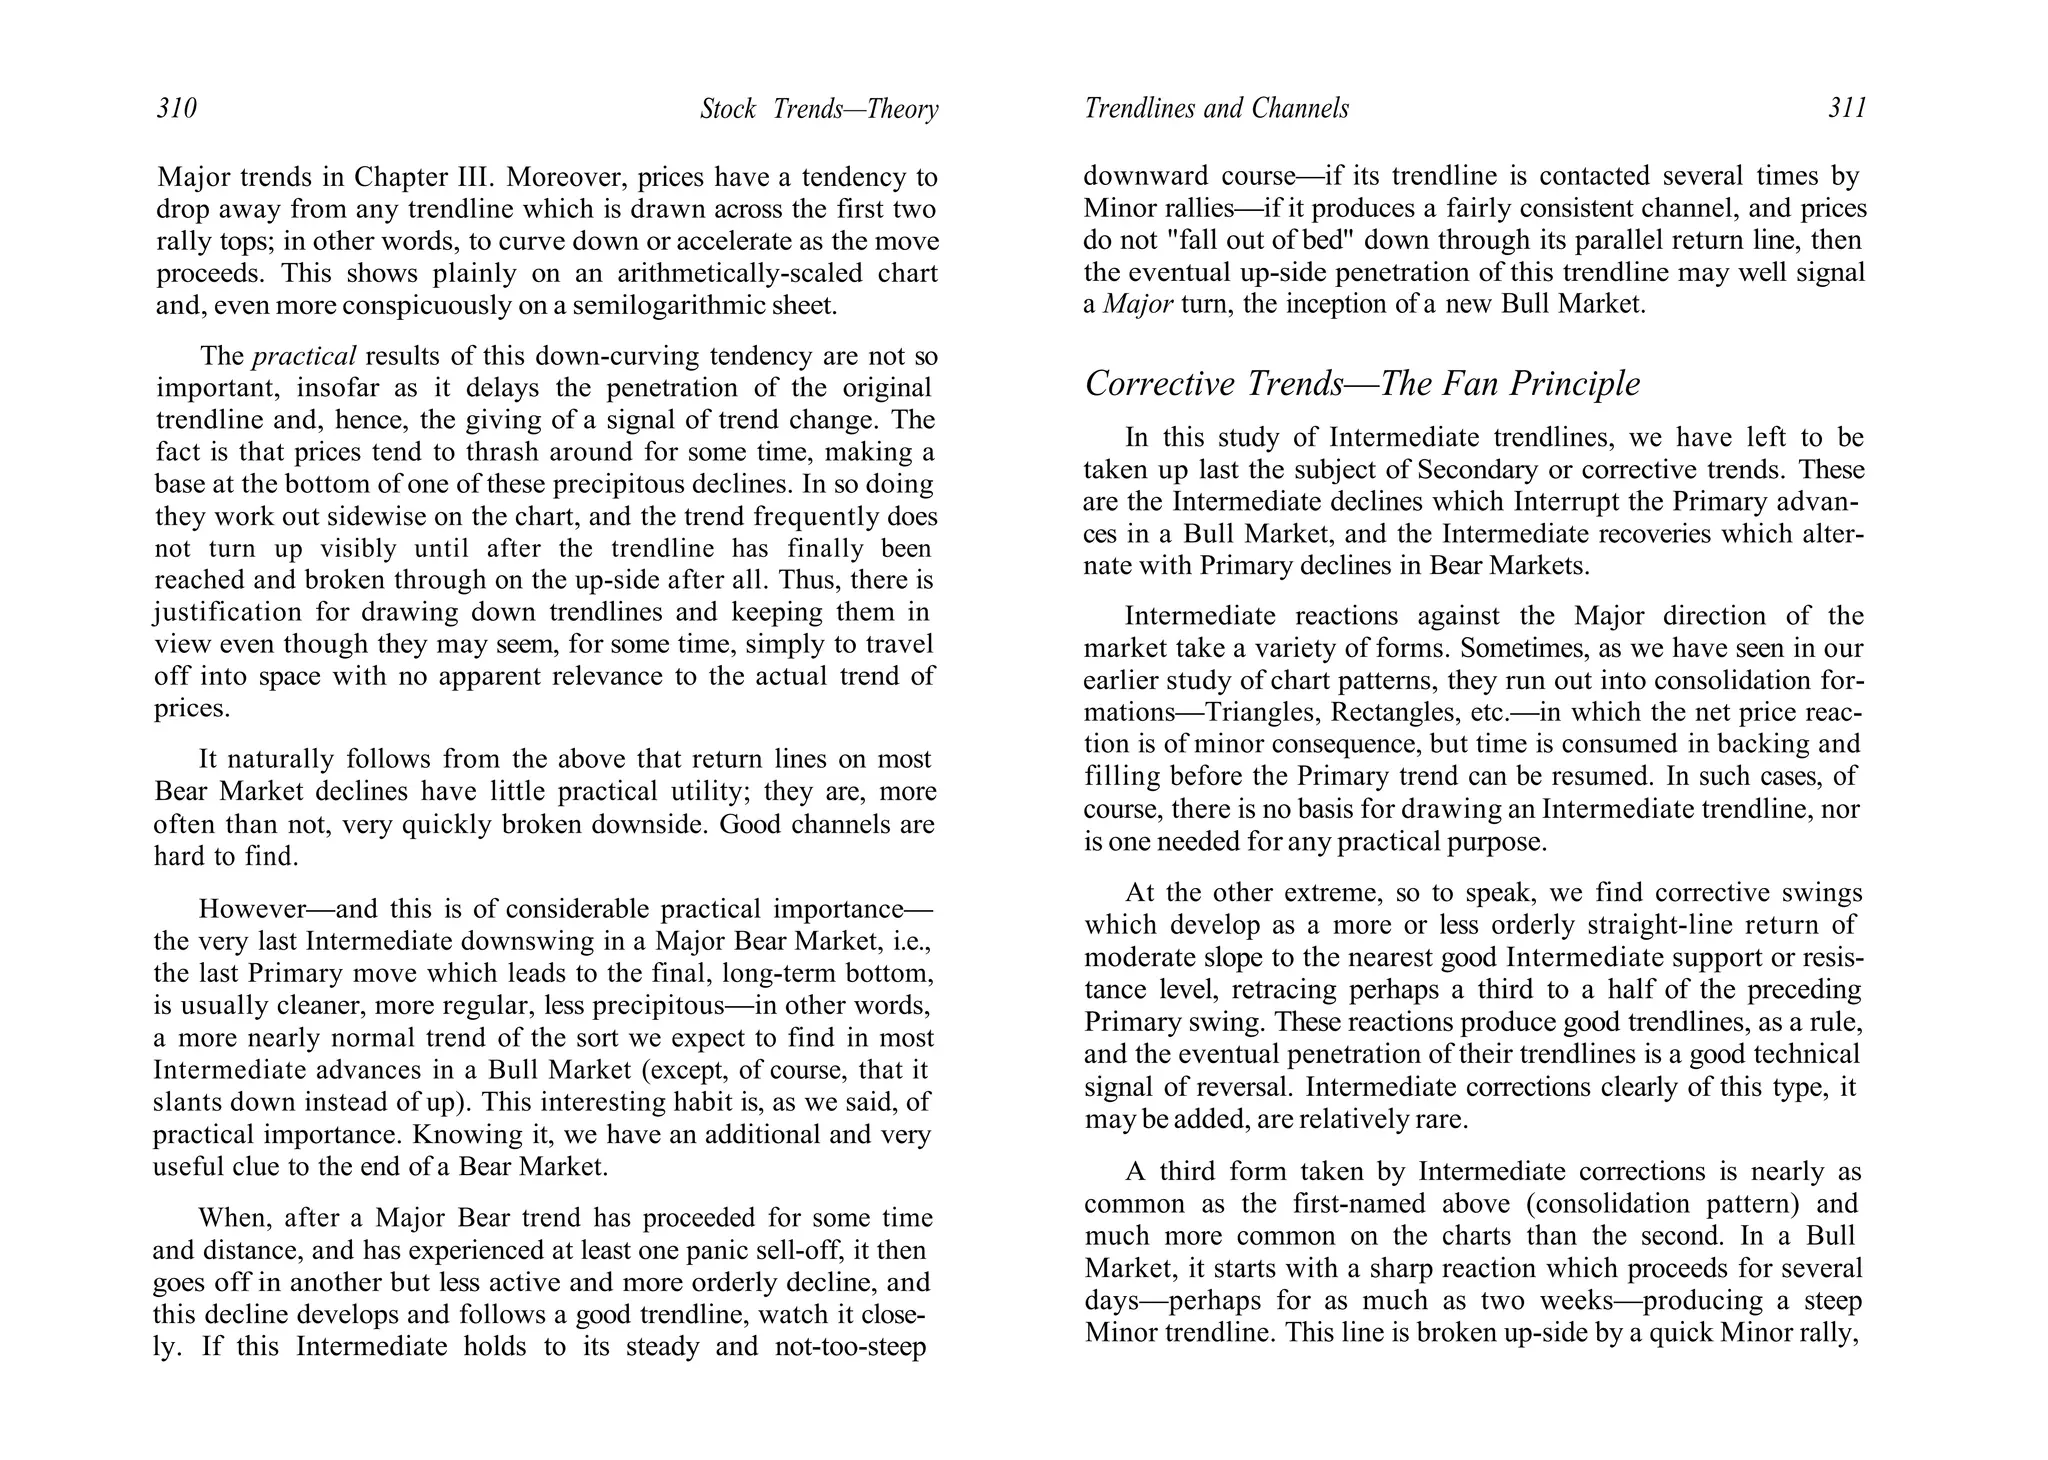
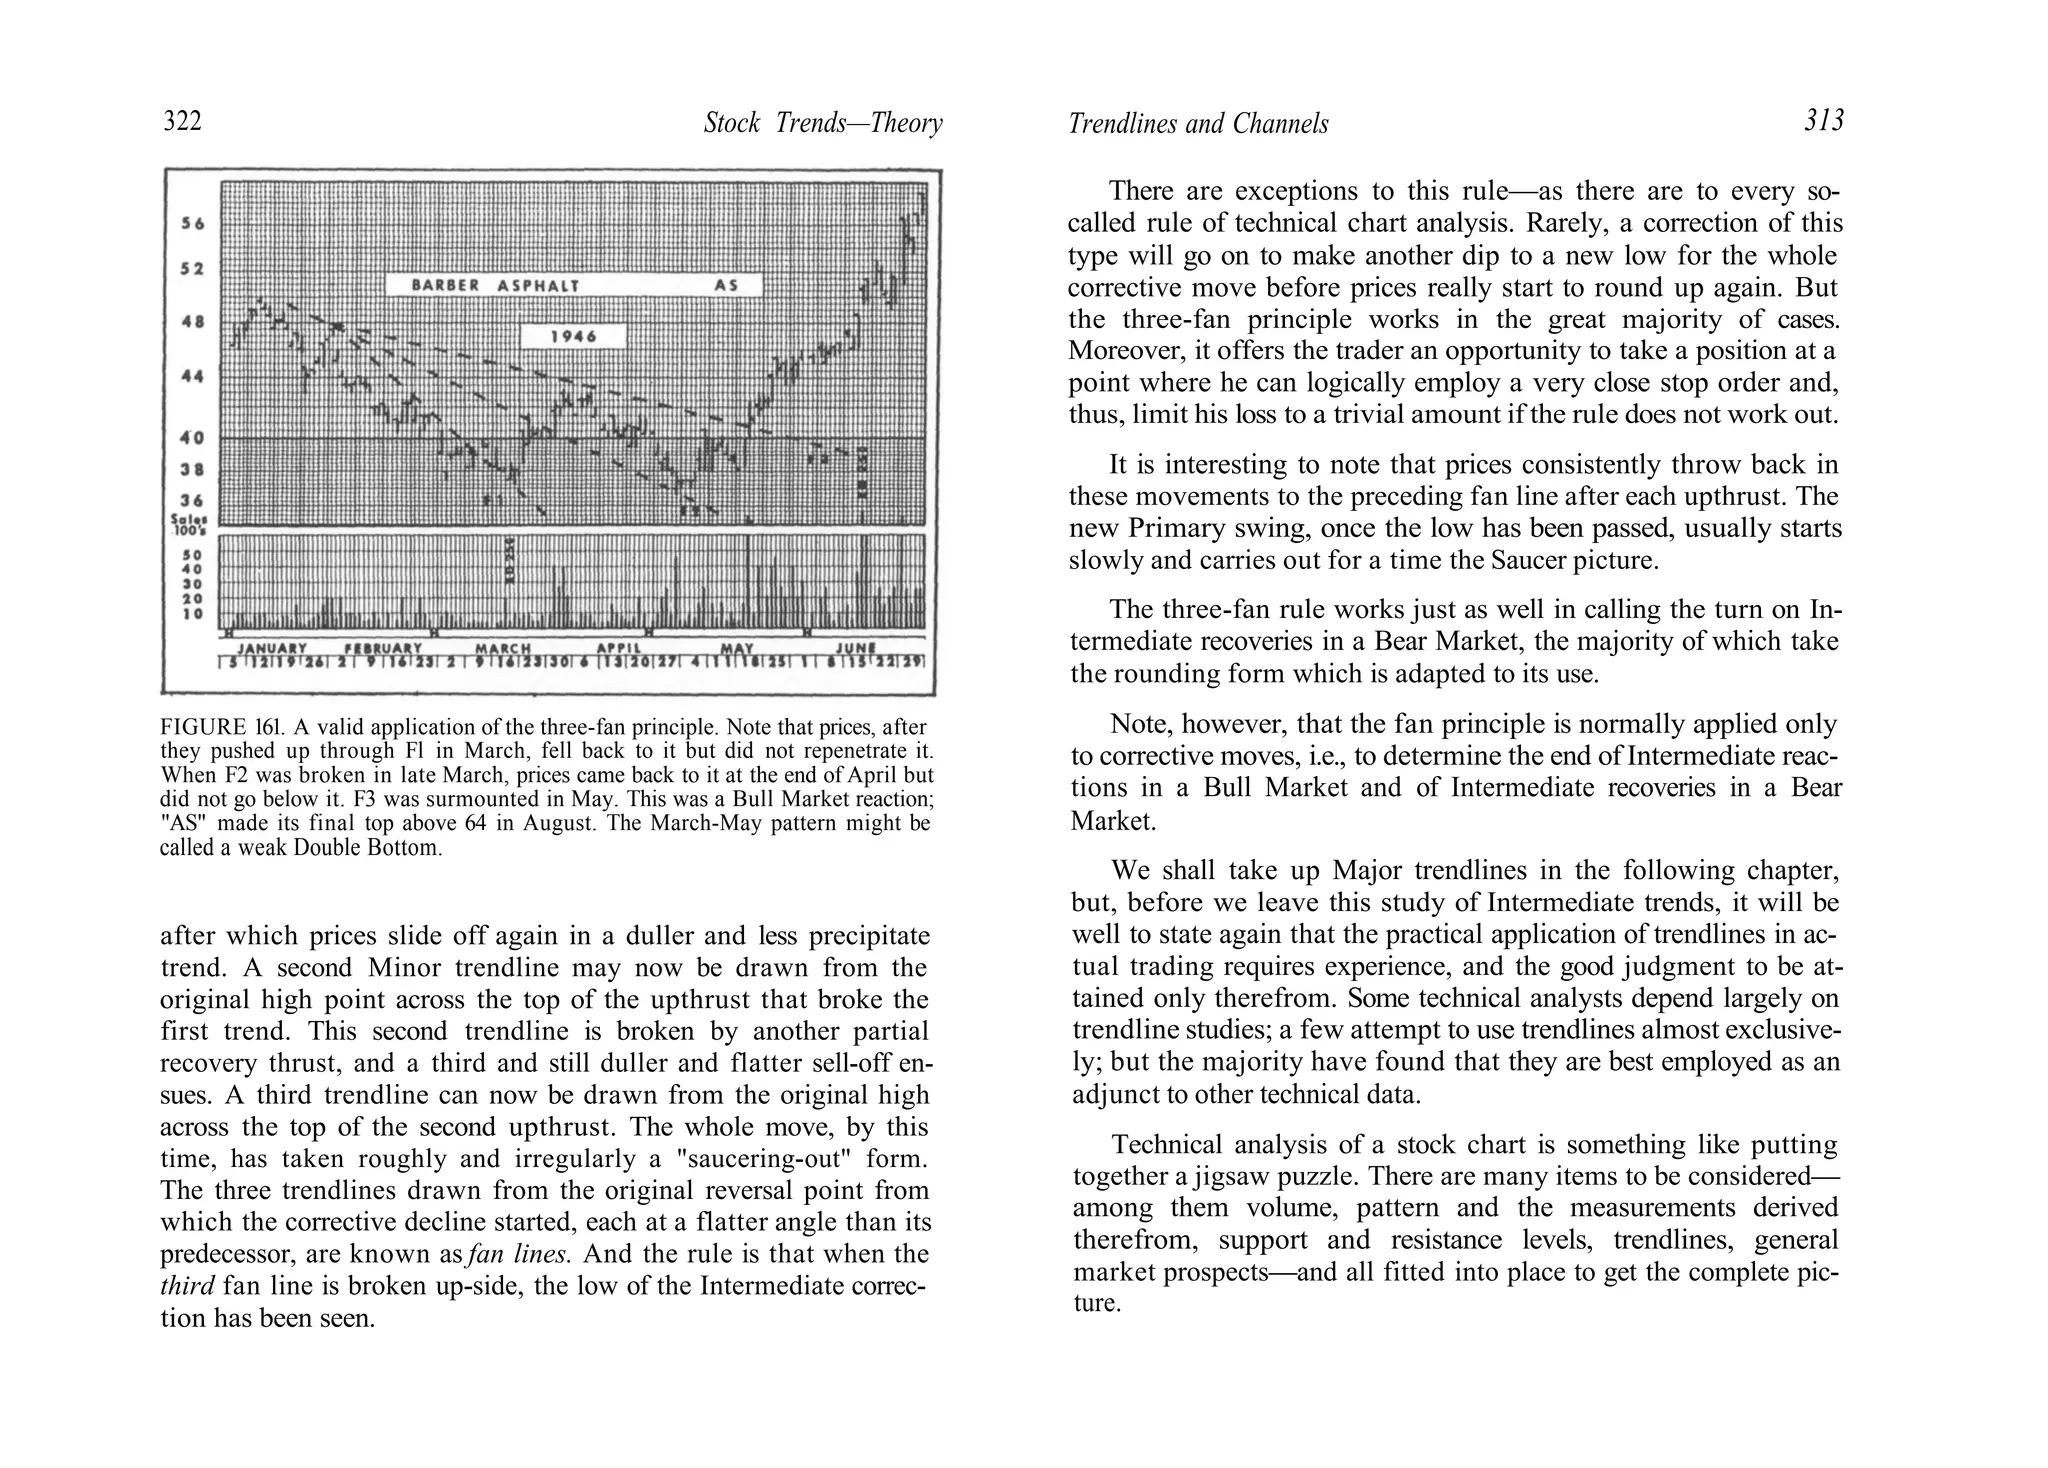
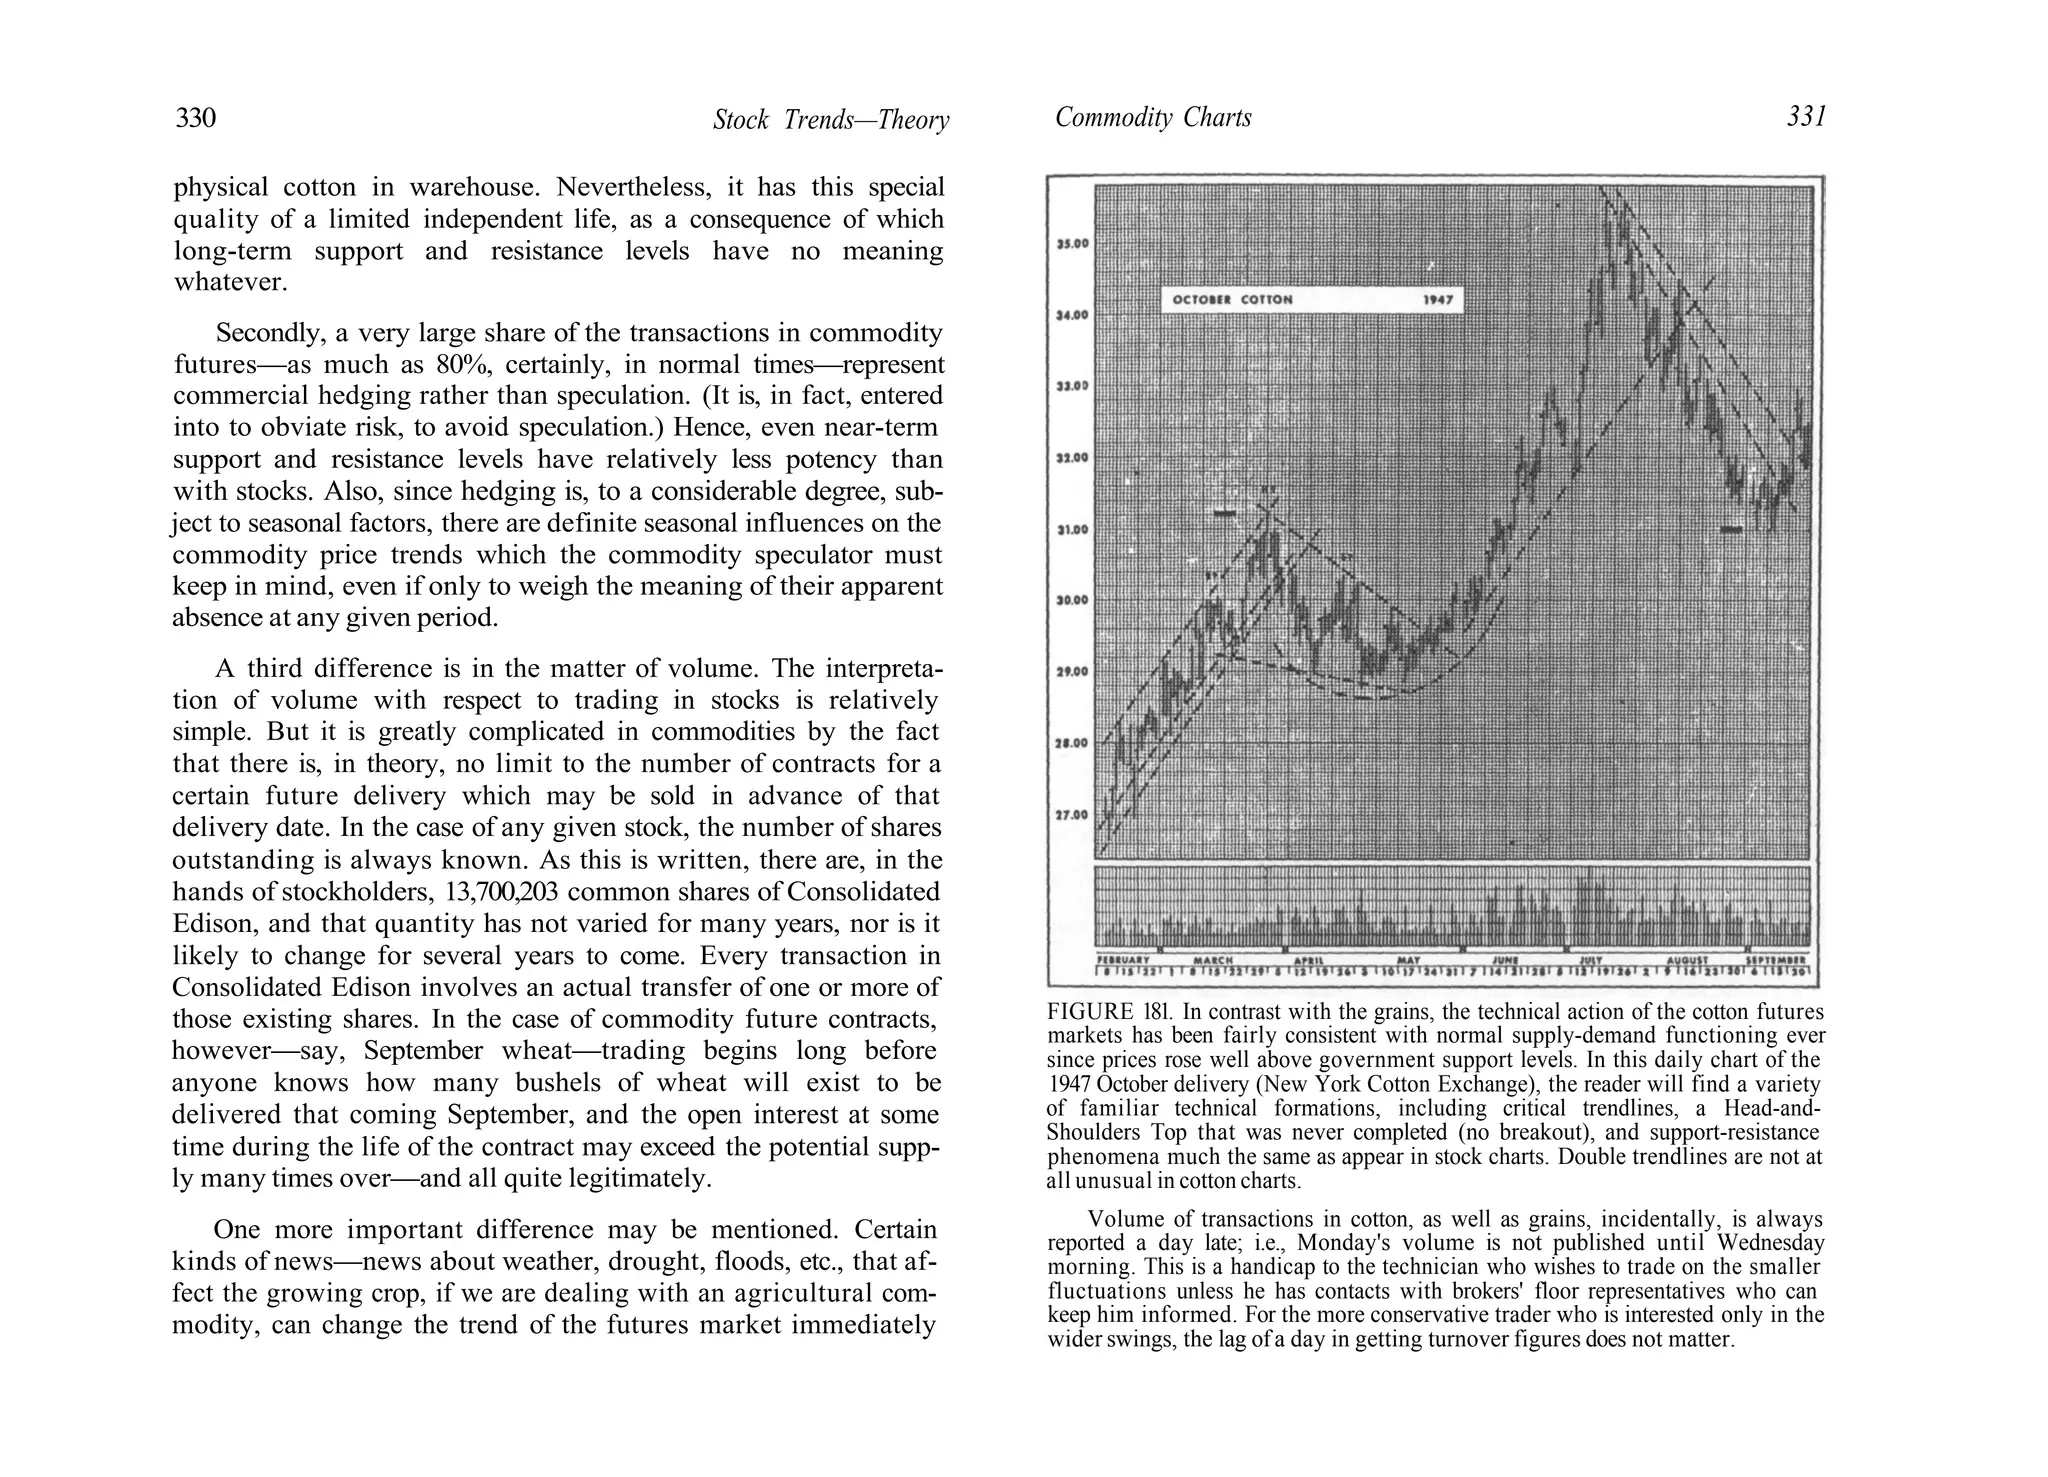
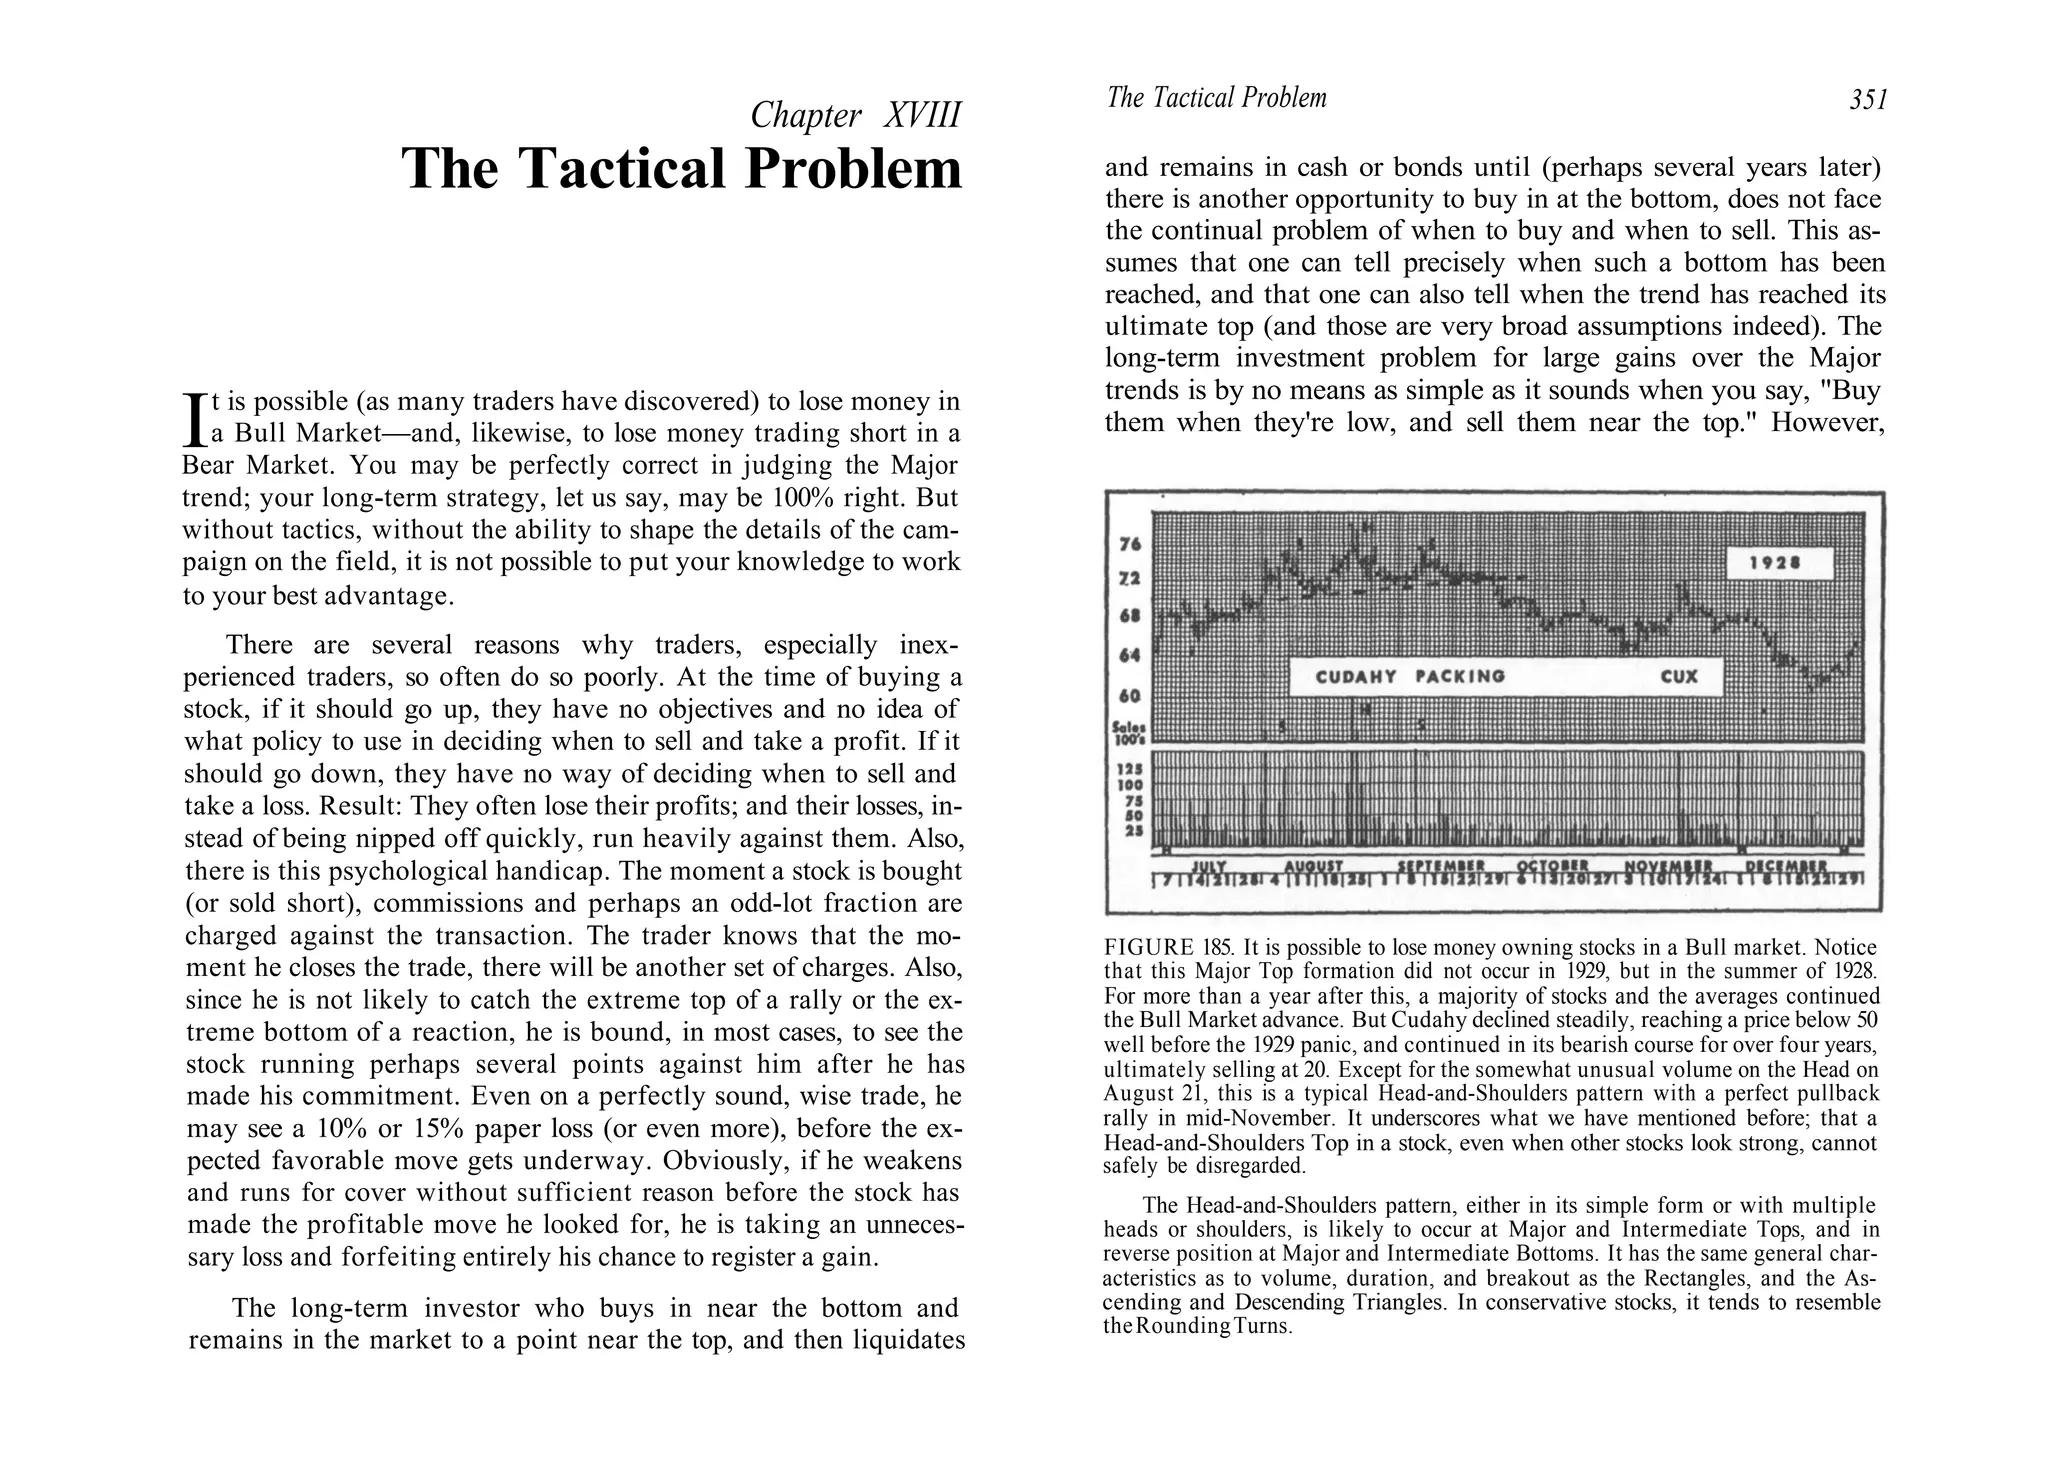
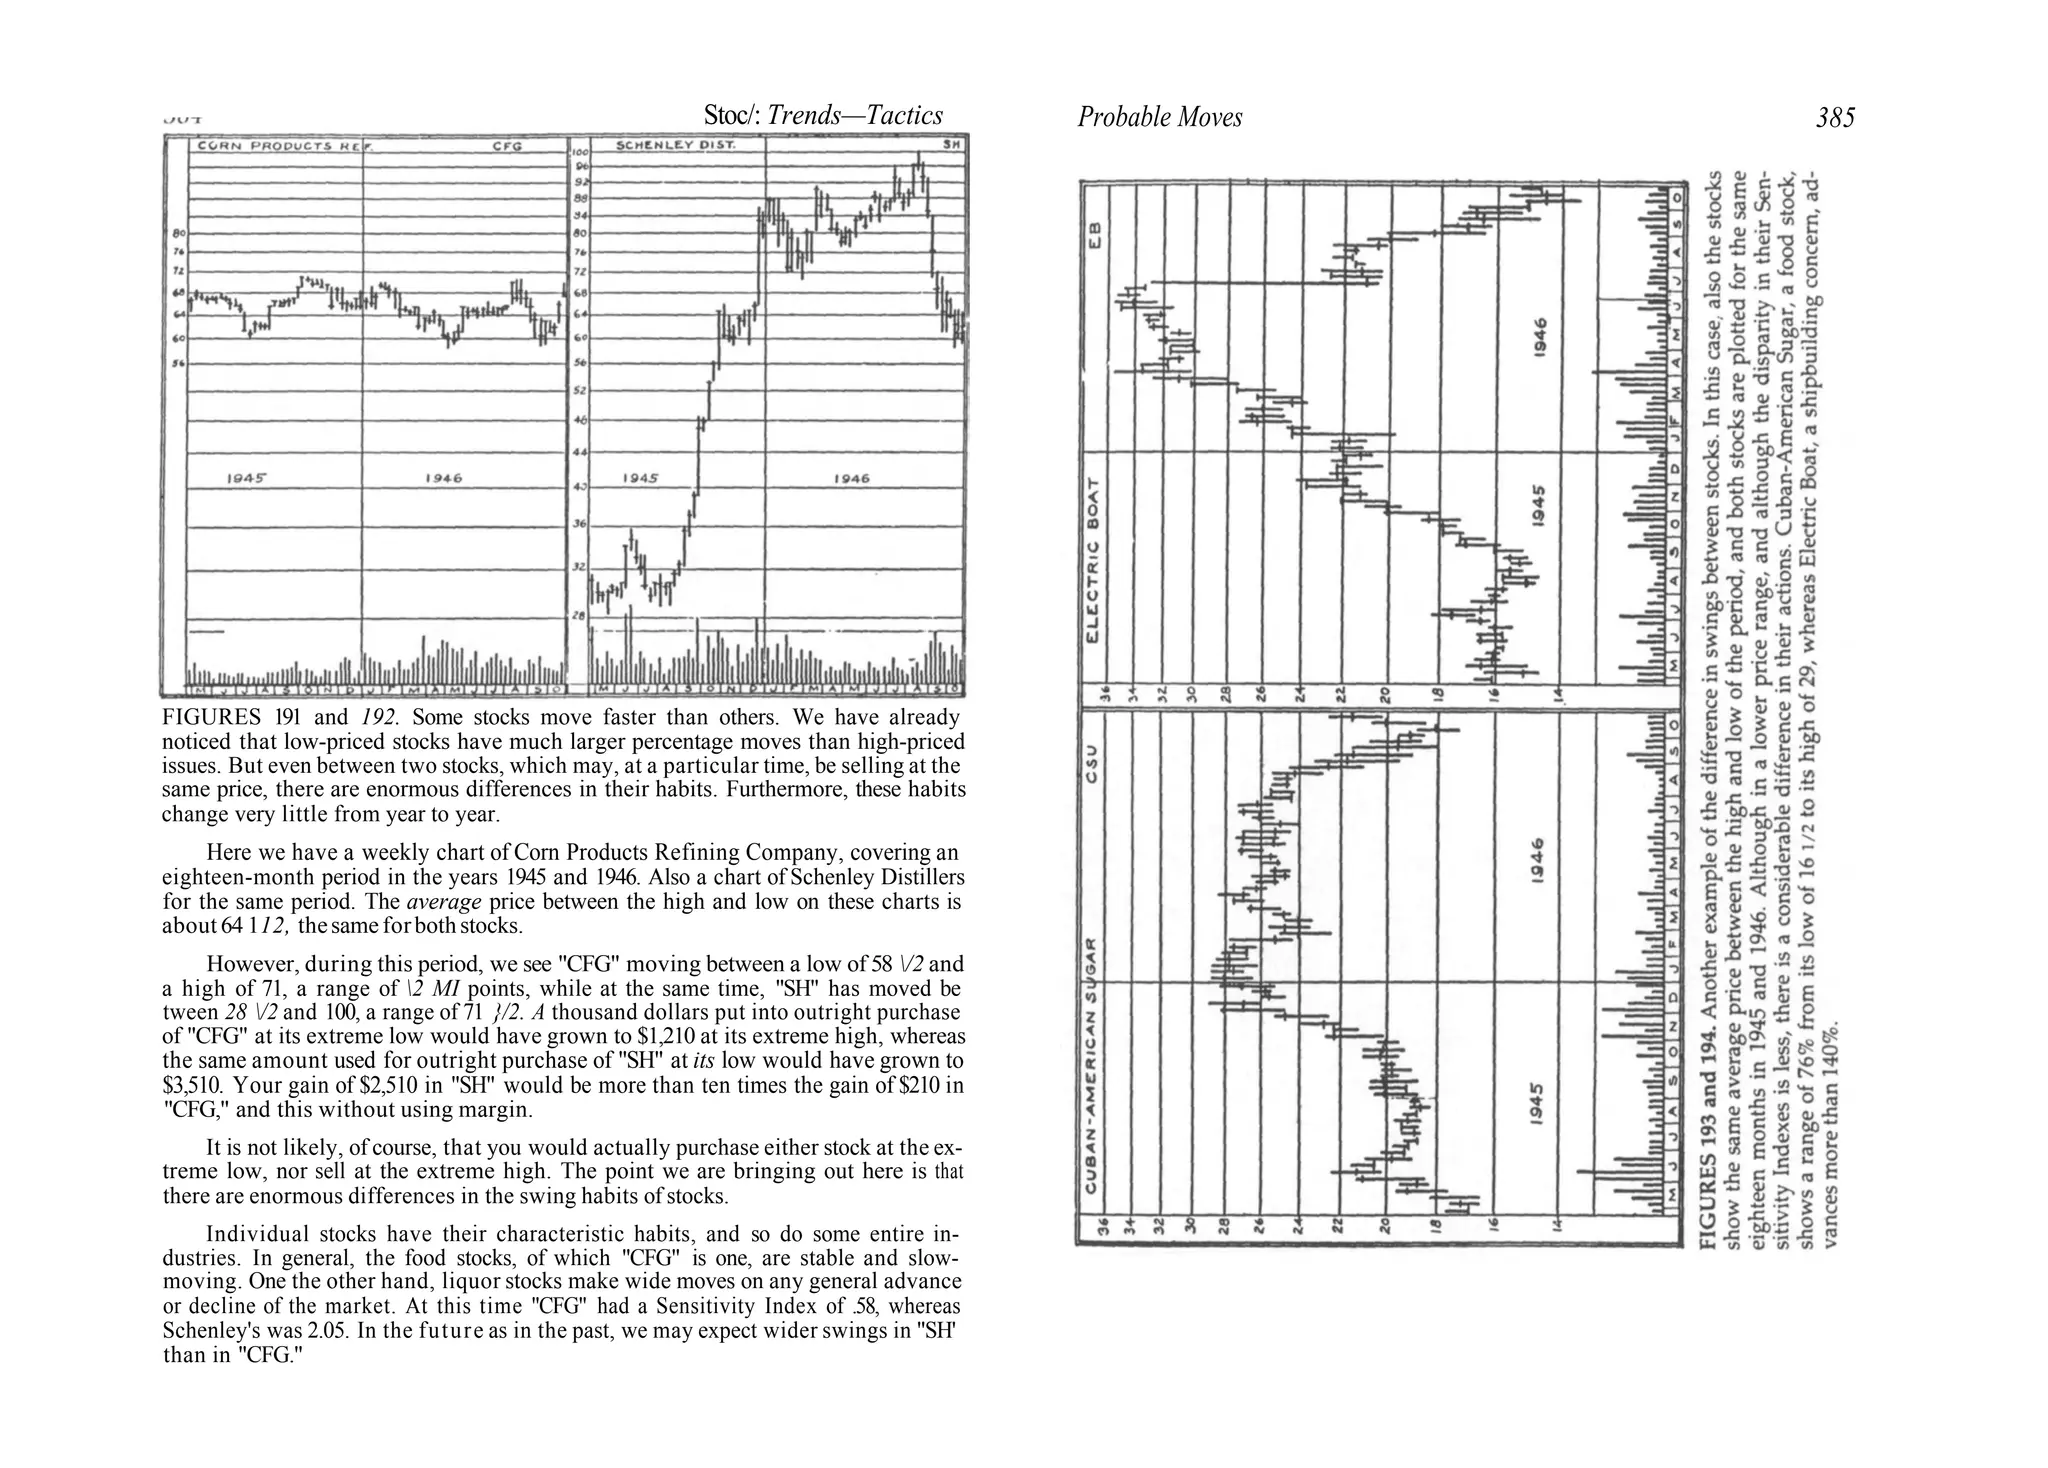
This document discusses stock charts and technical analysis. It describes how to construct basic daily stock charts using high, low, closing price and volume data from financial newspapers. Different types of charts and scales are discussed, with a recommendation to use semilogarithmic scales which show percentage changes rather than arithmetic scales which show dollar changes. The document emphasizes that charts are the primary tools of technical analysts to identify patterns in market data that may signal future stock price trends.


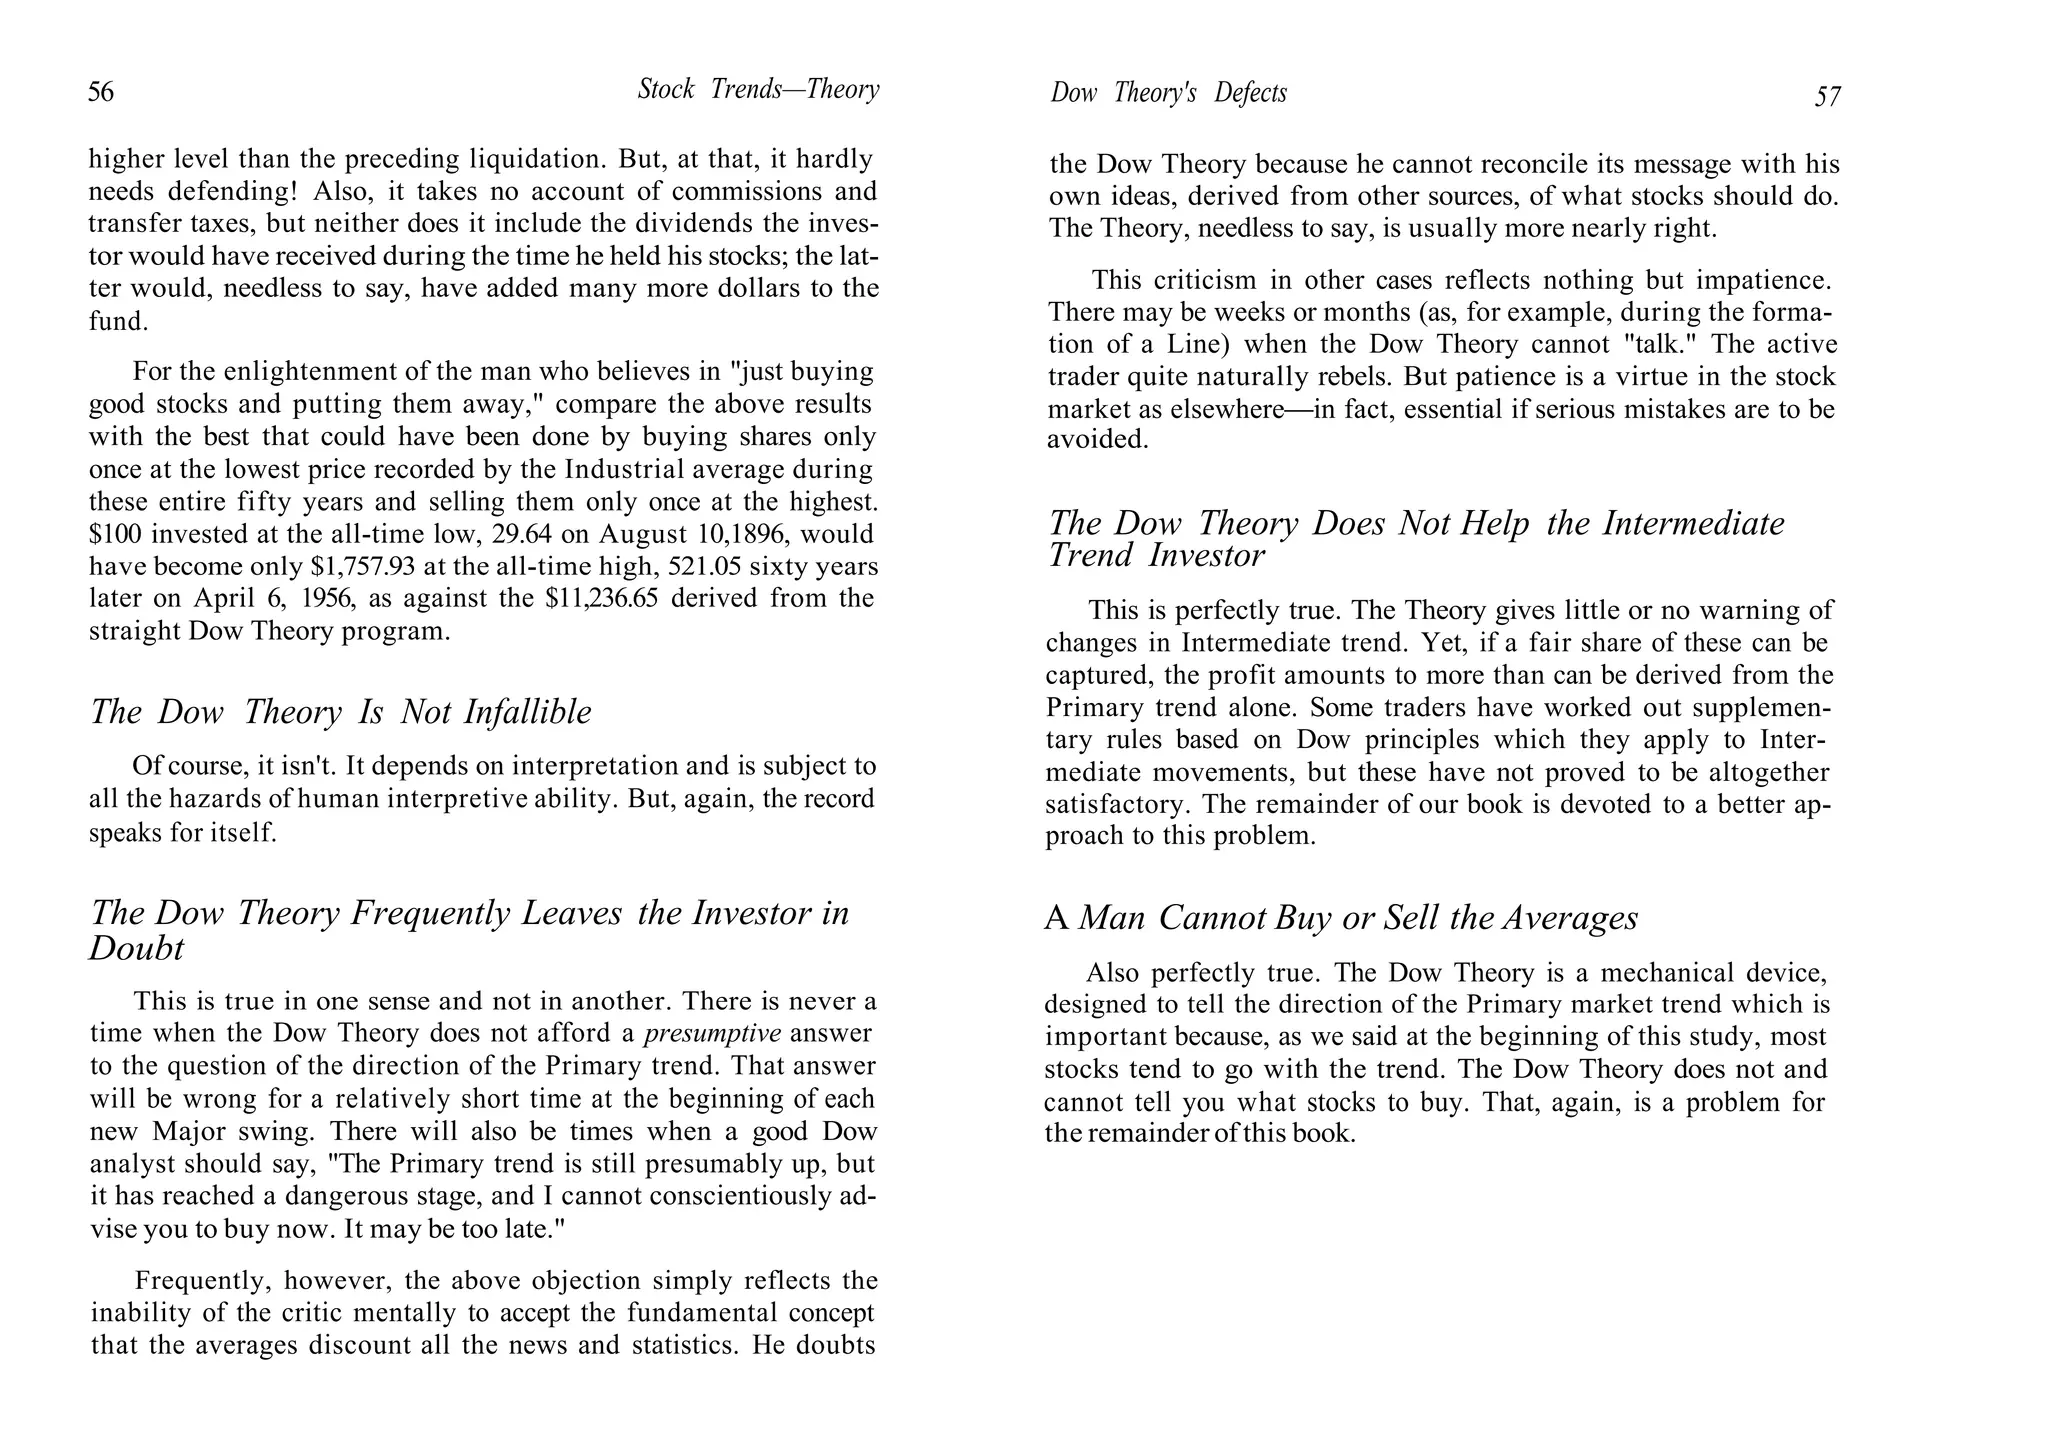


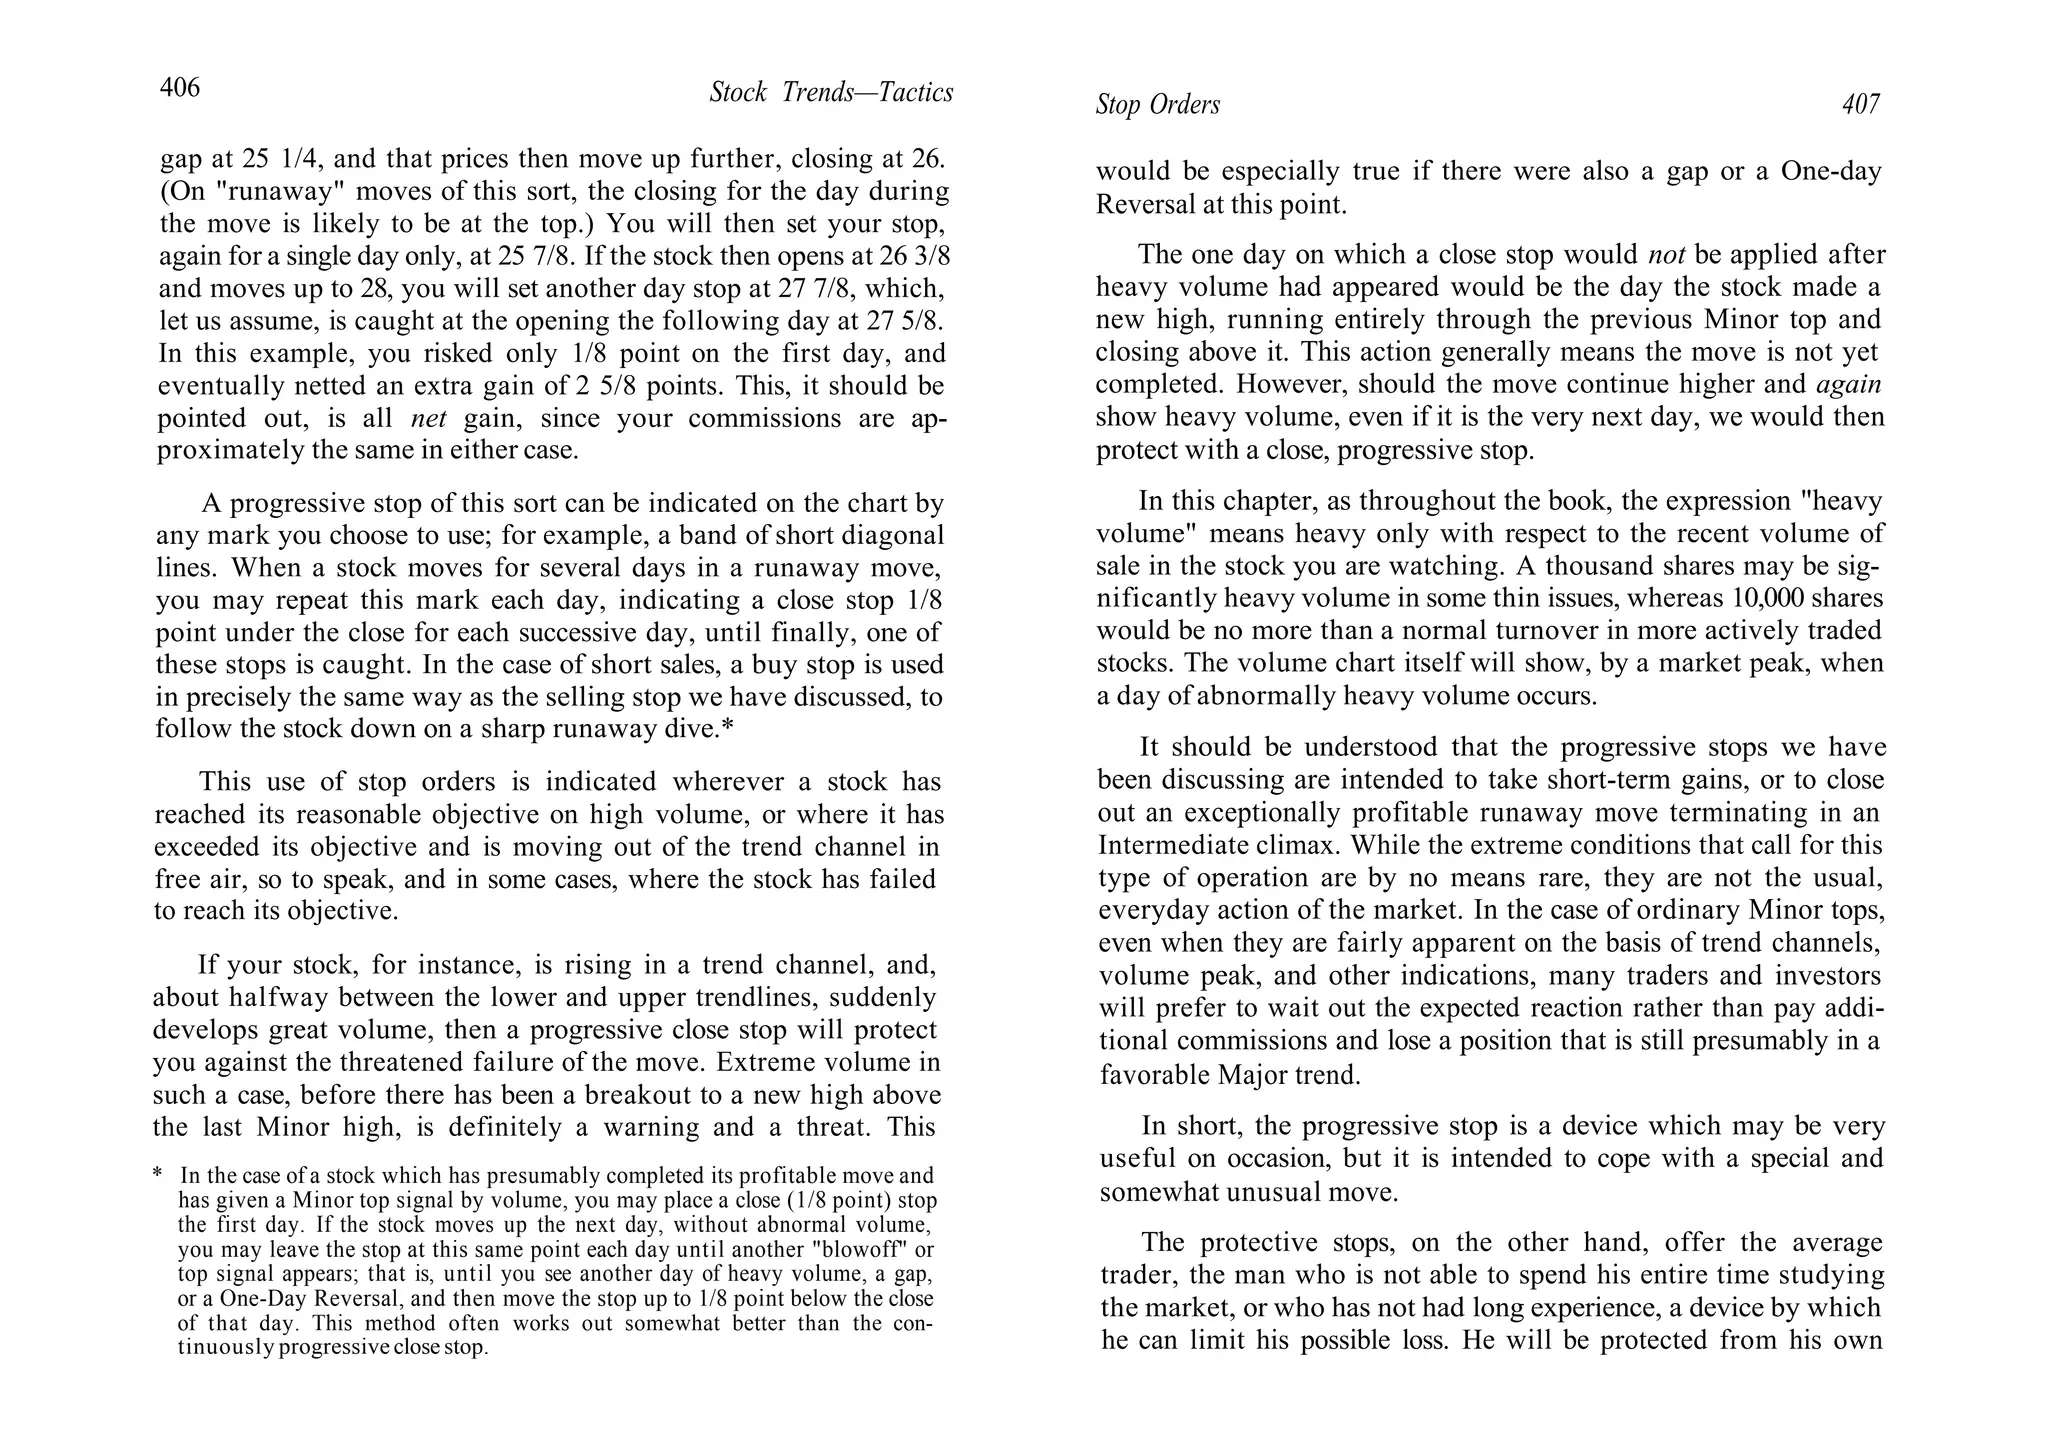


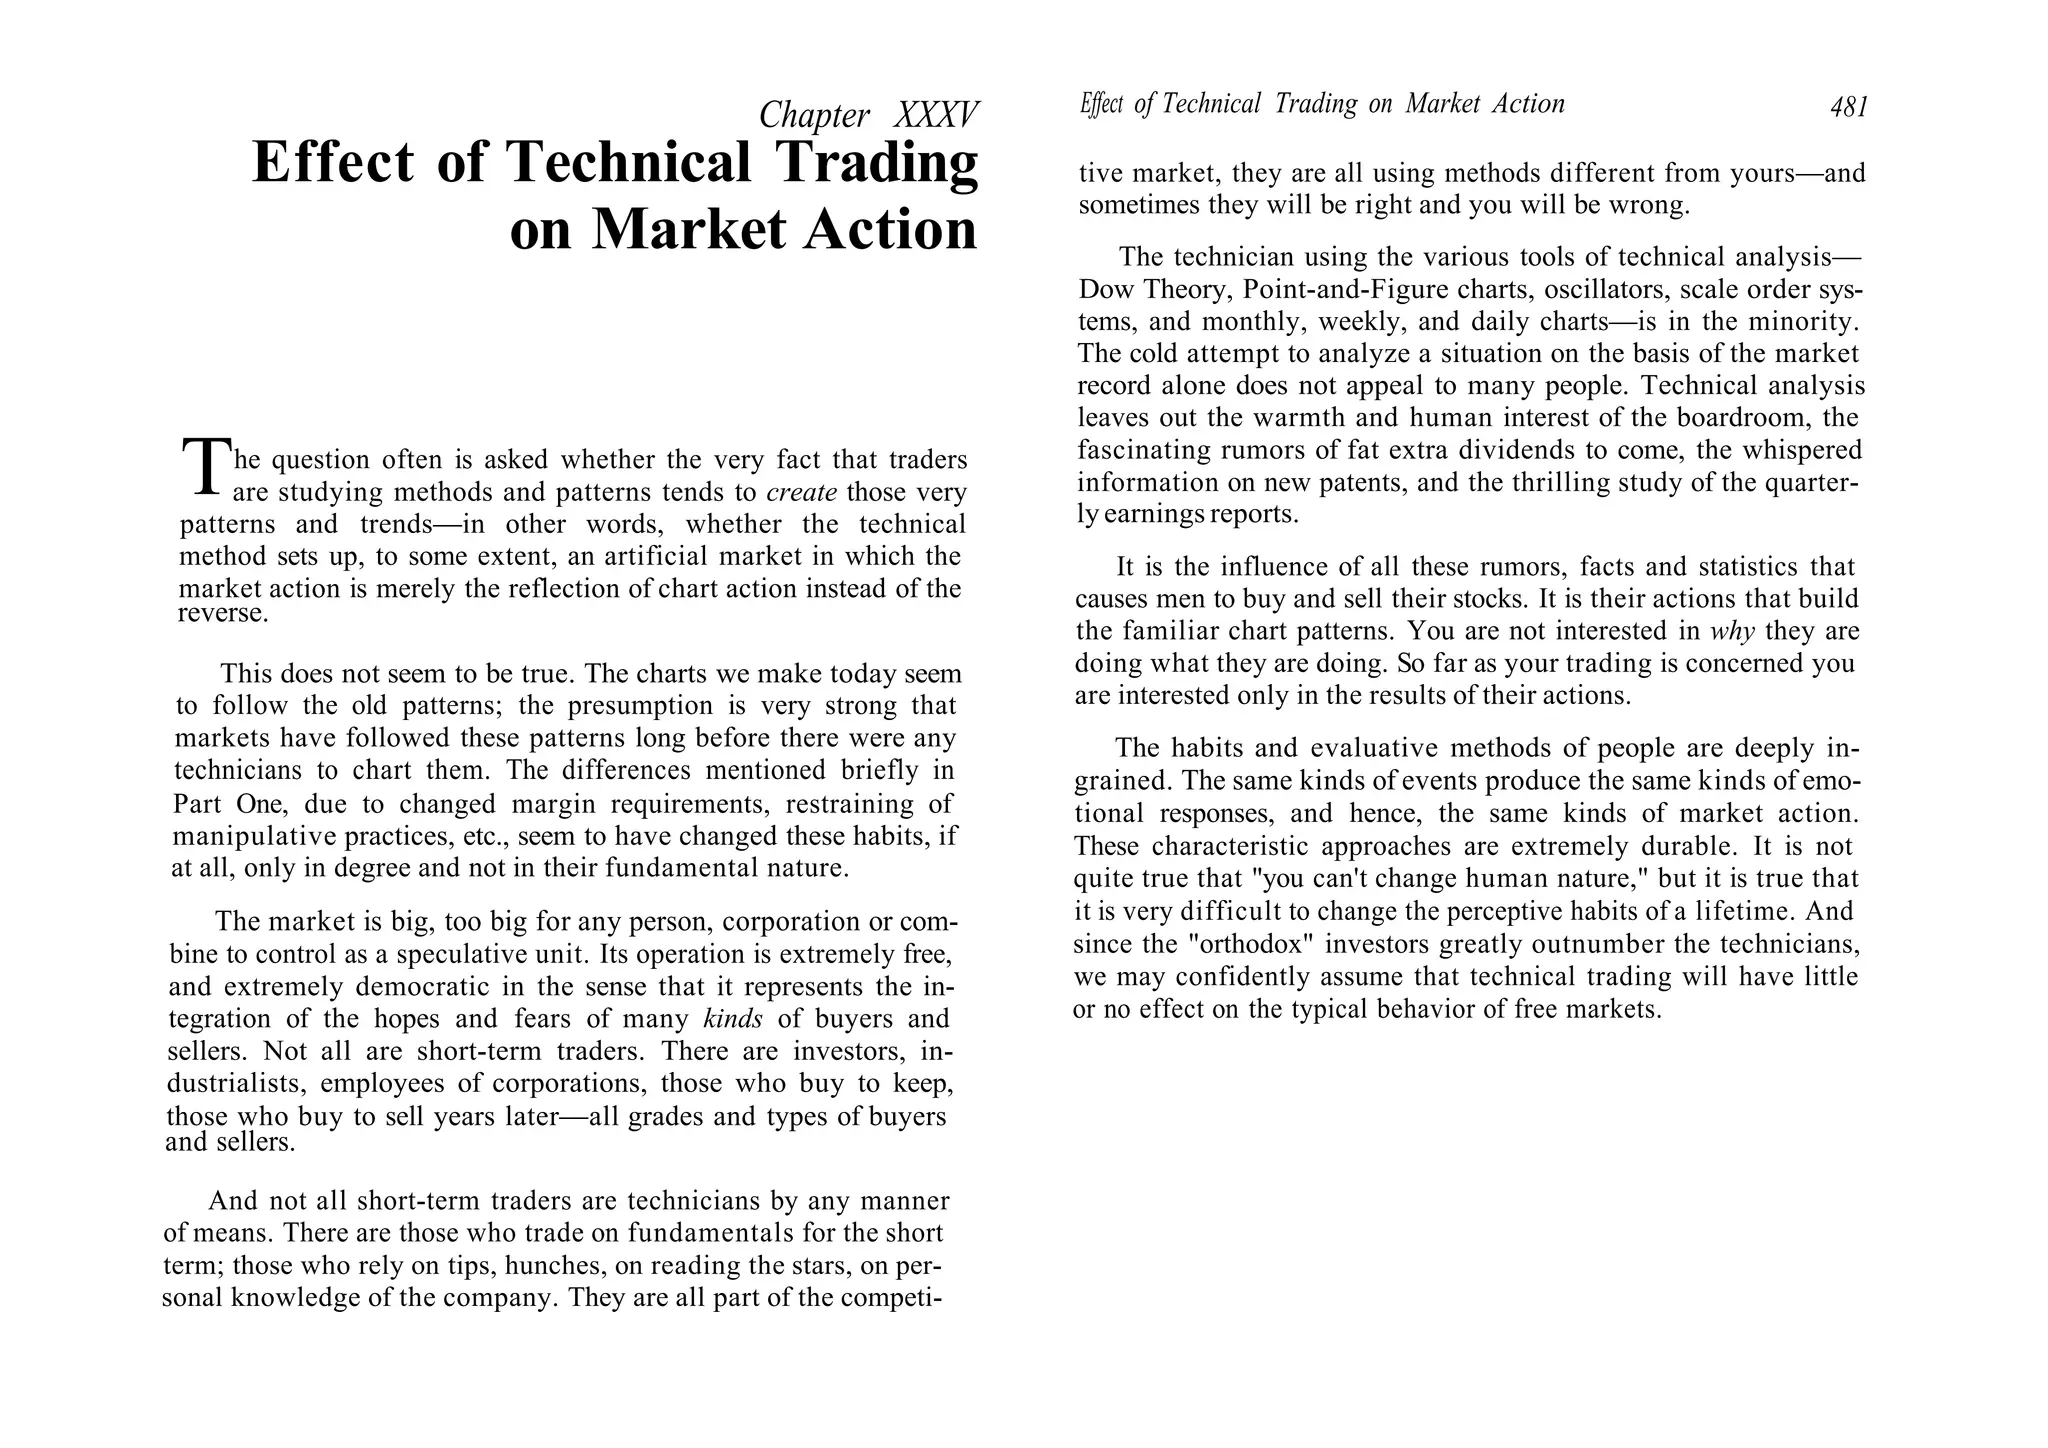
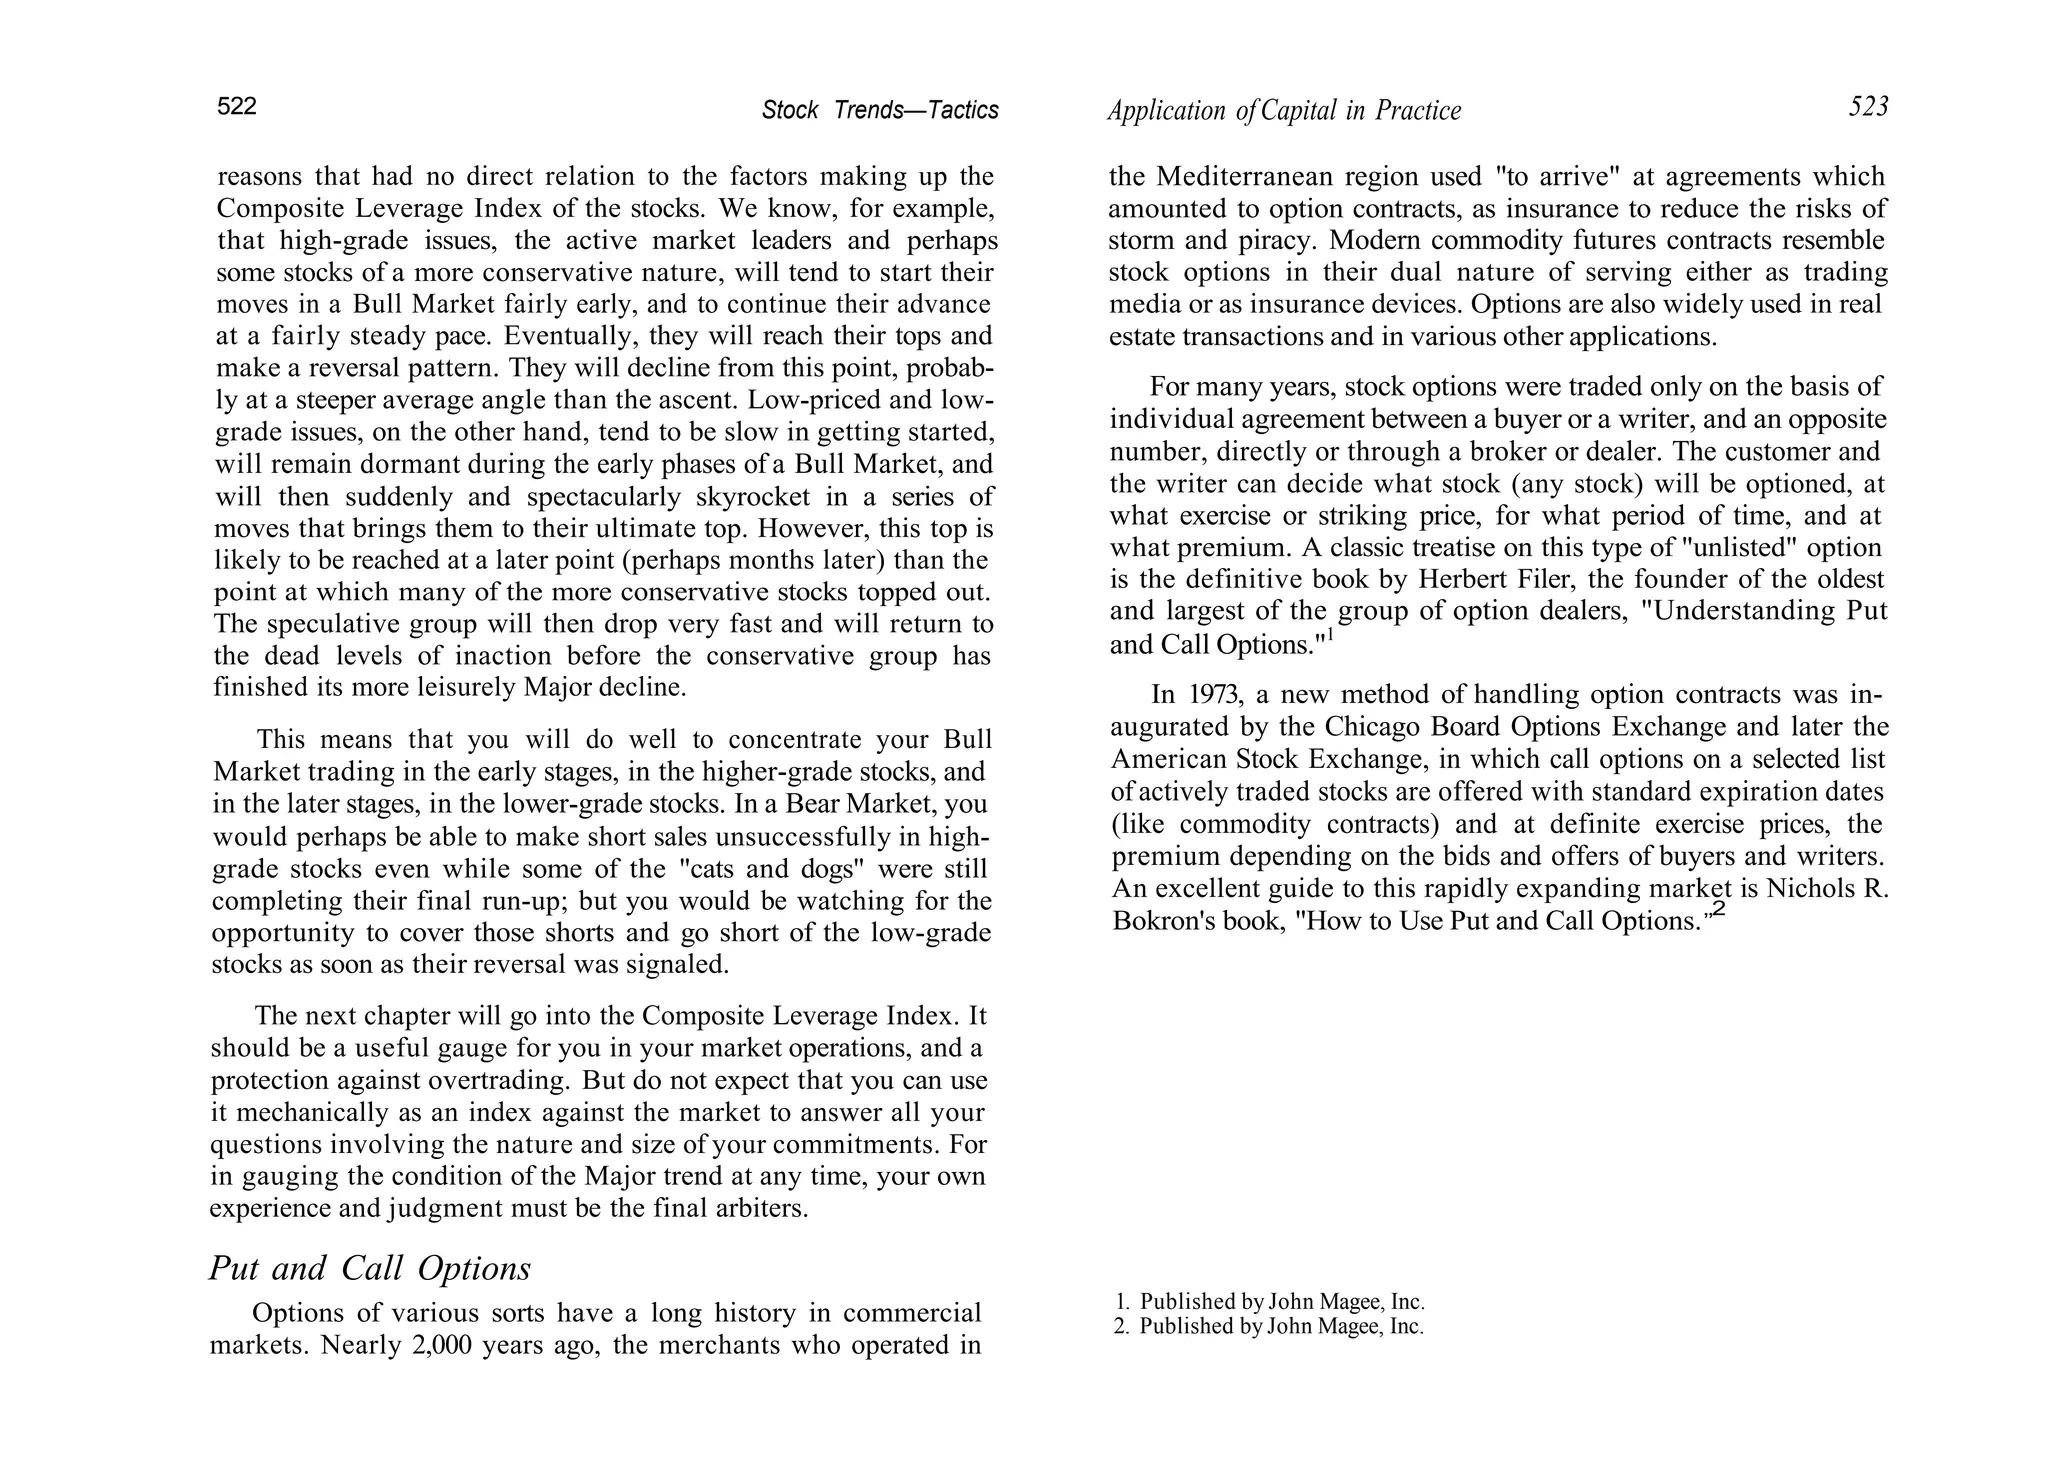
![426 Stock Trends—Tactics
DIAGRAM 3 DIAGRAM 4
DIAGRAM 3 (Left). Here is a rising trend showing the basic trendline across two
bottoms, which we call the Red Trendline, and its parallel (indicated by a broken
line) through the top of the intervening peak. The parallel suggests the ap-
proximate objective of the next move if the stock continues in trend.
DIAGRAM 4 (Right). The same rising trend with the return line, which we call
the Blue Trendline, drawn through two tops. Broken line represents its parallel
through the intervening bottom. This Blue Parallel is useful in determining a
buying point, especially in trends of rapidly changing form when the stock may
not react to its basic trendline.
DIAGRAM 5 DIAGRAM 6
DIAGRAM 5 (Left). This is a declining trend showing the basic trendline across
two tops, which we call the Blue Trendline, and its parallel (indicated by a broken
line) through the bottom of the intervening decline. The parallel suggests the ap-
proximate objective of the next move if the stock continues in trend.
DIAGRAM 6 (Right). The same declining trend with the return line, which we
call the Red Trendline, drawn through two bottoms. Broken Line represents its
parallel through the intervening top. This Red Parallel is useful in determining a
point at which to make short sales, especially in trends of rapidly changing form
when the stock may not rally to its basic trendline.
Trendlines in Action 417
DIAGRAM 7. Simplified diagram of a stock chart showing trend action. Basic trendlines
are marked with heavy lines; return lines are marked lightly.
At the start, the stock declines in a parallel trend channel. Blue Trendline is basic here.
A short sale on a rally to the Red Parallel at point A will find its objective on the Blue Paral-
lel at B. Another short sale on the Red Parallel at C would be followed by failure to reach
the objective. Chances are good, however, that increased volume would develop at the
double bottom and give warning to get out of short commitments. The up-side penetration
of the basic Blue Trendline at E, alone, is not sufficient reason to reverse position and go
long. Trendlines set up during formation of the Rectangle would be marked in the regular
way, but are indicated here by broken lines to emphasize the pattern. Another short sale, if
tried on the sixth point of contact with the Rectangle at F, would be stopped out on the
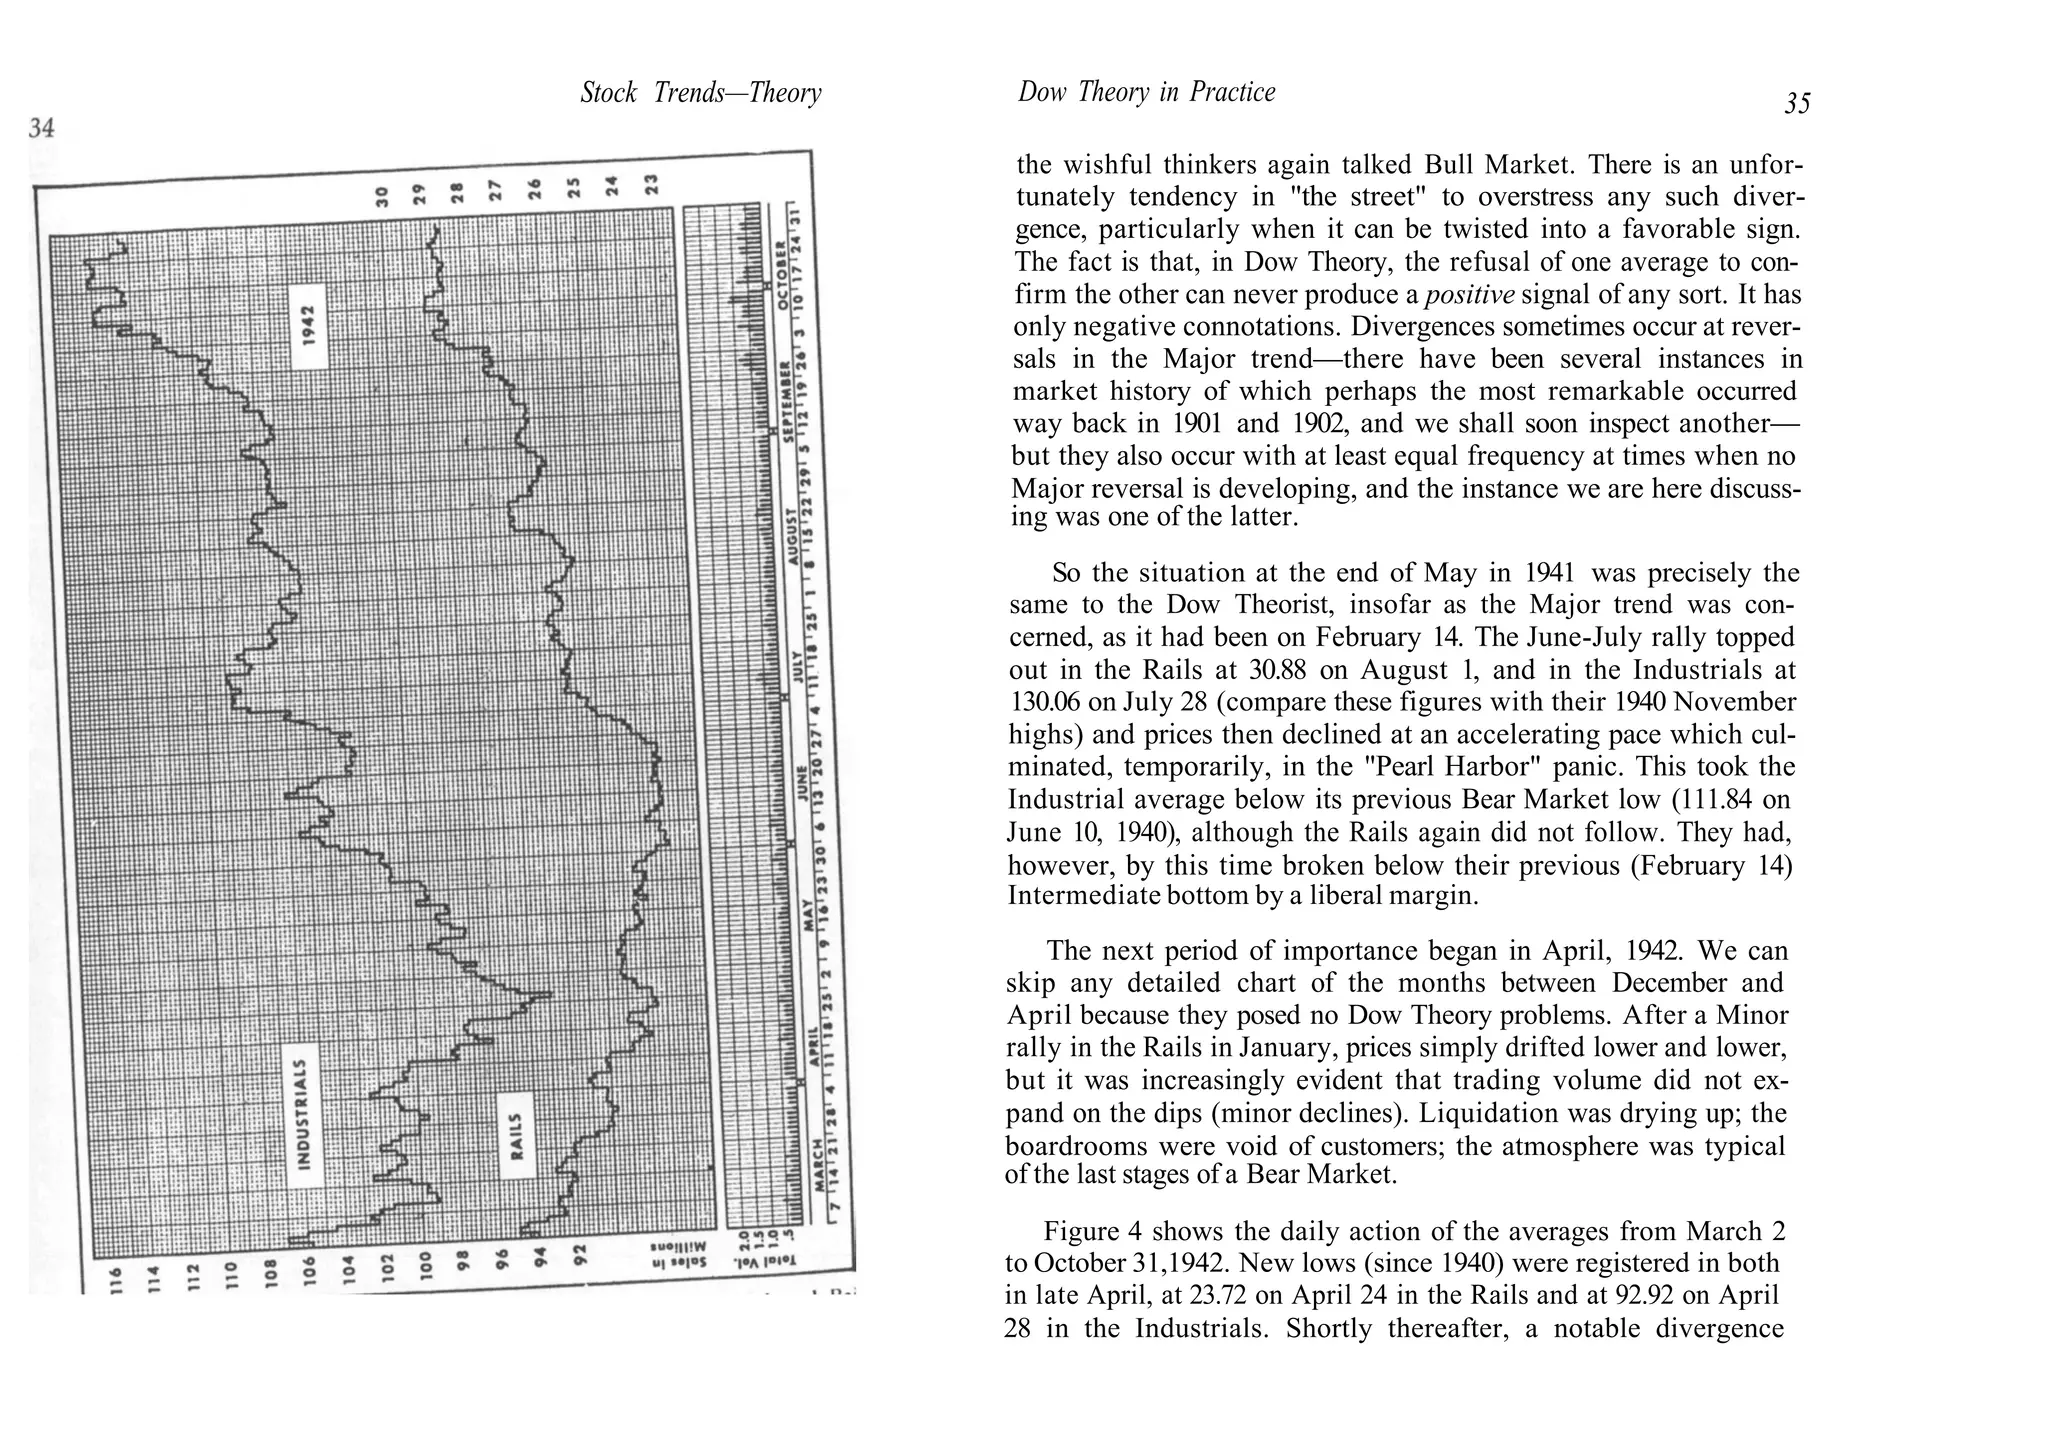
breakout.
The trend is now rising, although we cannot yet draw a basic (Red) trendline. The first
buy would be made on a 40-50% correction of the breakout move from the Rectangle, or on
ti return to the top (support) level at H.
A trendline would be drawn to the first bottom established in the Triangle. This is not
shown, as it would ultimately be replaced by the line shown through the outermost point in
the Triangle. We have indicated by broken lines the trendlines set up during the formation
of the pattern.
The objective of the breakout move from the Triangle would be the Red Parallel to our
now rising basic trendline. This objective is reached at J. A return line (Blue) would be
drawn from the first reversal top of the Triangle at G through the top of the breakout move
at ], and the parallel to this through point I would indicate about where to make the next
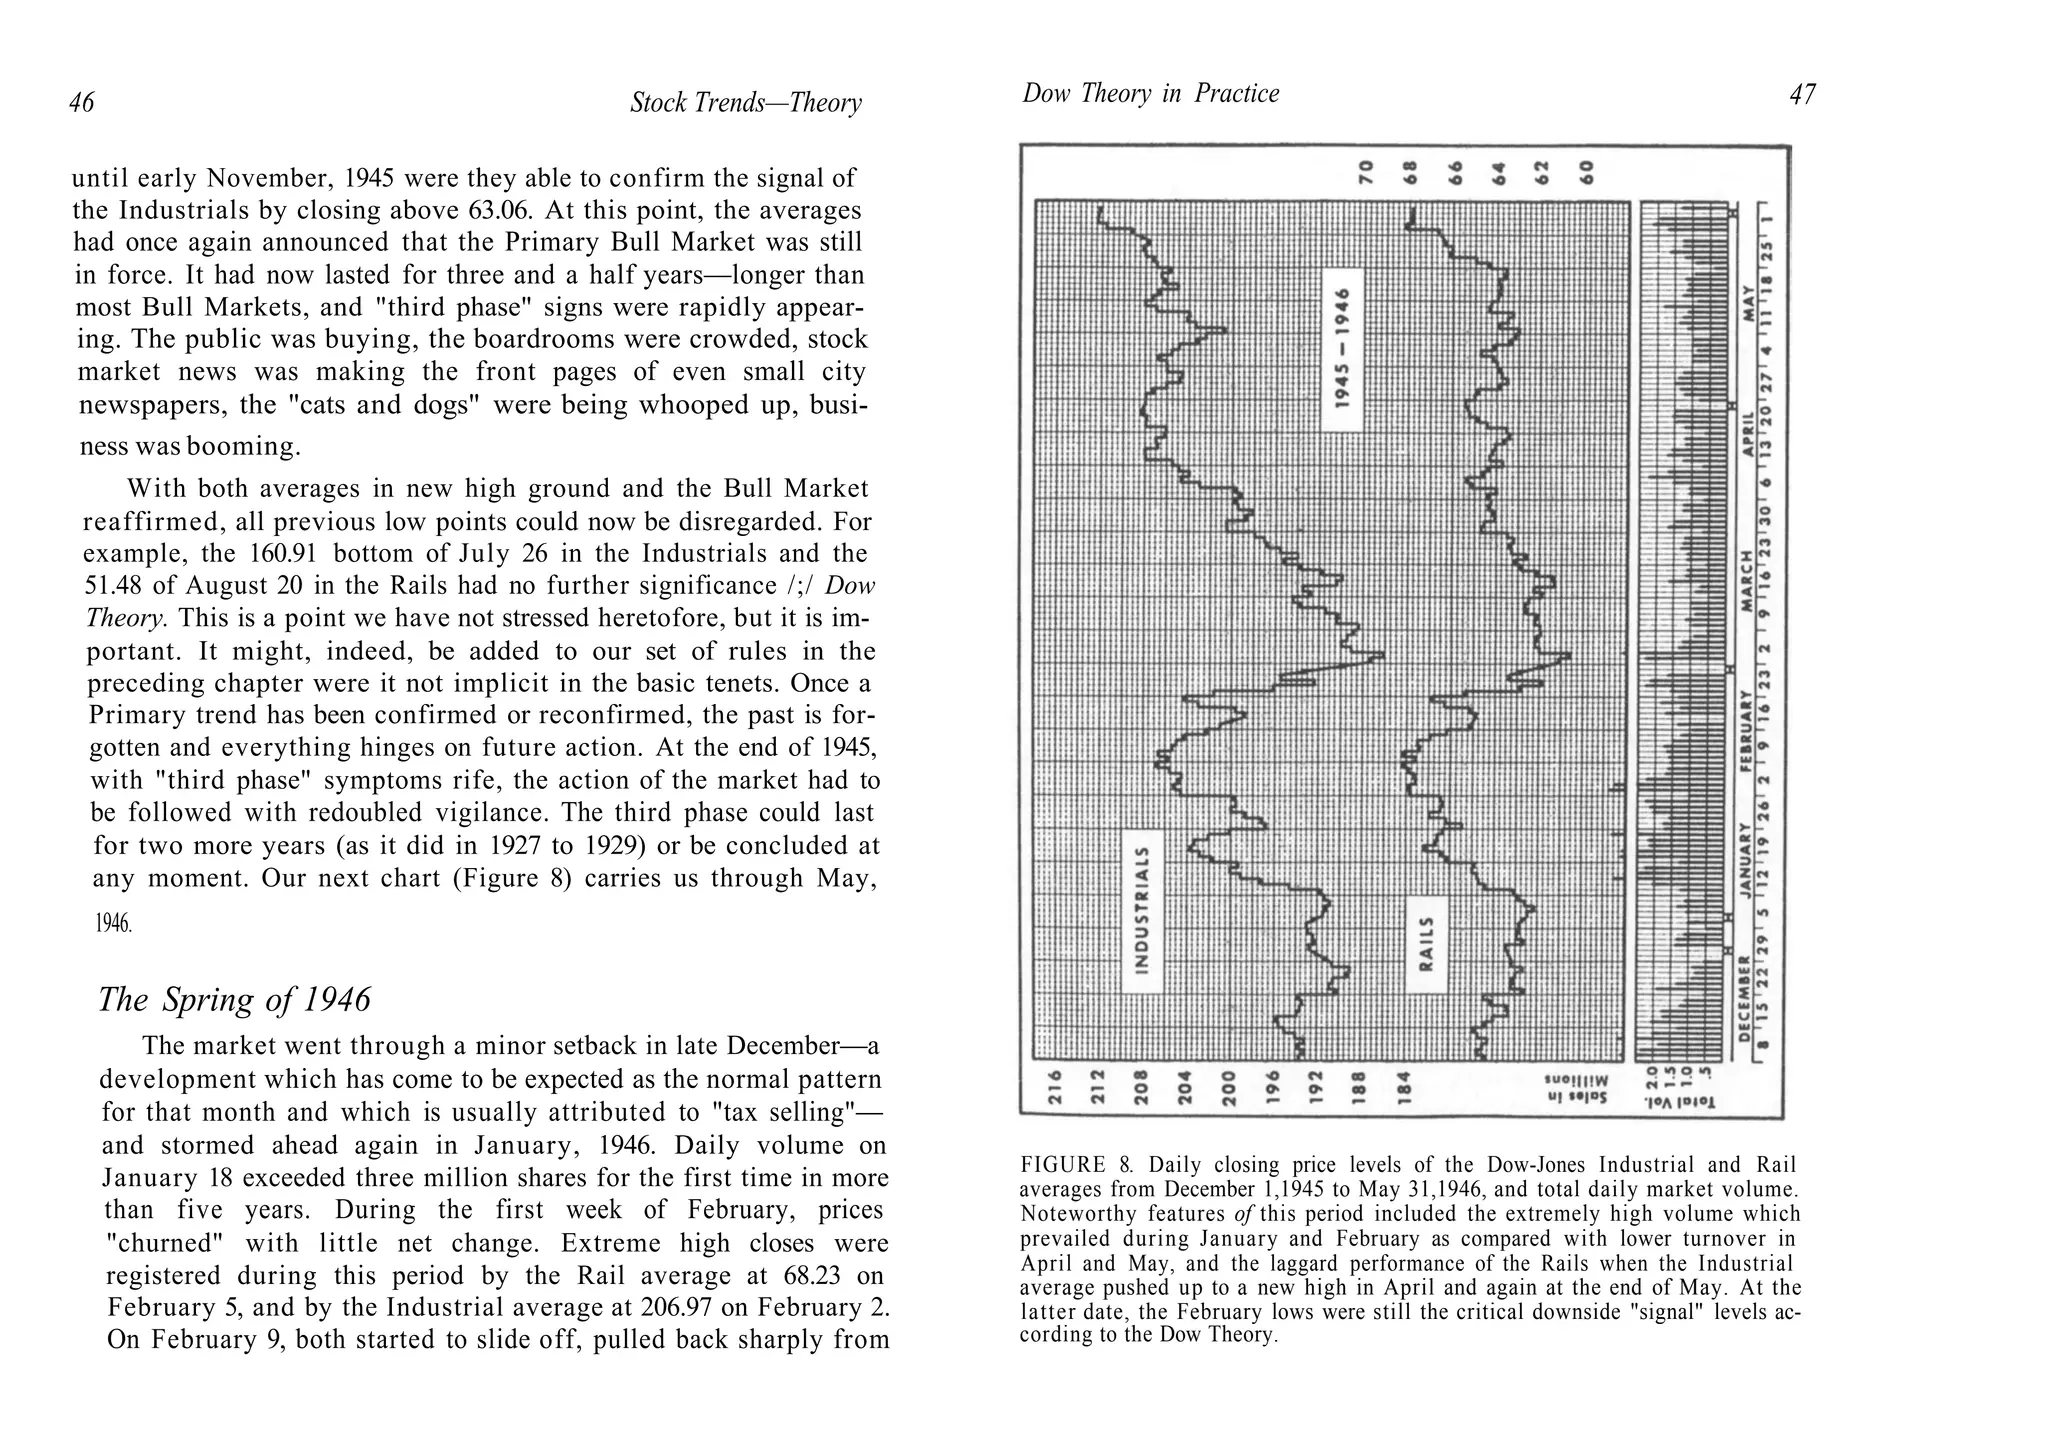
purchase. As a matter of fact, the stock does not actually get back to that point; in practice,
the purchase would probably be made at K on the basis of a 40-50% correction, or on a reac-
tion to the support level G.
The subsequent upward move would not carry through to the Red Parallel marked W.
However, the alarm would probably be sounded clearly by a day of heavy volume, a One-
D.iy Reversal, or a gap. Since the trend is now obviously convergent, no further purchases
would be considered. The next move fails to make such headway and falls far short of the
objective set by the Red Parallel marked Y. Soon after, the Wedge breaks out downside.](https://image.slidesharecdn.com/robertd-231024104721-45c19745/75/Robert-D-Edwards-John-Magee-Technical-Analysis-Of-Stock-Trends-pdf-209-2048.jpg)