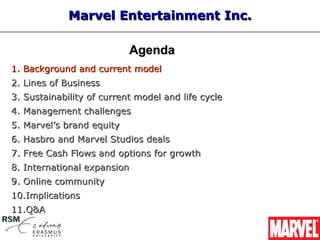
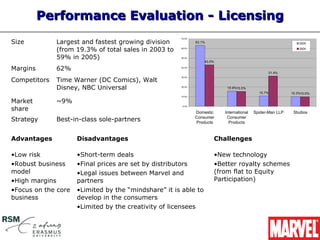
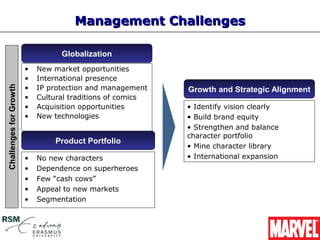
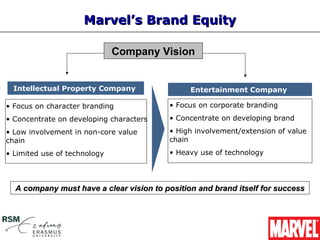
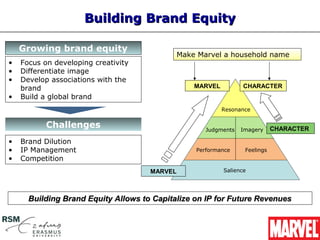
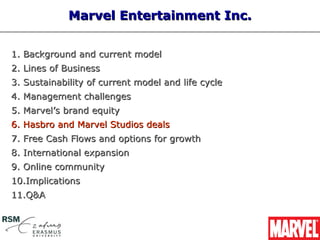
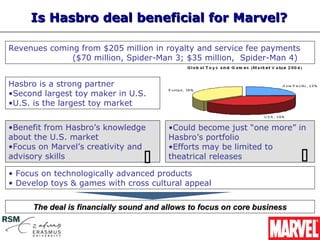
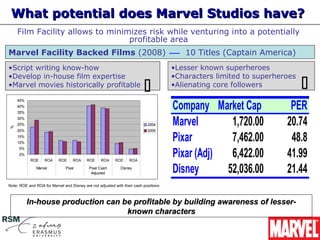
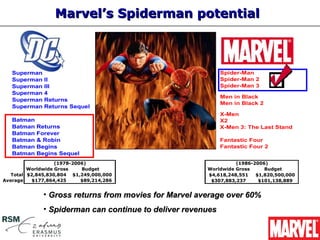
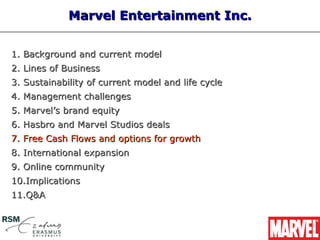
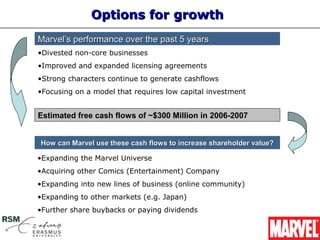
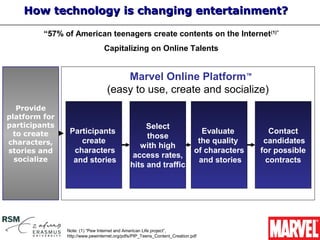
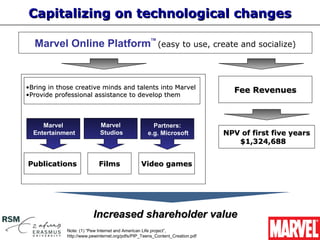
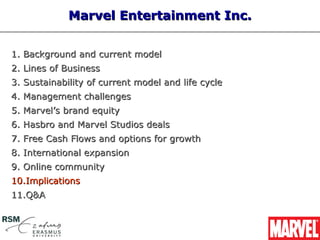
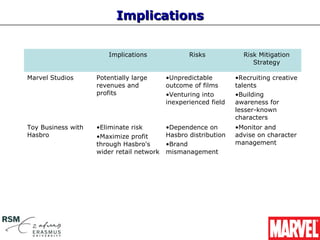
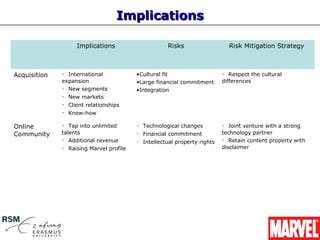
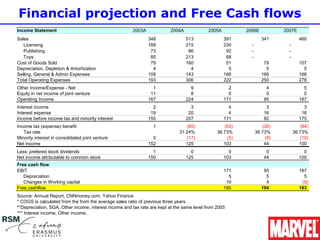
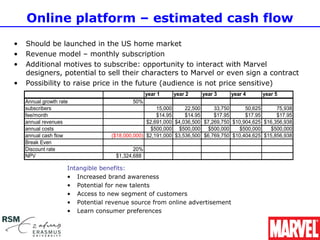
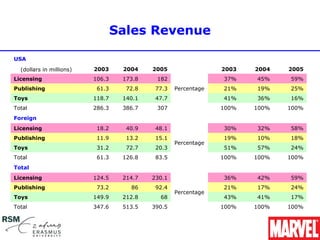
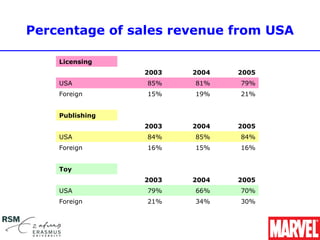
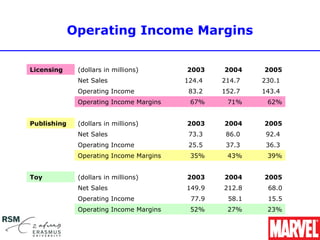
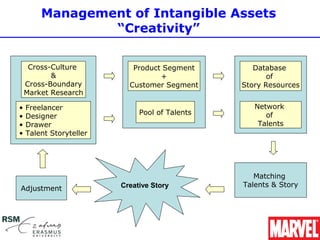
SlideShare a Scribd company logo
1 of 54
Marvel Entertainment Inc.


                 The Future of Entertainment

                                 Group B-9
Fang-Chi Chang, Manuel Pineros, Christina Radcliffe, Dov Rivkin, Itaru Shiraishi.
Marvel Entertainment Inc.

                           Agenda
1. Background and current model
2. Lines of Business
3. Sustainability of current model and life cycle
4. Management challenges
5. Marvel’s brand equity
6. Hasbro and Marvel Studios deals
7. Free Cash Flows and options for growth
8. International expansion
9. Online community
10.Implications
11.Q&A
What is at the core of Marvel?

 1939                                                    2006


              Intellectual Property


                                                      High Margins

                                                  =        &
                                                        Low Risk


Low Capital
                                      Licensing
Expenditure
Marvel Entertainment Inc.


1. Background and current model
2. Lines of Business
3. Sustainability of current model and life cycle
4. Management challenges
5. Marvel’s brand equity
6. Hasbro and Marvel Studios deals
7. Free Cash Flows and options for growth
8. International expansion
9. Online community
10.Implications
11.Q&A
Performance Evaluation - Licensing
                                                      70.0%

Size          Largest and fastest growing division            63.1%                                            2005

              (from 19.3% of total sales in 2003 to   60.0%                                                    2004


              59% in 2005)                            50.0%
                                                                  43.0%

Margins       62%                                     40.0%

                                                                                                31.4%

Competitors   Time Warner (DC Comics), Walt
                                                      30.0%


              Disney, NBC Universal                   20.0%
                                                                           15.9%15.5%
                                                                                            10.7%          10.3%10.0%
                                                      10.0%

Market        ~9%
share
                                                       0.0%


                                                              Domestic    International   Spider-Man LLP    Studios
                                                              Consumer     Consumer
Strategy      Best-in-class sole-partners                     Products      Products


Advantages           Disadvantages                                    Challenges

•Low risk            •Short-term deals                                •New technology
•Robust business     •Final prices are set by distributors            •Better royalty schemes
model                •Legal issues between Marvel and                 (from flat to Equity
•High margins        partners                                         Participation)
•Focus on the core   •Limited by the “mindshare” it is able to
business             develop in the consumers
                     •Limited by the creativity of licensees
Performance Evaluation - Publishing
Size             Second largest in terms of revenue
Customers        - Male well educated teens 13-23                          Market Share
                 - Collectors
                                                                     27%
Competitors      DC Comics
                                                                                                    40%
Key Success      - Quality content
Factors          - Relationship with retailers

Industry         -   Low barrier to entry
                 -   High power of retailers                                                    Marvel
                                                                           33%                  DC Comics
                 -   High substitution
                                                                                                Others
                 -   High switching costs

       Advantages                      Disadvantages                             Challenges
•Customer loyalty              •Narrow demographic                         •Channel management
•Rich characters               •Few “stars”                                •Readership expansion
•Multiple versions                                                         •Internet exploitation
                                                                           •Creating new “stars”
                                                                           •Sustaining “stars”


              Source: DC Comics Website, Marvel Annual Report 2005
Performance Evaluation - Toys
                                                                   Global Toys & Games
Size            Smallest in terms of revenue                       Market Segmentation
Customers       - Children 4-12
                                                                    9.8%
                - Collectors                                                           64.7%
Competitors     - Mattel
                - Jakks Pacific
Key Success     - Quality design
Factors         - Successful movies
                                                           25.5%
Industry        -Intense rivalry                                                       Traditional
                                                                                       Games software
                -Short lifecycles
                                                                                       Games consoles


       Advantages                 Disadvantages                     Challenges
•Appeal to younger           •Licensee risk                     •Decrease volatility
segment                      •Concentrated retailers            •Licensee
•Raise new                   •Influenced by movies              management
generation of fans


               Source: Datamonitor, Marvel Annual Report 2005
Marvel Entertainment Inc.


1. Background and current model
2. Lines of Business
3. Sustainability of current model and life cycle
4. Management challenges
5. Marvel’s brand equity
6. Hasbro and Marvel Studios deals
7. Free Cash Flows and options for growth
8. International expansion
9. Online community
10.Implications
11.Q&A
Can the current model continue to deliver?

After the turnaround, Marvel is   2006 is expected to be a rough
financially healthy               year, but the current pipeline is
                                  promising


 Analysts perceive that the current business model has potential
              and can continue to deliver, we agree
Where do Marvel’s businesses stand?


                  Publishing & Traditional Toys

              Licensing
Marvel Entertainment Inc.


1. Background and current model
2. Lines of Business
3. Sustainability of current model and life cycle
4. Management challenges
5. Marvel’s brand equity
6. Hasbro and Marvel Studios deals
7. Free Cash Flows and options for growth
8. International expansion
9. Online community
10.Implications
11.Q&A
Management Challenges

                                  Globalization
                        •   New market opportunities
                        •   International presence
                        •   IP protection and management
Challenges for Growth


                                                            Growth and Strategic Alignment
                        •   Cultural traditions of comics
                        •   Acquisition opportunities       • Identify vision clearly
                        •   New technologies                • Build brand equity
                                                            • Strengthen and balance
                                                            character portfolio
                                Product Portfolio
                                                            • Mine character library
                        •   No new characters               • International expansion
                        •   Dependence on superheroes
                        •   Few “cash cows”
                        •   Appeal to new markets
                        •   Segmentation
Marvel Entertainment Inc.


1. Background and current model
2. Lines of Business
3. Sustainability of current model and life cycle
4. Management challenges
5. Marvel’s brand equity
6. Hasbro and Marvel Studios deals
7. Free Cash Flows and options for growth
8. International expansion
9. Online community
10.Implications
11.Q&A
Marvel’s Brand Equity

                              Company Vision


  Intellectual Property Company                Entertainment Company

• Focus on character branding            • Focus on corporate branding
• Concentrate on developing characters   • Concentrate on developing brand
• Low involvement in non-core value      • High involvement/extension of value
chain                                    chain
• Limited use of technology              • Heavy use of technology


  A company must have a clear vision to position and brand itself for success
Building Brand Equity

    Growing brand equity
                                              Make Marvel a household name
•   Focus on developing creativity
•   Differentiate image
•   Develop associations with the
    brand                                         MARVEL          CHARACTER
•   Build a global brand
                                                           Resonance


           Challenges                                Judgments   Imagery     CHARACTER

•   Brand Dilution
•   IP Management                                 Performance     Feelings
•   Competition
                                     MARVEL                Salience


      Building Brand Equity Allows to Capitalize on IP for Future Revenues
Marvel Entertainment Inc.


1. Background and current model
2. Lines of Business
3. Sustainability of current model and life cycle
4. Management challenges
5. Marvel’s brand equity
6. Hasbro and Marvel Studios deals
7. Free Cash Flows and options for growth
8. International expansion
9. Online community
10.Implications
11.Q&A
Is Hasbro deal beneficial for Marvel?

Revenues coming from $205 million in royalty and service fee payments
              ($70 million, Spider-Man 3; $35 million, Spider-Man 4)


Hasbro is a strong partner
•Second largest toy maker in U.S.
•U.S. is the largest toy market


•Benefit from Hasbro’s knowledge        •Could become just “one more” in
about the U.S. market                   Hasbro’s portfolio
•Focus on Marvel’s creativity and       •Efforts may be limited to
advisory skills                        theatrical releases               
• Focus on technologically advanced products
• Develop toys & games with cross cultural appeal


     The deal is financially sound and allows to focus on core business
What potential does Marvel Studios have?
    Film Facility allows to minimizes risk while venturing into a potentially
                                 profitable area
Marvel Facility Backed Films (2008)                                                     10 Titles (Captain America)
•Script writing know-how                                                             •Lesser known superheroes
•Develop in-house film expertise                                                     •Characters limited to superheroes
•Marvel movies historically profitable
                                                                                    •Alienating core followers           
                                                                                     Company Market Cap              PER
    45%
    40%
    35%
    30%
    25%                                                                    2004      Marvel       1,720.00          20.74
%


    20%                                                                    2005
    15%
    10%
                                                                                     Pixar        7,462.00           48.8
                                                                                     Pixar (Adj)  6,422.00          41.99
     5%
     0%
           ROE     ROA     ROE     ROA    ROE     ROA    ROE     ROA
               Marvel          Pixar       Pixar Cash
                                            Adjusted
                                                            Disney
                                                                                     Disney      52,036.00          21.44
Note: ROE and ROA for Marvel and Disney are not adjusted with their cash positions


          In-house production can be profitable by building awareness of lesser-
                                   known characters
Marvel’s Spiderman potential


   Superman                                                  Spider-Man
   Superman   II                                             Spider-Man 2
   Superman   III                                            Spider-Man 3
   Superman   4
                                                             Men in Black
   Superman   Returns
                                                             Men in Black 2
   Superman   Returns Sequel
                                                             X-Men
   Batman                                                    X2
   Batman   Returns                                          X-Men 3: The Last Stand
   Batman   Forever
   Batman   & Robin                                          Fantastic Four
   Batman   Begins                                           Fantastic Four 2
   Batman   Begins Sequel
                   (1978-2006)                                   (1986-2006)
         Worldwide Gross    Budget                     Worldwide Gross     Budget
   Total $2,845,830,804 $1,249,000,000                 $4,618,248,551   $1,820,500,000
Average    $177,864,425     $89,214,286                 $307,883,237     $101,138,889


              • Gross returns from movies for Marvel average over 60%
              • Spiderman can continue to deliver revenues
Marvel Entertainment Inc.


1. Background and current model
2. Lines of Business
3. Sustainability of current model and life cycle
4. Management challenges
5. Marvel’s brand equity
6. Hasbro and Marvel Studios deals
7. Free Cash Flows and options for growth
8. International expansion
9. Online community
10.Implications
11.Q&A
Options for growth
Marvel’s performance over the past 5 years
•Divested non-core businesses
•Improved and expanded licensing agreements
•Strong characters continue to generate cashflows
•Focusing on a model that requires low capital investment


Estimated free cash flows of ~$300 Million in 2006-2007


How can Marvel use these cash flows to increase shareholder value?

•Expanding the Marvel Universe
•Acquiring other Comics (Entertainment) Company
•Expanding into new lines of business (online community)
•Expanding to other markets (e.g. Japan)
•Further share buybacks or paying dividends
Moving towards introductory stage

           Consoles
               & Online
               Games
                     Licensing


       Online
     communities


                   Movies


     International Expansion Strategy
Marvel Entertainment Inc.


1. Background and current model
2. Lines of Business
3. Sustainability of current model and life cycle
4. Management challenges
5. Marvel’s brand equity
6. Hasbro and Marvel Studios deals
7. Free Cash Flows and options for growth
8. International expansion
9. Online community
10.Implications
11.Q&A
International Expansion Strategies
Japanese                 Key Reasons:
                         •Major footprint in the region
Market                   •Relative low piracy level
                         •High technology penetration: a test market for the US and Europe
Key Facts(1):
 US$17 billion manga, anime and related video
  games                                                             Hello Kitty, Cinnamoroll
 US$14 billion character merchandise sales
 75 anime broadcast/ week (2001)
 748 million comic books printed (2002)
 3.2 billion comic magazine print (2002)

Possible Targets (market capitalization):
Sanrio         ($1,348MM)
Takara-Tomy ($687MM)
Bandai-Namco ($3,650MM)                                            3/2006 PER (estimate): 30.81

Financing option: Treasury stock                                    Operational Income Breakdown
                                                                    (3/2007 estimate)
 Access and Gain following:
 •   Character library
 •   New demographic segments
 •   Client relationship
 •   Anime management know-how
 •   Market knowledge


                         Note: (1) JAPA http://www.ppp.am/ppp_shiryou_data.html
Successful superheroes across regions?

USA                                                                   China


                                                      Inframan


Europe                                                                 India


           Agent 327


Adaptation is necessary to transfer popular culture figures such as comics


                   http://www.internationalhero.co.uk/nonus.htm
Marvel Entertainment Inc.


1. Background and current model
2. Lines of Business
3. Sustainability of current model and life cycle
4. Management challenges
5. Marvel’s brand equity
6. Hasbro and Marvel Studios deals
7. Free Cash Flows and options for growth
8. International expansion
9. Online community
10.Implications
11.Q&A
How technology is changing entertainment?

         “57% of American teenagers create contents on the Internet(1)”
                                Capitalizing on Online Talents


                                      Marvel Online Platform                               TM


                                  (easy to use, create and socialize)
   Provide
platform for
participants                                      Select
  to create     Participants                                                 Evaluate             Contact
                                                  those
characters,        create                                                   the quality          candidates
                                                with high
stories and      characters                                                of characters        for possible
                                              access rates,
  socialize      and stories                                                and stories          contracts
                                             hits and traffic


               Note: (1) “Pew Internet and American Life project”,
               http://www.pewinternet.org/pdfs/PIP_Teens_Content_Creation.pdf
Capitalizing on technological changes

  Marvel Online Platform
                                                     TM
                                                          (easy to use, create and socialize)


•Bring in those creative minds and talents into Marvel
                                                                                Fee Revenues
•Provide professional assistance to develop them


     Marvel                 Marvel                   Partners:
  Entertainment             Studios                e.g. Microsoft             NPV of first five years
                                                                                 $1,324,688


Publications                Films               Video games


                         Increased shareholder value
             Note: (1) “Pew Internet and American Life project”,
             http://www.pewinternet.org/pdfs/PIP_Teens_Content_Creation.pdf
Marvel Entertainment Inc.


1. Background and current model
2. Lines of Business
3. Sustainability of current model and life cycle
4. Management challenges
5. Marvel’s brand equity
6. Hasbro and Marvel Studios deals
7. Free Cash Flows and options for growth
8. International expansion
9. Online community
10.Implications
11.Q&A
Implications

                        Implications              Risks            Risk Mitigation
                                                                      Strategy

Marvel Studios      Potentially large      •Unpredictable        •Recruiting creative
                    revenues and           outcome of films      talents
                    profits                •Venturing into       •Building
                                           inexperienced field   awareness for
                                                                 lesser-known
                                                                 characters
Toy Business with   •Eliminate risk        •Dependence on        •Monitor and
Hasbro              •Maximize profit       Hasbro distribution   advise on character
                    through Hasbro's       •Brand                management
                    wider retail network   mismanagement
Implications

                   Implications                      Risks                  Risk Mitigation Strategy


Acquisition   ・ International            •Cultural fit                    ・ Respect the cultural
              expansion                  •Large financial commitment      differences
              ・ New segments             •Integration
              ・ New markets
              ・ Client relationships
              ・ Know-how

Online        ・ Tap into unlimited       ・ Technological changes          ・ Joint venture with a strong
Community     talents                    ・ Financial commitment           technology partner
              ・ Additional revenue       ・ Intellectual property rights   ・ Retain content property with
              ・ Raising Marvel profile                                    disclaimer
Q&A


The Avengers
Appendix
Financial projection and Free Cash flows
Income Statement                                       2003A             2004A              2005A         2006E           2007E
Sales                                                          348               513                391           341             460
   Licensing                                                   189               215                230     -               -
   Publishing                                                   73                86                 92     -               -
   Toys                                                         85               213                 68     -               -
Cost of Goods Sold                                              79               160                 51            79             107
Depreciation, Depletion & Amortization                           4                 4                  5             5               5
Selling, General & Admin Expenses                              109               143                166           166             166
Total Operating Expenses                                       193               306                222           250             278
Other Income/Expense - Net                                       1                 9                  2              4              5
Equity in net income of joint venture                           11                 8                  0              0              0
Operating Income                                               167               224                171             95            187
Interest income                                                  2                 3                  4              3              3
Interest expense                                                19                20                  4             16             16
Income before income tax and minority interest                 150               207                171             82            175
Income tax (expense) benefit                                     1               (65)              (63)            (30)            (64)
   Tax rate                                                                   31.24%            36.73%          36.73%          36.73%
Minority interest in consolidated joint venture                  0               (17)               (5)             (8)            (10)
Net income                                                     152               125               103              44             100
Less: prefered stock dividends                                   1                 0                  0              0              0
Net income attributable to common stock                        150               125                103             44            100
Free cash flow
EBIT                                                                                                171            95             187
   Depreciation                                                                                       5             5               5
   Changes in Working capital                                                                        10             4              (9)
Free cashflow                                                                                       185           104             183
Source: Annual Report, CNNmoney.com, Yahoo Finance
* COGS is calculated from the from the average sales ratio of previous three years
**Depreciation, SGA, Other income, interest income and tax rate are kept at the same level from 2005
*** Interest income, Other income,
Online platform – estimated cash flow
•   Should be launched in the US home market
•   Revenue model – monthly subscription
•   Additional motives to subscribe: opportunity to interact with Marvel
    designers, potential to sell their characters to Marvel or even sign a contract
•   Possibility to raise price in the future (audience is not price sensitive)
                                                 year 1    year 2     year 3     year 4      year 5
    Annual growth rate                     50%
    subscribers                                      15,000     22,500     33,750      50,625      75,938
    fee/month                                        $14.95     $14.95     $17.95      $17.95      $17.95
    annual revenues                              $2,691,000 $4,036,500 $7,269,750 $10,904,625 $16,356,938
    annual costs                                  $500,000 $500,000 $500,000         $500,000   $500,000
    annual cash flow               ($18,000,000) $2,191,000 $3,536,500 $6,769,750 $10,404,625 $15,856,938
    Break Even
    Discount rate                          20%
    NPV                             $1,324,688

                     Intangible benefits:
                     • Increased brand awareness
                     • Potential for new talents
                     • Access to new segment of customers
                     • Potential revenue source from online advertisement
                     • Learn consumer preferences
Sales Revenue

USA
  (dollars in millions)   2003     2004    2005                 2003   2004   2005
Licensing                 106.3    173.8    182                 37%    45%    59%
Publishing                 61.3     72.8    77.3   Percentage   21%    19%    25%
Toys                      118.7    140.1    47.7                41%    36%    16%
Total                     286.3    386.7    307                 100%   100%   100%
Foreign
Licensing                  18.2     40.9    48.1                30%    32%    58%
Publishing                 11.9     13.2    15.1                19%    10%    18%
                                                   Percentage
Toys                       31.2     72.7    20.3                51%    57%    24%
Total                      61.3    126.8    83.5                100%   100%   100%
Total
Licensing                 124.5    214.7   230.1                36%    42%    59%
Publishing                 73.2      86     92.4                21%    17%    24%
                                                   Percentage
Toys                      149.9    212.8     68                 43%    41%    17%
Total                     347.6    513.5   390.5                100%   100%   100%
Percentage of sales revenue from USA

    Licensing     
                     2003   2004   2005
    USA              85%    81%    79%
    Foreign          15%    19%    21%


    Publishing    
                     2003   2004   2005
    USA              84%    85%    84%
    Foreign          16%    15%    16%


    Toy           
                     2003   2004   2005
    USA              79%    66%    70%
    Foreign          21%    34%    30%
Operating Income Margins


Licensing     (dollars in millions)      2003    2004    2005
              Net Sales                  124.4   214.7   230.1
              Operating Income            83.2   152.7   143.4
              Operating Income Margins    67%     71%     62%


Publishing    (dollars in millions)      2003    2004    2005
              Net Sales                   73.3    86.0    92.4
              Operating Income            25.5    37.3    36.3
              Operating Income Margins    35%     43%     39%


Toy           (dollars in millions)      2003    2004    2005
              Net Sales                  149.9   212.8    68.0
              Operating Income            77.9    58.1    15.5
              Operating Income Margins    52%     27%     23%
Marvel’s Movies and TV Pipeline

Feature Films (2006)  3 Titles (X-Men 3,Ghost Rider, The Punisher 2)
                                   +
Films in Development (2007)  10 (Spider Man 3, Fantastic Four 2)
                                   +
Marvel Facility Backed Films (2008)  10 Titles (Captain America)

                                   +
Direct-to-Video  4 releases starting in 2006 (Ultimate Avengers)
Animated TV  1 release (Fantastic Four)
Live Action TV  3 releases (Alter Ego, Blade)

                                   +
Video Games  8 releases over 2005-06 (Activision deal through 2017)
Financials   - ROA & ROIC
Financials                              - ROA & ROIC

                    Comics, Graphic Novel, & Magazine Publisher


                               Other Non-top 20 ,
                                     4.81%
                   Small Size (2% to
                    .24%), 10.11%

         IDW Publishing, 2.02%
            Tokyopop, 2.86%                               Marvel Comics,
                                                             39.56%
         Image Comics, 3.36%

          Dark Horse Comics,
                4.61%


                        DC Comics, 32.67%


Source: http://www.diamondcomics.com/market_share.html
Financials                           - ROA & Operating Margins

                                        MARVEL - ROA (1996 - 2005)

                   60

                   40

                   20

                   0

                -20

                -40
                         1996    1997     1998    1999    2000     2001   2002    2003    2004    2005
Return On Assets         11.01   -16.86 -17.54    -1.84   -10.51   4.42   9.72    31.69   18.27   15.46
Operating Profit Margin 12.28    -32.68   -1.12   0.08    -15.49   0.63   21.86   44.57   41.14   46.48


                        Source: Thomson
Financials - Operating Income per LOB

                      Operating Income per Business Units

   100%

       80%

       60%

       40%

       20%

       0%

    -20%

    -40%
             2001             2002        2003         2004      2005
Licensing    5,200           69,400      139,400      152,700   143,400
Toys         -5,800           8,900       77,905      58,100    15,500
Publishing   14,500          19,600       25,400      37,300    36,300
Financials                 - Revenues by Region
                                                                     Licensing
                         Revenues by Geographic Region
                                                                     Publishing
                                                                     Toys
           200
MIllions


           180
           160
           140
           120
           100
            80
            60
            40
            20
             0
                 US      Foreign     US      Foreign     US      Foreign
                      2003                2004                2005
Financials                     - Licensing Sales

                    Licensing Sales by Division

250                                                             230.1
                                                        214.7

200

150             145.3
       92.4
100                                                                     2004
                                67.5
                                                                        2005
                   33.3 36.5
 50                                 24.7    21.5 23.6

 0
      Domestic International Spider Man    Studios       Total
      Consumer Consumer         L.P.
      Products   Products
Financials                 - Licensing by Category

                      Licensing Sales by Category


 70


 60


 50


 40
                                                                        2004
 30                                                                     2005


 20


 10


 0
      Apparel and   Entertainment   Toy Royalties   Other (Domestics,
      Accessories                                    food and other)
Movies: Spider-man vs. Batman
                                           1st                       Worldwide 
 Released          Movie Name           Weekend      US Gross          Gross          Budget   
       5/3/2002 Spider-Man              $114,844,116 $403,706,375     $821,700,000   $139,000,000
      6/30/2004 Spider-Man 2             $88,156,227 $373,524,485     $783,924,485   $200,000,000
       5/4/2007 Spider-Man 3                -             -               -          $250,000,000
                     Totals                          $777,230,860   $1,605,624,485   $589,000,000
                    Averages                         $388,615,430     $802,812,243   $196,333,333


                                           1st                      Worldwide 
 Released             Movie Name                     US Gross                        Budget   
                                        Weekend                      Gross   
       6/23/1989   Batman                $40,505,884 $251,188,924   $413,200,000      $35,000,000
       6/19/1992   Batman Returns        $45,687,710 $162,833,635   $282,801,937      $80,000,000
      12/25/1993   Batman: Mask of the    $1,406,291   $5,617,391       -                 -
                   Phantasm
       6/16/1995   Batman Forever        $52,784,433 $184,031,112    $335,000,000    $100,000,000
       6/20/1997   Batman & Robin        $42,872,605 $107,325,195    $237,300,000    $125,000,000
       6/15/2005   Batman Begins         $48,745,440 $205,343,774    $371,824,647    $150,000,000
      12/31/2008   Batman Begins            -             -              -                -
                   Sequel
                        Totals                       $916,340,031   $1,645,743,975   $490,000,000
                      Averages                       $152,723,339     $274,290,663    $98,000,000


Source: http://www.diamondcomics.com/market_share.html
Management of Intangible Assets
              “Creativity”

  Cross-Culture           Product Segment        Database 
        &                        +                   of 
 Cross-Boundary          Customer Segment     Story Resources
 Market Research

• Freelancer                                     Network 
                            Pool of Talents         of 
• Designer
• Drawer                                          Talents
• Talent Storyteller


                                                 Matching 
                       Creative Story         Talents & Story
Adjustment
Sanrio (TSE: 8136)
Sanrio Co. (TSE:8136)                                           Divisional Income statement
Library includes:                                               Overseas sales
Hello Kitty, Cinnamoroll                                        # of characters
Main lines of business:
Strength: Licensing, Overseas
Weakness: theme parks, toy merchandising


Other Possible Targets                                          Sanrio Financial Data
                                                                (115 yen/$)                                      MM Yen MM $US
(market capitalization):                                        Share Price (4/25/2006)                             1,785     15.52
Takara-Tomy ($687MM)                                           Market Capitalization(4/25/2005)                  154,965     1,348
Bandai-Namco ($3,650MM)                                        Total Debt (12/2005)                               39,983       348
                                                                Revenue                                           102,400       890
                                                                Operating Profit (2005E)                            9,200        80
Financing option:                                               Licensing Profit (2005E)                            8,700        76
                                                                Net Income (2005E)                                  4,700        41
Treasury stock                                                  Estimated 2006 EPS                                   56.7      0.49
LBO                                                             Estimated 2007 EPS                                   51.1      0.44
                                                                                                                          Ratios
                                                                D/E Ratio                                                      1.28
                                                                Estimated 2006 PER                                            31.48
                                                                Estimated 2007 PER                                            34.93
                                                                * Note: 2005E is fiscal year ending March 2006


                    Note: (1) JAPA http://www.ppp.am/ppp_shiryou_data.html
Marvel & Licensing industry
                                 2005   2004     2003
  Net Sales                     230.1   214.7    124.4
  Cost of sales                     0       0        0            59.0%
  SG&A                           87.1      70     52.5
  Operating Income                143   152.7     83.2                    41.8%
  Margins                        62%     71%      67%                                     35.8%

                                                                                                  19.3%


Estimated Licensing Revenues by Property Type (2004)
in $million (source: LIMA)                                      2005     2004    2003   2002

                                                  Estimated Revenues of Entertainment/Character
                                                  Properties by Product Category (2004)


                                                                          6.5%
                                                                    14%           10.5%

                                                            24%
Major US Titles


Source: http://www.igda.org/online/IGDA_PSW_Whitepaper_2004.pdf
•By 2008 we forecast the usage of online games will be 35 billion hours a year
•PC pay revenue is the biggest revenue stream
•Pay revenue is money paid by consumers for subscriptions etc; ad revenue is money from
advertising, sponsorships, e-commerce royalties etc
•even as usage and revenues from online games soars, profits are likely to be elusive. In
fact, most companies in the online game market are likely to lose money over the next five
year

  Source: http://www.dfcint.com/game_article/june03article.html
Economics of Online games
There has been little or no correlation between the level of success and the size of the 
     investment
Subscription revenues make for an attractive business case and are necessary to provide 
     a return on the high costs of development and ongoing operations
if a game has over 100,000 subscribers it is not hard to realize 25+% net profit on 
     subscriptions and if it is over 200k, 40% is possible. Conversely, a game of 50,000 
     subscribers may only have a 10% net profit.
Scale is clearly a significant issue in profitability, mainly because of the massive fixed 
     expenses required to build, launch and run this kind of business
Budgets for online games range from $2MM up to $30MM and higher
By far the most common method for funding OL games is through publisher funding. 
     Indeed, most MMORPGs have been not only funded by publishers but also developed 
     by their in-house studios
A small number of titles have been developed externally with Publisher funding, notably 
     City of Heroes, developed by Cryptic Studios and published by NCsoft, and the 
     Asheron’s Call games developed by Turbine and published by Microsoft.
A few developers have had success in raising substantial venture capital investments, 
     notably: Linden Labs ($8MM Oct 2004), Turbine ($18MM Dec 2003, at least $10MM 
     in earlier rounds), Mythic ($32MM 2003, at least $3MM in earlier rounds), There.com 
     (over $30MM in various rounds) and Artifact Entertainment (at least $10MM in 
     various rounds, including $5MM from NCsoft). Raising VC is extremely difficult, and 
     most of the above developers had established their skills and credibility by working 
     with publishers before raising capital
Revenue models
At present, and for the foreseeable future, the primary revenue source for
 persistent online games, at least in the U.S., is the monthly subscription
Subscription pricing has increased steadily from the early days of the web. 
   Simutronics' play.net site was one of the early subscription-based models, 
   charging $9.95/month in 1997. Ultima Online, launched in 1998, followed 
   suit, also charging $9.95. Today, prices tend to range between $10 & $15 
   per month, with $14.95 seeming to be the most popular price point
Gaming audience, once they are already signed up to a game, does not 
   appear to be particularly price sensitive. Indeed, it has proven possible to 
   raise prices on customers without suffering substantial attrition; in 2001, 
   Funcom and Mythic launched their titles at $12.95 per month, and in 2002, 
   Sony Online Entertainment raised the monthly price of EverQuest from 
   $9.89 to $12.95, with virtually no increase in customer churn as a result. 
   Ultima Online and Funcom’s Anarchy Online raised rates as well.
Additional options:
Revenue Generation from Services
Virtual Goods Sales article in Economist

More Related Content

What's hot

Disney Marvel LinkedIn
Disney Marvel LinkedInDisney Marvel LinkedIn
Disney Marvel LinkedInKyleCEdington
 
Marketing: why Disney buys Marvel
Marketing: why  Disney buys MarvelMarketing: why  Disney buys Marvel
Marketing: why Disney buys MarvelPlatipus
 
Marvel Studios Microeconomics Presentation
Marvel Studios Microeconomics PresentationMarvel Studios Microeconomics Presentation
Marvel Studios Microeconomics PresentationDonKellyJr
 
Gorman IMAX-marketing plan
Gorman IMAX-marketing planGorman IMAX-marketing plan
Gorman IMAX-marketing planBritanyGorman
 
Hasbro Report
Hasbro ReportHasbro Report
Hasbro Reportegalt
 
Multi channel engagement-redefine -boost it through email
Multi channel engagement-redefine -boost it through emailMulti channel engagement-redefine -boost it through email
Multi channel engagement-redefine -boost it through emailYes Lifecycle Marketing
 
Mattel Advertising Campaign
Mattel Advertising CampaignMattel Advertising Campaign
Mattel Advertising CampaignNicole Fernandez
 
mattel annual reports 2003
mattel annual reports 2003mattel annual reports 2003
mattel annual reports 2003finance35
 
Product placements [In-Film Branding] and advertising in movies
Product placements [In-Film Branding] and advertising in moviesProduct placements [In-Film Branding] and advertising in movies
Product placements [In-Film Branding] and advertising in moviesKartik Mehta
 
Mattel Barbie Presentation
Mattel Barbie PresentationMattel Barbie Presentation
Mattel Barbie PresentationChristopher Chen
 
Hasbro Enters the Movies
Hasbro Enters the MoviesHasbro Enters the Movies
Hasbro Enters the MoviesRyan Huelsmann
 
Mattel pitch brief
Mattel pitch briefMattel pitch brief
Mattel pitch briefCubeyou Inc
 
픽사템플릿 거의마지막
픽사템플릿 거의마지막픽사템플릿 거의마지막
픽사템플릿 거의마지막Eunchan Bae
 
Market analysis for (Marvel Entertainment)
Market analysis for  (Marvel Entertainment)Market analysis for  (Marvel Entertainment)
Market analysis for (Marvel Entertainment)YolandaWard2
 

What's hot (19)

Disney Marvel LinkedIn
Disney Marvel LinkedInDisney Marvel LinkedIn
Disney Marvel LinkedIn
 
Marketing: why Disney buys Marvel
Marketing: why  Disney buys MarvelMarketing: why  Disney buys Marvel
Marketing: why Disney buys Marvel
 
Marvel Studios Microeconomics Presentation
Marvel Studios Microeconomics PresentationMarvel Studios Microeconomics Presentation
Marvel Studios Microeconomics Presentation
 
Gorman IMAX-marketing plan
Gorman IMAX-marketing planGorman IMAX-marketing plan
Gorman IMAX-marketing plan
 
Hasbro Report
Hasbro ReportHasbro Report
Hasbro Report
 
Hasbro
HasbroHasbro
Hasbro
 
EVERYMAN BRAND IMPLEMENTATION
EVERYMAN BRAND IMPLEMENTATIONEVERYMAN BRAND IMPLEMENTATION
EVERYMAN BRAND IMPLEMENTATION
 
Multi channel engagement-redefine -boost it through email
Multi channel engagement-redefine -boost it through emailMulti channel engagement-redefine -boost it through email
Multi channel engagement-redefine -boost it through email
 
Mattel Advertising Campaign
Mattel Advertising CampaignMattel Advertising Campaign
Mattel Advertising Campaign
 
mattel annual reports 2003
mattel annual reports 2003mattel annual reports 2003
mattel annual reports 2003
 
Product placements [In-Film Branding] and advertising in movies
Product placements [In-Film Branding] and advertising in moviesProduct placements [In-Film Branding] and advertising in movies
Product placements [In-Film Branding] and advertising in movies
 
Research task
Research taskResearch task
Research task
 
Mattel Barbie Presentation
Mattel Barbie PresentationMattel Barbie Presentation
Mattel Barbie Presentation
 
Honey nut cheerios 1
Honey nut cheerios  1Honey nut cheerios  1
Honey nut cheerios 1
 
Hasbro Enters the Movies
Hasbro Enters the MoviesHasbro Enters the Movies
Hasbro Enters the Movies
 
Mattel pitch brief
Mattel pitch briefMattel pitch brief
Mattel pitch brief
 
Lo 1 model text only
Lo 1 model text onlyLo 1 model text only
Lo 1 model text only
 
픽사템플릿 거의마지막
픽사템플릿 거의마지막픽사템플릿 거의마지막
픽사템플릿 거의마지막
 
Market analysis for (Marvel Entertainment)
Market analysis for  (Marvel Entertainment)Market analysis for  (Marvel Entertainment)
Market analysis for (Marvel Entertainment)
 

Similar to Rizal B

Drop ship commerce magento webinar
Drop ship commerce magento webinarDrop ship commerce magento webinar
Drop ship commerce magento webinarDropShipCommerce
 
March 20 digital signage tampa lyle bunn
March 20 digital signage tampa lyle bunnMarch 20 digital signage tampa lyle bunn
March 20 digital signage tampa lyle bunnabbyfavali
 
March 20 digital signage tampa lyle bunn
March 20 digital signage tampa lyle bunnMarch 20 digital signage tampa lyle bunn
March 20 digital signage tampa lyle bunnabbyfavali
 
Conquering The Omnichannel Arena
Conquering The Omnichannel ArenaConquering The Omnichannel Arena
Conquering The Omnichannel ArenaG3 Communications
 
Future of Marketing MBA Lecture - Part One
Future of Marketing MBA Lecture - Part OneFuture of Marketing MBA Lecture - Part One
Future of Marketing MBA Lecture - Part OneIdris Mootee
 
RateGain - RezGain
RateGain - RezGainRateGain - RezGain
RateGain - RezGainnickrolle80
 
The Impact and Role of Cybermediaries in Retailing:
The Impact and Role of Cybermediaries in Retailing:The Impact and Role of Cybermediaries in Retailing:
The Impact and Role of Cybermediaries in Retailing:madhurykhatun
 
The Impact and Role of Cybermediaries in Retailing: Implications for Global C...
The Impact and Role of Cybermediaries in Retailing: Implications for Global C...The Impact and Role of Cybermediaries in Retailing: Implications for Global C...
The Impact and Role of Cybermediaries in Retailing: Implications for Global C...madhurykhatun
 
Med Week Final - Arete Leadership Consulting
Med Week Final - Arete Leadership ConsultingMed Week Final - Arete Leadership Consulting
Med Week Final - Arete Leadership ConsultingALC
 
Acxiom presentation to Forrester Marketing Forum Nov 2009
Acxiom presentation to Forrester Marketing Forum Nov 2009Acxiom presentation to Forrester Marketing Forum Nov 2009
Acxiom presentation to Forrester Marketing Forum Nov 2009Tim Suther
 
Acxiom - Forrester EMEA Marketing Forum 11-18-09
Acxiom - Forrester EMEA Marketing Forum 11-18-09Acxiom - Forrester EMEA Marketing Forum 11-18-09
Acxiom - Forrester EMEA Marketing Forum 11-18-09Acxiom Corporation
 
Samsung Re positioning Strategy
Samsung Re positioning Strategy Samsung Re positioning Strategy
Samsung Re positioning Strategy Zeeshan Ali
 
VANCL: China's internet apparel giant
VANCL: China's internet apparel giantVANCL: China's internet apparel giant
VANCL: China's internet apparel giantMatt Hunter
 
Word of Mouth Marketing: The Stats, Strategies & Trends You Need to Know
Word of Mouth Marketing: The Stats, Strategies & Trends You Need to KnowWord of Mouth Marketing: The Stats, Strategies & Trends You Need to Know
Word of Mouth Marketing: The Stats, Strategies & Trends You Need to KnowBSI
 
Beyond Click-Through Rates: Measurement and Mobile
Beyond Click-Through Rates: Measurement and MobileBeyond Click-Through Rates: Measurement and Mobile
Beyond Click-Through Rates: Measurement and MobileJohn Egan
 
Presentation by Georgetown University - Runner Ups in the CBS Case Competitio...
Presentation by Georgetown University - Runner Ups in the CBS Case Competitio...Presentation by Georgetown University - Runner Ups in the CBS Case Competitio...
Presentation by Georgetown University - Runner Ups in the CBS Case Competitio...CBS Case Competition
 
The Role of Social Media in the Hotel Industry
The Role of Social Media in the Hotel IndustryThe Role of Social Media in the Hotel Industry
The Role of Social Media in the Hotel IndustryJDA Software
 

Similar to Rizal B (20)

Drop ship commerce magento webinar
Drop ship commerce magento webinarDrop ship commerce magento webinar
Drop ship commerce magento webinar
 
Kodak strategy
Kodak strategyKodak strategy
Kodak strategy
 
March 20 digital signage tampa lyle bunn
March 20 digital signage tampa lyle bunnMarch 20 digital signage tampa lyle bunn
March 20 digital signage tampa lyle bunn
 
March 20 digital signage tampa lyle bunn
March 20 digital signage tampa lyle bunnMarch 20 digital signage tampa lyle bunn
March 20 digital signage tampa lyle bunn
 
Conquering The Omnichannel Arena
Conquering The Omnichannel ArenaConquering The Omnichannel Arena
Conquering The Omnichannel Arena
 
B2B Marketing - Black & Decker Case
B2B Marketing - Black & Decker CaseB2B Marketing - Black & Decker Case
B2B Marketing - Black & Decker Case
 
English
EnglishEnglish
English
 
Future of Marketing MBA Lecture - Part One
Future of Marketing MBA Lecture - Part OneFuture of Marketing MBA Lecture - Part One
Future of Marketing MBA Lecture - Part One
 
RateGain - RezGain
RateGain - RezGainRateGain - RezGain
RateGain - RezGain
 
The Impact and Role of Cybermediaries in Retailing:
The Impact and Role of Cybermediaries in Retailing:The Impact and Role of Cybermediaries in Retailing:
The Impact and Role of Cybermediaries in Retailing:
 
The Impact and Role of Cybermediaries in Retailing: Implications for Global C...
The Impact and Role of Cybermediaries in Retailing: Implications for Global C...The Impact and Role of Cybermediaries in Retailing: Implications for Global C...
The Impact and Role of Cybermediaries in Retailing: Implications for Global C...
 
Med Week Final - Arete Leadership Consulting
Med Week Final - Arete Leadership ConsultingMed Week Final - Arete Leadership Consulting
Med Week Final - Arete Leadership Consulting
 
Acxiom presentation to Forrester Marketing Forum Nov 2009
Acxiom presentation to Forrester Marketing Forum Nov 2009Acxiom presentation to Forrester Marketing Forum Nov 2009
Acxiom presentation to Forrester Marketing Forum Nov 2009
 
Acxiom - Forrester EMEA Marketing Forum 11-18-09
Acxiom - Forrester EMEA Marketing Forum 11-18-09Acxiom - Forrester EMEA Marketing Forum 11-18-09
Acxiom - Forrester EMEA Marketing Forum 11-18-09
 
Samsung Re positioning Strategy
Samsung Re positioning Strategy Samsung Re positioning Strategy
Samsung Re positioning Strategy
 
VANCL: China's internet apparel giant
VANCL: China's internet apparel giantVANCL: China's internet apparel giant
VANCL: China's internet apparel giant
 
Word of Mouth Marketing: The Stats, Strategies & Trends You Need to Know
Word of Mouth Marketing: The Stats, Strategies & Trends You Need to KnowWord of Mouth Marketing: The Stats, Strategies & Trends You Need to Know
Word of Mouth Marketing: The Stats, Strategies & Trends You Need to Know
 
Beyond Click-Through Rates: Measurement and Mobile
Beyond Click-Through Rates: Measurement and MobileBeyond Click-Through Rates: Measurement and Mobile
Beyond Click-Through Rates: Measurement and Mobile
 
Presentation by Georgetown University - Runner Ups in the CBS Case Competitio...
Presentation by Georgetown University - Runner Ups in the CBS Case Competitio...Presentation by Georgetown University - Runner Ups in the CBS Case Competitio...
Presentation by Georgetown University - Runner Ups in the CBS Case Competitio...
 
The Role of Social Media in the Hotel Industry
The Role of Social Media in the Hotel IndustryThe Role of Social Media in the Hotel Industry
The Role of Social Media in the Hotel Industry
 

More from Rizalul D Pasundani (9)

Nusantara consulting final global review
Nusantara consulting final global reviewNusantara consulting final global review
Nusantara consulting final global review
 
Rizalul Durrun
Rizalul DurrunRizalul Durrun
Rizalul Durrun
 
Rizal A
Rizal ARizal A
Rizal A
 
Rsmba at kearney nitin
Rsmba at kearney nitinRsmba at kearney nitin
Rsmba at kearney nitin
 
Atk presentation-sunil
Atk presentation-sunilAtk presentation-sunil
Atk presentation-sunil
 
ADIT A
ADIT AADIT A
ADIT A
 
ADIT C
ADIT CADIT C
ADIT C
 
ADIT D
ADIT DADIT D
ADIT D
 
ADIT B
ADIT BADIT B
ADIT B
 

Rizal B

  • 1. Marvel Entertainment Inc. The Future of Entertainment Group B-9 Fang-Chi Chang, Manuel Pineros, Christina Radcliffe, Dov Rivkin, Itaru Shiraishi.
  • 2. Marvel Entertainment Inc. Agenda 1. Background and current model 2. Lines of Business 3. Sustainability of current model and life cycle 4. Management challenges 5. Marvel’s brand equity 6. Hasbro and Marvel Studios deals 7. Free Cash Flows and options for growth 8. International expansion 9. Online community 10.Implications 11.Q&A
  • 3. What is at the core of Marvel? 1939 2006 Intellectual Property High Margins = & Low Risk Low Capital Licensing Expenditure
  • 4. Marvel Entertainment Inc. 1. Background and current model 2. Lines of Business 3. Sustainability of current model and life cycle 4. Management challenges 5. Marvel’s brand equity 6. Hasbro and Marvel Studios deals 7. Free Cash Flows and options for growth 8. International expansion 9. Online community 10.Implications 11.Q&A
  • 5. Performance Evaluation - Licensing 70.0% Size Largest and fastest growing division 63.1% 2005 (from 19.3% of total sales in 2003 to 60.0% 2004 59% in 2005) 50.0% 43.0% Margins 62% 40.0% 31.4% Competitors Time Warner (DC Comics), Walt 30.0% Disney, NBC Universal 20.0% 15.9%15.5% 10.7% 10.3%10.0% 10.0% Market ~9% share 0.0% Domestic International Spider-Man LLP Studios Consumer Consumer Strategy Best-in-class sole-partners Products Products Advantages Disadvantages Challenges •Low risk •Short-term deals •New technology •Robust business •Final prices are set by distributors •Better royalty schemes model •Legal issues between Marvel and (from flat to Equity •High margins partners Participation) •Focus on the core •Limited by the “mindshare” it is able to business develop in the consumers •Limited by the creativity of licensees
  • 6. Performance Evaluation - Publishing Size Second largest in terms of revenue Customers - Male well educated teens 13-23 Market Share - Collectors 27% Competitors DC Comics 40% Key Success - Quality content Factors - Relationship with retailers Industry - Low barrier to entry - High power of retailers Marvel 33% DC Comics - High substitution Others - High switching costs Advantages Disadvantages Challenges •Customer loyalty •Narrow demographic •Channel management •Rich characters •Few “stars” •Readership expansion •Multiple versions •Internet exploitation •Creating new “stars” •Sustaining “stars” Source: DC Comics Website, Marvel Annual Report 2005
  • 7. Performance Evaluation - Toys Global Toys & Games Size Smallest in terms of revenue Market Segmentation Customers - Children 4-12 9.8% - Collectors 64.7% Competitors - Mattel - Jakks Pacific Key Success - Quality design Factors - Successful movies 25.5% Industry -Intense rivalry Traditional Games software -Short lifecycles Games consoles Advantages Disadvantages Challenges •Appeal to younger •Licensee risk •Decrease volatility segment •Concentrated retailers •Licensee •Raise new •Influenced by movies management generation of fans Source: Datamonitor, Marvel Annual Report 2005
  • 8. Marvel Entertainment Inc. 1. Background and current model 2. Lines of Business 3. Sustainability of current model and life cycle 4. Management challenges 5. Marvel’s brand equity 6. Hasbro and Marvel Studios deals 7. Free Cash Flows and options for growth 8. International expansion 9. Online community 10.Implications 11.Q&A
  • 9. Can the current model continue to deliver? After the turnaround, Marvel is 2006 is expected to be a rough financially healthy year, but the current pipeline is promising Analysts perceive that the current business model has potential and can continue to deliver, we agree
  • 10. Where do Marvel’s businesses stand? Publishing & Traditional Toys Licensing
  • 11. Marvel Entertainment Inc. 1. Background and current model 2. Lines of Business 3. Sustainability of current model and life cycle 4. Management challenges 5. Marvel’s brand equity 6. Hasbro and Marvel Studios deals 7. Free Cash Flows and options for growth 8. International expansion 9. Online community 10.Implications 11.Q&A
  • 12. Management Challenges Globalization • New market opportunities • International presence • IP protection and management Challenges for Growth Growth and Strategic Alignment • Cultural traditions of comics • Acquisition opportunities • Identify vision clearly • New technologies • Build brand equity • Strengthen and balance character portfolio Product Portfolio • Mine character library • No new characters • International expansion • Dependence on superheroes • Few “cash cows” • Appeal to new markets • Segmentation
  • 13. Marvel Entertainment Inc. 1. Background and current model 2. Lines of Business 3. Sustainability of current model and life cycle 4. Management challenges 5. Marvel’s brand equity 6. Hasbro and Marvel Studios deals 7. Free Cash Flows and options for growth 8. International expansion 9. Online community 10.Implications 11.Q&A
  • 14. Marvel’s Brand Equity Company Vision Intellectual Property Company Entertainment Company • Focus on character branding • Focus on corporate branding • Concentrate on developing characters • Concentrate on developing brand • Low involvement in non-core value • High involvement/extension of value chain chain • Limited use of technology • Heavy use of technology A company must have a clear vision to position and brand itself for success
  • 15. Building Brand Equity Growing brand equity Make Marvel a household name • Focus on developing creativity • Differentiate image • Develop associations with the brand MARVEL CHARACTER • Build a global brand Resonance Challenges Judgments Imagery CHARACTER • Brand Dilution • IP Management Performance Feelings • Competition MARVEL Salience Building Brand Equity Allows to Capitalize on IP for Future Revenues
  • 16. Marvel Entertainment Inc. 1. Background and current model 2. Lines of Business 3. Sustainability of current model and life cycle 4. Management challenges 5. Marvel’s brand equity 6. Hasbro and Marvel Studios deals 7. Free Cash Flows and options for growth 8. International expansion 9. Online community 10.Implications 11.Q&A
  • 17. Is Hasbro deal beneficial for Marvel? Revenues coming from $205 million in royalty and service fee payments ($70 million, Spider-Man 3; $35 million, Spider-Man 4) Hasbro is a strong partner •Second largest toy maker in U.S. •U.S. is the largest toy market •Benefit from Hasbro’s knowledge •Could become just “one more” in about the U.S. market Hasbro’s portfolio •Focus on Marvel’s creativity and •Efforts may be limited to advisory skills  theatrical releases  • Focus on technologically advanced products • Develop toys & games with cross cultural appeal The deal is financially sound and allows to focus on core business
  • 18. What potential does Marvel Studios have? Film Facility allows to minimizes risk while venturing into a potentially profitable area Marvel Facility Backed Films (2008) 10 Titles (Captain America) •Script writing know-how •Lesser known superheroes •Develop in-house film expertise •Characters limited to superheroes •Marvel movies historically profitable  •Alienating core followers  Company Market Cap PER 45% 40% 35% 30% 25% 2004 Marvel 1,720.00 20.74 % 20% 2005 15% 10% Pixar 7,462.00 48.8 Pixar (Adj) 6,422.00 41.99 5% 0% ROE ROA ROE ROA ROE ROA ROE ROA Marvel Pixar Pixar Cash Adjusted Disney Disney 52,036.00 21.44 Note: ROE and ROA for Marvel and Disney are not adjusted with their cash positions In-house production can be profitable by building awareness of lesser- known characters
  • 19. Marvel’s Spiderman potential Superman Spider-Man Superman II Spider-Man 2 Superman III Spider-Man 3 Superman 4 Men in Black Superman Returns Men in Black 2 Superman Returns Sequel X-Men Batman X2 Batman Returns X-Men 3: The Last Stand Batman Forever Batman & Robin Fantastic Four Batman Begins Fantastic Four 2 Batman Begins Sequel (1978-2006) (1986-2006) Worldwide Gross Budget Worldwide Gross Budget Total $2,845,830,804 $1,249,000,000 $4,618,248,551 $1,820,500,000 Average $177,864,425 $89,214,286 $307,883,237 $101,138,889 • Gross returns from movies for Marvel average over 60% • Spiderman can continue to deliver revenues
  • 20. Marvel Entertainment Inc. 1. Background and current model 2. Lines of Business 3. Sustainability of current model and life cycle 4. Management challenges 5. Marvel’s brand equity 6. Hasbro and Marvel Studios deals 7. Free Cash Flows and options for growth 8. International expansion 9. Online community 10.Implications 11.Q&A
  • 21. Options for growth Marvel’s performance over the past 5 years •Divested non-core businesses •Improved and expanded licensing agreements •Strong characters continue to generate cashflows •Focusing on a model that requires low capital investment Estimated free cash flows of ~$300 Million in 2006-2007 How can Marvel use these cash flows to increase shareholder value? •Expanding the Marvel Universe •Acquiring other Comics (Entertainment) Company •Expanding into new lines of business (online community) •Expanding to other markets (e.g. Japan) •Further share buybacks or paying dividends
  • 22. Moving towards introductory stage Consoles & Online Games Licensing Online communities Movies International Expansion Strategy
  • 23. Marvel Entertainment Inc. 1. Background and current model 2. Lines of Business 3. Sustainability of current model and life cycle 4. Management challenges 5. Marvel’s brand equity 6. Hasbro and Marvel Studios deals 7. Free Cash Flows and options for growth 8. International expansion 9. Online community 10.Implications 11.Q&A
  • 24. International Expansion Strategies Japanese Key Reasons: •Major footprint in the region Market •Relative low piracy level •High technology penetration: a test market for the US and Europe Key Facts(1):  US$17 billion manga, anime and related video games Hello Kitty, Cinnamoroll  US$14 billion character merchandise sales  75 anime broadcast/ week (2001)  748 million comic books printed (2002)  3.2 billion comic magazine print (2002) Possible Targets (market capitalization): Sanrio ($1,348MM) Takara-Tomy ($687MM) Bandai-Namco ($3,650MM) 3/2006 PER (estimate): 30.81 Financing option: Treasury stock Operational Income Breakdown (3/2007 estimate) Access and Gain following: • Character library • New demographic segments • Client relationship • Anime management know-how • Market knowledge Note: (1) JAPA http://www.ppp.am/ppp_shiryou_data.html
  • 25. Successful superheroes across regions? USA China Inframan Europe India Agent 327 Adaptation is necessary to transfer popular culture figures such as comics http://www.internationalhero.co.uk/nonus.htm
  • 26. Marvel Entertainment Inc. 1. Background and current model 2. Lines of Business 3. Sustainability of current model and life cycle 4. Management challenges 5. Marvel’s brand equity 6. Hasbro and Marvel Studios deals 7. Free Cash Flows and options for growth 8. International expansion 9. Online community 10.Implications 11.Q&A
  • 27. How technology is changing entertainment? “57% of American teenagers create contents on the Internet(1)” Capitalizing on Online Talents Marvel Online Platform TM (easy to use, create and socialize) Provide platform for participants Select to create Participants Evaluate Contact those characters, create the quality candidates with high stories and characters of characters for possible access rates, socialize and stories and stories contracts hits and traffic Note: (1) “Pew Internet and American Life project”, http://www.pewinternet.org/pdfs/PIP_Teens_Content_Creation.pdf
  • 28. Capitalizing on technological changes Marvel Online Platform TM (easy to use, create and socialize) •Bring in those creative minds and talents into Marvel Fee Revenues •Provide professional assistance to develop them Marvel Marvel Partners: Entertainment Studios e.g. Microsoft NPV of first five years $1,324,688 Publications Films Video games Increased shareholder value Note: (1) “Pew Internet and American Life project”, http://www.pewinternet.org/pdfs/PIP_Teens_Content_Creation.pdf
  • 29. Marvel Entertainment Inc. 1. Background and current model 2. Lines of Business 3. Sustainability of current model and life cycle 4. Management challenges 5. Marvel’s brand equity 6. Hasbro and Marvel Studios deals 7. Free Cash Flows and options for growth 8. International expansion 9. Online community 10.Implications 11.Q&A
  • 30. Implications Implications Risks Risk Mitigation Strategy Marvel Studios Potentially large •Unpredictable •Recruiting creative revenues and outcome of films talents profits •Venturing into •Building inexperienced field awareness for lesser-known characters Toy Business with •Eliminate risk •Dependence on •Monitor and Hasbro •Maximize profit Hasbro distribution advise on character through Hasbro's •Brand management wider retail network mismanagement
  • 31. Implications Implications Risks Risk Mitigation Strategy Acquisition ・ International •Cultural fit ・ Respect the cultural expansion •Large financial commitment differences ・ New segments •Integration ・ New markets ・ Client relationships ・ Know-how Online ・ Tap into unlimited ・ Technological changes ・ Joint venture with a strong Community talents ・ Financial commitment technology partner ・ Additional revenue ・ Intellectual property rights ・ Retain content property with ・ Raising Marvel profile disclaimer
  • 34. Financial projection and Free Cash flows Income Statement 2003A 2004A 2005A 2006E 2007E Sales 348 513 391 341 460 Licensing 189 215 230 - - Publishing 73 86 92 - - Toys 85 213 68 - - Cost of Goods Sold 79 160 51 79 107 Depreciation, Depletion & Amortization 4 4 5 5 5 Selling, General & Admin Expenses 109 143 166 166 166 Total Operating Expenses 193 306 222 250 278 Other Income/Expense - Net 1 9 2 4 5 Equity in net income of joint venture 11 8 0 0 0 Operating Income 167 224 171 95 187 Interest income 2 3 4 3 3 Interest expense 19 20 4 16 16 Income before income tax and minority interest 150 207 171 82 175 Income tax (expense) benefit 1 (65) (63) (30) (64) Tax rate 31.24% 36.73% 36.73% 36.73% Minority interest in consolidated joint venture 0 (17) (5) (8) (10) Net income 152 125 103 44 100 Less: prefered stock dividends 1 0 0 0 0 Net income attributable to common stock 150 125 103 44 100 Free cash flow EBIT 171 95 187 Depreciation 5 5 5 Changes in Working capital 10 4 (9) Free cashflow 185 104 183 Source: Annual Report, CNNmoney.com, Yahoo Finance * COGS is calculated from the from the average sales ratio of previous three years **Depreciation, SGA, Other income, interest income and tax rate are kept at the same level from 2005 *** Interest income, Other income,
  • 35. Online platform – estimated cash flow • Should be launched in the US home market • Revenue model – monthly subscription • Additional motives to subscribe: opportunity to interact with Marvel designers, potential to sell their characters to Marvel or even sign a contract • Possibility to raise price in the future (audience is not price sensitive) year 1 year 2 year 3 year 4 year 5 Annual growth rate 50% subscribers 15,000 22,500 33,750 50,625 75,938 fee/month $14.95 $14.95 $17.95 $17.95 $17.95 annual revenues $2,691,000 $4,036,500 $7,269,750 $10,904,625 $16,356,938 annual costs $500,000 $500,000 $500,000 $500,000 $500,000 annual cash flow ($18,000,000) $2,191,000 $3,536,500 $6,769,750 $10,404,625 $15,856,938 Break Even Discount rate 20% NPV $1,324,688 Intangible benefits: • Increased brand awareness • Potential for new talents • Access to new segment of customers • Potential revenue source from online advertisement • Learn consumer preferences
  • 36. Sales Revenue USA   (dollars in millions) 2003 2004 2005 2003 2004 2005 Licensing 106.3 173.8 182 37% 45% 59% Publishing 61.3 72.8 77.3 Percentage 21% 19% 25% Toys 118.7 140.1 47.7 41% 36% 16% Total 286.3 386.7 307 100% 100% 100% Foreign Licensing 18.2 40.9 48.1 30% 32% 58% Publishing 11.9 13.2 15.1 19% 10% 18% Percentage Toys 31.2 72.7 20.3 51% 57% 24% Total 61.3 126.8 83.5 100% 100% 100% Total Licensing 124.5 214.7 230.1 36% 42% 59% Publishing 73.2 86 92.4 21% 17% 24% Percentage Toys 149.9 212.8 68 43% 41% 17% Total 347.6 513.5 390.5 100% 100% 100%
  • 37. Percentage of sales revenue from USA Licensing     2003 2004 2005 USA 85% 81% 79% Foreign 15% 19% 21% Publishing     2003 2004 2005 USA 84% 85% 84% Foreign 16% 15% 16% Toy     2003 2004 2005 USA 79% 66% 70% Foreign 21% 34% 30%
  • 38. Operating Income Margins Licensing (dollars in millions) 2003 2004 2005 Net Sales 124.4 214.7 230.1 Operating Income 83.2 152.7 143.4 Operating Income Margins 67% 71% 62% Publishing (dollars in millions) 2003 2004 2005 Net Sales 73.3 86.0 92.4 Operating Income 25.5 37.3 36.3 Operating Income Margins 35% 43% 39% Toy (dollars in millions) 2003 2004 2005 Net Sales 149.9 212.8 68.0 Operating Income 77.9 58.1 15.5 Operating Income Margins 52% 27% 23%
  • 39. Marvel’s Movies and TV Pipeline Feature Films (2006)  3 Titles (X-Men 3,Ghost Rider, The Punisher 2) + Films in Development (2007)  10 (Spider Man 3, Fantastic Four 2) + Marvel Facility Backed Films (2008)  10 Titles (Captain America) + Direct-to-Video  4 releases starting in 2006 (Ultimate Avengers) Animated TV  1 release (Fantastic Four) Live Action TV  3 releases (Alter Ego, Blade) + Video Games  8 releases over 2005-06 (Activision deal through 2017)
  • 40. Financials - ROA & ROIC
  • 41. Financials - ROA & ROIC Comics, Graphic Novel, & Magazine Publisher Other Non-top 20 , 4.81% Small Size (2% to .24%), 10.11% IDW Publishing, 2.02% Tokyopop, 2.86% Marvel Comics, 39.56% Image Comics, 3.36% Dark Horse Comics, 4.61% DC Comics, 32.67% Source: http://www.diamondcomics.com/market_share.html
  • 42. Financials - ROA & Operating Margins MARVEL - ROA (1996 - 2005) 60 40 20 0 -20 -40 1996 1997 1998 1999 2000 2001 2002 2003 2004 2005 Return On Assets 11.01 -16.86 -17.54 -1.84 -10.51 4.42 9.72 31.69 18.27 15.46 Operating Profit Margin 12.28 -32.68 -1.12 0.08 -15.49 0.63 21.86 44.57 41.14 46.48 Source: Thomson
  • 43. Financials - Operating Income per LOB Operating Income per Business Units 100% 80% 60% 40% 20% 0% -20% -40% 2001 2002 2003 2004 2005 Licensing 5,200 69,400 139,400 152,700 143,400 Toys -5,800 8,900 77,905 58,100 15,500 Publishing 14,500 19,600 25,400 37,300 36,300
  • 44. Financials - Revenues by Region Licensing Revenues by Geographic Region Publishing Toys 200 MIllions 180 160 140 120 100 80 60 40 20 0 US Foreign US Foreign US Foreign 2003 2004 2005
  • 45. Financials - Licensing Sales Licensing Sales by Division 250 230.1 214.7 200 150 145.3 92.4 100 2004 67.5 2005 33.3 36.5 50 24.7 21.5 23.6 0 Domestic International Spider Man Studios Total Consumer Consumer L.P. Products Products
  • 46. Financials - Licensing by Category Licensing Sales by Category 70 60 50 40 2004 30 2005 20 10 0 Apparel and Entertainment Toy Royalties Other (Domestics, Accessories food and other)
  • 47. Movies: Spider-man vs. Batman 1st  Worldwide  Released    Movie Name    Weekend    US Gross    Gross    Budget    5/3/2002 Spider-Man $114,844,116 $403,706,375 $821,700,000 $139,000,000 6/30/2004 Spider-Man 2 $88,156,227 $373,524,485 $783,924,485 $200,000,000 5/4/2007 Spider-Man 3 - - - $250,000,000 Totals $777,230,860 $1,605,624,485 $589,000,000 Averages $388,615,430 $802,812,243 $196,333,333 1st  Worldwide  Released    Movie Name    US Gross    Budget    Weekend    Gross    6/23/1989 Batman $40,505,884 $251,188,924 $413,200,000 $35,000,000 6/19/1992 Batman Returns $45,687,710 $162,833,635 $282,801,937 $80,000,000 12/25/1993 Batman: Mask of the  $1,406,291 $5,617,391 - - Phantasm 6/16/1995 Batman Forever $52,784,433 $184,031,112 $335,000,000 $100,000,000 6/20/1997 Batman & Robin $42,872,605 $107,325,195 $237,300,000 $125,000,000 6/15/2005 Batman Begins $48,745,440 $205,343,774 $371,824,647 $150,000,000 12/31/2008 Batman Begins  - - - - Sequel Totals $916,340,031 $1,645,743,975 $490,000,000 Averages $152,723,339 $274,290,663 $98,000,000 Source: http://www.diamondcomics.com/market_share.html
  • 48. Management of Intangible Assets “Creativity” Cross-Culture  Product Segment Database  & + of   Cross-Boundary  Customer Segment Story Resources Market Research • Freelancer Network  Pool of Talents of  • Designer • Drawer Talents • Talent Storyteller Matching  Creative Story Talents & Story Adjustment
  • 49. Sanrio (TSE: 8136) Sanrio Co. (TSE:8136) Divisional Income statement Library includes: Overseas sales Hello Kitty, Cinnamoroll # of characters Main lines of business: Strength: Licensing, Overseas Weakness: theme parks, toy merchandising Other Possible Targets Sanrio Financial Data (115 yen/$) MM Yen MM $US (market capitalization): Share Price (4/25/2006) 1,785 15.52 Takara-Tomy ($687MM) Market Capitalization(4/25/2005) 154,965 1,348 Bandai-Namco ($3,650MM) Total Debt (12/2005) 39,983 348 Revenue 102,400 890 Operating Profit (2005E) 9,200 80 Financing option: Licensing Profit (2005E) 8,700 76 Net Income (2005E) 4,700 41 Treasury stock Estimated 2006 EPS 56.7 0.49 LBO Estimated 2007 EPS 51.1 0.44 Ratios D/E Ratio 1.28 Estimated 2006 PER 31.48 Estimated 2007 PER 34.93 * Note: 2005E is fiscal year ending March 2006 Note: (1) JAPA http://www.ppp.am/ppp_shiryou_data.html
  • 50. Marvel & Licensing industry 2005 2004 2003 Net Sales 230.1 214.7 124.4 Cost of sales 0 0 0 59.0% SG&A 87.1 70 52.5 Operating Income 143 152.7 83.2 41.8% Margins 62% 71% 67% 35.8% 19.3% Estimated Licensing Revenues by Property Type (2004) in $million (source: LIMA) 2005 2004 2003 2002 Estimated Revenues of Entertainment/Character Properties by Product Category (2004) 6.5% 14% 10.5% 24%
  • 51. Major US Titles Source: http://www.igda.org/online/IGDA_PSW_Whitepaper_2004.pdf
  • 52. •By 2008 we forecast the usage of online games will be 35 billion hours a year •PC pay revenue is the biggest revenue stream •Pay revenue is money paid by consumers for subscriptions etc; ad revenue is money from advertising, sponsorships, e-commerce royalties etc •even as usage and revenues from online games soars, profits are likely to be elusive. In fact, most companies in the online game market are likely to lose money over the next five year Source: http://www.dfcint.com/game_article/june03article.html
  • 53. Economics of Online games There has been little or no correlation between the level of success and the size of the  investment Subscription revenues make for an attractive business case and are necessary to provide  a return on the high costs of development and ongoing operations if a game has over 100,000 subscribers it is not hard to realize 25+% net profit on  subscriptions and if it is over 200k, 40% is possible. Conversely, a game of 50,000  subscribers may only have a 10% net profit. Scale is clearly a significant issue in profitability, mainly because of the massive fixed  expenses required to build, launch and run this kind of business Budgets for online games range from $2MM up to $30MM and higher By far the most common method for funding OL games is through publisher funding.  Indeed, most MMORPGs have been not only funded by publishers but also developed  by their in-house studios A small number of titles have been developed externally with Publisher funding, notably  City of Heroes, developed by Cryptic Studios and published by NCsoft, and the  Asheron’s Call games developed by Turbine and published by Microsoft. A few developers have had success in raising substantial venture capital investments,  notably: Linden Labs ($8MM Oct 2004), Turbine ($18MM Dec 2003, at least $10MM  in earlier rounds), Mythic ($32MM 2003, at least $3MM in earlier rounds), There.com  (over $30MM in various rounds) and Artifact Entertainment (at least $10MM in  various rounds, including $5MM from NCsoft). Raising VC is extremely difficult, and  most of the above developers had established their skills and credibility by working  with publishers before raising capital
  • 54. Revenue models At present, and for the foreseeable future, the primary revenue source for  persistent online games, at least in the U.S., is the monthly subscription Subscription pricing has increased steadily from the early days of the web.  Simutronics' play.net site was one of the early subscription-based models,  charging $9.95/month in 1997. Ultima Online, launched in 1998, followed  suit, also charging $9.95. Today, prices tend to range between $10 & $15  per month, with $14.95 seeming to be the most popular price point Gaming audience, once they are already signed up to a game, does not  appear to be particularly price sensitive. Indeed, it has proven possible to  raise prices on customers without suffering substantial attrition; in 2001,  Funcom and Mythic launched their titles at $12.95 per month, and in 2002,  Sony Online Entertainment raised the monthly price of EverQuest from  $9.89 to $12.95, with virtually no increase in customer churn as a result.  Ultima Online and Funcom’s Anarchy Online raised rates as well. Additional options: Revenue Generation from Services Virtual Goods Sales article in Economist

Editor's Notes

  1. Marvel Comics was founded by established pulp-magazine publisher Martin Goodman in 1939 as an eventual group of subsidiary companies under the umbrella name Timely Comics . Like other comics companies, Timely — generally known as Atlas Comics in the 1950s — followed pop-cultural trends with a variety of genres The first comic book labeled Marvel Comics was the science-fiction anthology Amazing Adventures #3, which showed the "MC" box on its cover. Cover-dated Aug. 1961, it was published May 9, 1961, according to Library of Congress copyright information. [1] . 1960’s - The most successful new series was The Amazing Spider-Man , by Stan Lee and Steve Ditko . The Marvel of the 1960s was in its own way the counterpart of the French New Wave .... Marvel was pioneering new methods of comics storytelling and characterization, addressing more serious themes, and in the process keeping and attracting readers in their teens and beyond. Moreover, among this new generation of readers were people who wanted to write or draw comics themselves , within the new style that Marvel had pioneered, and push the creative envelope still further." 1970’s - An attempt by Marvel to buy DC was frustrated by DC's refusal to sell its entire library of characters (wanting to retain control of Superman and Batman ), and DC was sold to Warner Communications instead. In 1988, Marvel was bought by investor/entrepreneur Ronald Perelman, who took the company public on the New York Stock Exchange, and oversaw a great increase in the number of titles the company published. As part of the process, Marvel Productions sold its back catalog to Saban Entertainment, and Marvel management closed the animation studio, opting to outsource. Creatively and commercially, the '90s were dominated by the use of gimmickry to boost sales, such as variant covers , cover enhancements and regular company-wide crossovers that threw the universe's continuity into disarray. By the 1980s, one-time wunderkind Jim Shooter was Marvel's Editor-in-Chief. Although a controversial personality, Shooter cured many of the procedural ills at Marvel (including repeatedly missed deadlines) and oversaw a creative renaissance at the company. With the new millennium, Marvel Comics escaped from bankruptcy and again began diversifying its offerings. Regardless, Marvel has also become a key player in Hollywood, with many of its characters being turned into successful film franchises, the highest-grossing being those of the X-Men , starting in 2000, and Spider-Man , beginning in 2002.
  2. Licensing segment is responsible for the merchandising, licensing and promotion of Marvel’s characters worldwide and represents 59% of company’ sales in 2005 Licensing strategy of Marvel: best-of-class licensees in US and around the world (from ~550 in 2004 to ~800 in 2005) negotiating higher guaranteed royalty amounts from each licensee due to exclusivity create programs for classic brands beyond single characters (Marvel Heroes, etc.) major entertainment events play an important role in driving sales of licensed products (blockbuster movies, etc.) sole-partner strategy Keep control over its properties Margins are very high The Licensing segment competes with a diverse range of entities that own intellectual property rights in characters. These include DC Comics (a subsidiary of Time Warner, Inc.), The Walt Disney Company, NBC Universal, Inc. (a subsidiary of General Electric Company) and other entertainment-related entities Licensees: Studios – Sony, Fox, Lions Gate DVD and Direct-to-Video – Lions Gate TV – Moonscoop SAS, Warner brothers Video Games and On-line games – Activision, Microsoft Mobile content – Hands-On (Mforma) Clothing and Sport Equipment– Kids Headquarters , Mad Engine, K2, Sara Lee Toys – Hasbro, Toy Biz Worldwide, Mega Bloks Personal Care – Gilette Oral B Food – Unilever, BrandSource Giftware - Hallmark Theme parks – Universal, Niagara Group “ For instance, Blade and Men in Black generated over $1B worldwide across all products, but because of their lower popularity, Marvel sold the deals for a much lower amount of cash upfront. Marvel should look for these smaller movies to increase their participation to the equity level. Artisan Entertainment’s upcoming movie called The Punisher (based on the Marvel character and starring John Travolta) is Marvel’s first equity participation deal.”
  3. Low capital requirement  Easy entry Internet and other media threaten all printed publications Publishing For the years ended December 31, 2000, 2001 and 2002, approximately 9%, 10% and 14%, respectively, of Marvel Publishing’s net revenues were derived from sales to the mass market. The increase in 2002 was due partly to increased demand for, and an aggressive push by the Company of, trade paperbacks to the bookstore market. This business, which puts trade paperbacks into the mass market and in front of general consumers, grew more than fivefold from 2001 to 2002. The Company believes that there is still a great deal of growth in this market for these products, and that this is one of the better ways to attract new readers to Marvel Publishing. Publishing growth in 2005 was largely due to the expansion of the Company’s core product lines of comics and trade paperbacks in the direct market and bookstores. The Company expects continued growth from the direct market and bookstores in 2006. The Publishing segment is also focused on expanding distribution to new channels, such as the mass market, and expanding its product line to a younger demographic. For example, in 2005 the Company expanded its distribution to 7-Eleven and Blockbuster retail stores. While these initiatives did not significantly impact 2005 publishing revenues, the Company believes that they provide a valuable opportunity to increase readership. Marvel’s Publishing segment is also in the process of expanding its advertising and promotions business with an increased emphasis on custom publishing.
  4. During 2004, the only line of products to account for more than 10% of the Company’s consolidated net revenue was the line of toys based upon the movie Spider-Man 2. In 2003, the only product line accounting for over 10% of the Company’s consolidated net revenue was toys based on the movie trilogy The Lord of The Rings . There was no such concentration in 2005. A disadvantage of producing products to order, however, is that the Toy segment increases its risk of having fewer products available, in the event of unforeseen demand, than might otherwise have been sold. In 2006, when the Company’s main toy categories will be manufactured and sold by the Company rather than by licensees, the Company will have higher inventory risk and may well end the year with more inventory than at the end of 2005. Pursuant to the terms of the termination of TBW’s license agreement, the Company purchased TBW’s existing domestic inventory of finished goods as of January 1, 2006 for approximately $6 million. The Toy segment competes with many larger toy companies in the design and development of new toys, in the procurement of licenses and for adequate retail shelf space for its products. The larger toy companies include Hasbro, Mattel Inc., and Jakks Pacific, Inc. Many of these competitors have greater financial and other resources than the Company. The toy industry's highly competitive environment continues to place cost pressures on manufacturers and distributors. Discretionary spending among potential toy consumers is limited and the toy industry competes for those dollars along with the makers of computers and video games. Toy-production delays or shortfalls, continued concentration of toy retailers and toy inventory risk . The retail toy business is highly concentrated. The three largest customers for our toy products accounted in the aggregate for approximately 48% of our total toy sales in 2005. An adverse change in, or termination of, the relationship between us or our major toy-producing licensee (Hasbro, starting in 2007) and one or more major customers could have a material adverse effect on us. In addition, the bankruptcy or other lack of success of one or more significant toy retailers could decrease our earnings. In 2006, when Marvel toys will be produced by us, rather than licensed to a third party, our production of excess products to meet anticipated retailer demand could result in markdowns and increased inventory carrying costs for us on even our most popular items. Also, if we underestimate demand for our products, we may be unable to provide adequate supplies of popular toys to retailers in a timely fashion, and may consequently lose sales opportunities. Toy revenues shifted in 2005 from lines for which Marvel records the wholesale value as sales, such as Spider-Man movie toys, to lines for which a royalty and service fee are recorded as sales, such as Fantastic Four toys. The main toy line in 2005 was Fantastic Four movie toys, which was produced by TBW under its Marvel license and for which only the royalty and service fee percentages of the wholesale sales price were recorded as revenue. Sales from the Toy segment decreased $144.8 million to $68.0 million in the year ended December 31, 2005, and also decreased as a percentage of total net sales, as sales of toys based on Spider-Man 2 decreased by $170.0 million in 2005 due to the movie’s release in June 2004 and limited carry forward into 2005. Sales of action figures and accessories based on the Lord of The Rings movies also declined $12.6 million to $7.7 million. These decreases were partially offset by an increase in royalty and service fee revenue from $15.2 million in 2004 to $51.8 million in 2005 derived from licensed toy sales made by TBW, primarily resulting from increased sales of toys based on the Fantastic Four movie and classic Spider-Man. Toy segment revenues increased by $62.9 million or 42% to $212.8 million (from $149.9 million in the 2003 period) and also increased as a percentage of total net sales. This increase was primarily due to growing sales of products based upon Spider-Man 2 (released in June 2004) which were produced by the Company (revenues for which were recorded based on the entire wholesale sales price). This increase offset a decline in royalty and service fee income derived from TBW’s sales of other action figures and accessories based on Marvel characters.
  5. Recent share buybacks sent out a clear message: Maximizing shareholder value is the top priority pushing up share price performance
  6. 80% revenues come from the US Biggest licensing and publishing divisions have smallest international presence (20% and 16%) Characters are “American” focused
  7. Pursue a long term strategy – repackaging characters is not enough! Must be dynamic and creative! Balance portfolio with additional intellectual property to mitigate risks, improve image and presence as an intellectual property company! Why build brand equity?? Capital produced by people who love what they are doing. How to get those people? Build reputation for something Branding – who do you want to be? Brand based on IP or entertainment company?? Must decide!! Strategy for branding is based on this Brand elements/identities that make up the brand: Action & Adventure Integration in supported marketing program: Movies and Merchandising Associations indirectly transferred to the brand: Characters No association with the brand + creativity in the long run with HR to increase talent HR – people behind the brand strong brand behind Marvel gets better talent Make use of concepts of action and adventure Truly global companies Image and entertainment continuum Character side and corporate slide Building corporate vs character Q ratings character recognition Creativity is part of entertainment and is Publishing is oldest part of business and core
  8. Growth stage: Increase money on product improvement – develop more creativity Spend heavily on promotion and use alternative distribution channels to create product awareness Pyramid factors: Intense loyalty Positive, Accessible Reactions Strong Favorable and Unique Brand Associations Deep Broad Brand Awareness Risks: Brand Dilution IP Management Develop positive associations with the brand – team up with Fear Factor for action and adventure Differentiate image to develop strong reputation for interesting stories and dynamic characters Focus on developing creativity to attract and build expertise in story lines
  9. Hasbro – 2007 – 2011 Corporate alignment: entertainment and intellectual capital Competition in retail market is fierce Traditional Toys & Games segment has been performing strong over the past few years, but growth is coming from the software and consoles
  10. In 1981 Marvel purchased the DePatie-Freleng Enterprises animation studio from famed Looney Tunes director Friz Freleng and his business partner David H. DePatie . The company was renamed Marvel Productions and it produced well-known animated TV series and movies featuring such characters as G.I. Joe , The Transformers , Jim Henson's Muppet Babies , and Dungeons & Dragons , as well as cartoons based on Marvel characters, including Spider-Man and His Amazing Friends . In 1988, Marvel was bought by investor / entrepreneur Ronald Perelman , who took the company public on the New York Stock Exchange , and oversaw a great increase in the number of titles the company published. As part of the process, Marvel Productions sold its back catalog to Saban Entertainment , and Marvel management closed the animation studio, opting to outsource.
  11. MARVEL sold over 7.7 million comic books and 1.6 million graphic novels in 2002. Eighty of the top 100 comic books in 2003 were MARVEL titles. Spider-Man has the highest Q rating of any Super Hero which means he is the most recognized and remembered. MARVEL properties are number one in virtually every category among boys of all ages and have cross gender appeal. So it's no wonder that MARVEL retail merchandising sales exceeded $2 billion in 2002. The Q Score is a way to measure the familiarity and appeal of a brand , company , celebrity , cartoon character or television show . The higher the Q Score, the more well-known and well thought of the item or person being scored is. The Q Score is primarily used by the marketing , advertising and public relations industries. Sometimes the term Q score is used in popular discussions of a person or product's overall fame, popularity , or likeability. Other popular synonyms include Q rating , Q factor , or simply Q . The Q Score was developed in 1963 by Marketing Evaluations, Inc. , a United States company based in Manhasset, New York . To calculate someone or something's Q Score, Marketing Evaluations surveys a panel of US consumer households about their awareness and opinion of that person or thing. Two factors influence the Q Score: the number of people who are aware of the product in question, and the number of people who claim that product as one of their favorites. Q Scores are calculated for the population as a whole as well as for demographic groups such as age, sex, income or education level. Marketing Evaluations claims that the Q Score is more valuable to marketers than other popularity measurements such as the Nielsen Ratings because Q Scores indicate not only how many people are aware of or watch a product, but how those people feel about the product. A well-liked television show, for example, may be worth more as a commercial venue to an advertiser than a higher-rated show that people don't like as much.
  12. Due to the cultural aspect of cartoons, it is best to obtain the library as well as management know-how in Asia Acquire companies to boost Marvel portfolio as well as to penetrate new markets where the cultural difference is relatively large. Consider penetrating and taking advantage of large and fast growing market: Asia To obtain valuable characters and also the management understanding the Asian culture Demographically: Girls and Adults Geographically: Asia and Europe Genre: Political Cartoons, Satire Asia: Sanrio, Bandai, Sega Sammy, Takara Tommy, Studio Ghibli (non-public) Europe: Cartoon Stock Ltd (non-public), The Punch Cartoon Library (non-public) Financing options: Treasury stock. Japanese Government is preparing a registration allowing foreign companies to conduct stock-for-stock purchase from 2007 Although the company had a loss in the past year, they are working on the turn around. The situation is similar to pre-1999 Marvel. The know-how of Marvel turn around can be applied.
  13. INDIA : Publishers in India have found that comics based on mythology and religion outsell Western fare. Dressed in a flowing dhoti, or a sarong, pointy shoes and a familiar red mask, he will swing between motor rickshaws and scooters down crowded Indian streets to take on the evil Rakshasa, or demon. Creators of India's Spider-Man, who is called Pavitr Prabhakar, hope he will soon be as well loved as the original, Peter Parker. China : Manhua (Traditional Chinese: 漫畫 ; Simplified Chinese: 漫画 ; Pinyin: Mànhuà) is a general term for comics produced in China, often including Chinese translations of Japanese manga. The Chinese characters for manhua are identical for those used in Japanese manga and Korean manhwa. Due to the greater liberalization and higher standard of living, the majority of all manhua so far has been published in Hong Kong and Taiwan rather than mainland China. As of 2004, the majority of all manhua is still published in Hong Kong and Taiwan. It is often believed that Tomasu Chew made the first of its kind.
  14. Take an advantage of online community where people are eager to create their own contents very hard for free! Establish an online platform for individual participants The plat form allows participants to create their own characters, stories and engage in socialization with others Marvel to provide easy to use interface or software to online community Monitor the traffic of users Identify individuals with creative character building Identify popular stories Bring those creative minds into Marvel! Provide an assistance to further develop professionally Capitalize them to launch new publishing stories, characters, toys and video games Further advance Marvel’s strategic alliance with Microsoft Take advantage of consumer creativity: instead of suppressing them! (e.g. “City of Heros”)
  15. Take an advantage of online community where people are eager to create their own contents very hard for free! Establish an online platform for individual participants The plat form allows participants to create their own characters, stories and engage in socialization with others Marvel to provide easy to use interface or software to online community Monitor the traffic of users Identify individuals with creative character building Identify popular stories Bring those creative minds into Marvel! Provide an assistance to further develop professionally Capitalize them to launch new publishing stories, characters, toys and video games Further advance Marvel’s strategic alliance with Microsoft Take advantage of consumer creativity: instead of suppressing them! (e.g. “City of Heros”)
  16. Current roster Captain America Iron Man Luke Cage Ronin Sentry Spider-Man Spider-Woman Wolverine Notable former members Thor Henry Pym Wasp Hawkeye Quicksilver Scarlet Witch The Vision
  17. In 1981 Marvel purchased the DePatie-Freleng Enterprises animation studio from famed Looney Tunes director Friz Freleng and his business partner David H. DePatie . The company was renamed Marvel Productions and it produced well-known animated TV series and movies featuring such characters as G.I. Joe , The Transformers , Jim Henson's Muppet Babies , and Dungeons & Dragons , as well as cartoons based on Marvel characters, including Spider-Man and His Amazing Friends . In 1988, Marvel was bought by investor / entrepreneur Ronald Perelman , who took the company public on the New York Stock Exchange , and oversaw a great increase in the number of titles the company published. As part of the process, Marvel Productions sold its back catalog to Saban Entertainment, and Marvel management closed the animation studio, opting to outsource.
  18. Current Analysis : Current business model is based upon success story of characters in Publishing divisio n Rich content library as a resource to the future No New Stars - Capitalizing on limited number of characters No clear character path - A lot of inactive characters with similar characteristics Risk : Low barrier to entry Dependent upon retailer s Substitution to other markets New objectives : Offer quality story lines : c ontent quality and characters Turn Marvel in a customer based organization Recommendations : Adoption of 5 periods : 1a ) Develop market research procedures - Understanding trends in demographics, social uses and culture (e.g. Increase in violence or of certain demographic strata) - Use questionnaires in subscription sales to collect readers opinion 1b ) Find and discover Talents - Freelancers (for stories) - Designers (for toys) - Drawers (for comics) - Talent storytellers (for stories) 2a ) Market Segmentation ( based on the developed market research procedure ) - Product Segmentation  Explore new products, both characters and stories, or redesign current products - Customer Segmentation  Target new customers based on the product segmentation 2b ) Establish pool of Talents - Group the talents found and discovered at the first stage - Group the talents based on the market segmentation, especially grouping the writers 3a ) Database of Story Resources - Creative use of successful library of characters for all media - Searching for the materials for new stories or characters cross-culturally and cross-boundary. - Expand product offering to address new market segments (through acquisitions and extensive market research) in order to diversify 3b ) Network of Talents - Initiate talents gathering - know each others’ talent 4a ) Matching Talents & Story - Set up the project - Find the right talents for this project - Provide talents the one-time target customers and target story line - Provide talents the story materials in the database created in period 3 5) Adjustment - Frequently-checked market research - Monitor the performance of “creative story” in the pilot market - Updated talents group based on the adjustment of products Shortages : Multiple acquisition is difficult to handle, especially facing the cultural/national defense High uncertainty : Either successful or not Initial investment versus high pay off if success story Time gap between investment and pay off
  19. Due to the cultural aspect of cartoons, it is best to obtain the library as well as management know-how in Asia Acquire companies to boost Marvel portfolio as well as to penetrate new markets where the cultural difference is relatively large. Consider penetrating and taking advantage of large and fast growing market: Asia To obtain valuable characters and also the management understanding the Asian culture Demographically: Girls and Adults Geographically: Asia and Europe Genre: Political Cartoons, Satire Asia: Sanrio, Bandai, Sega Sammy, Takara Tommy, Studio Ghibli (non-public) Europe: Cartoon Stock Ltd (non-public), The Punch Cartoon Library (non-public) Financing options: Treasury stock. Japanese Government is preparing a registration allowing foreign companies to conduct stock-for-stock purchase from 2007 Although the company had a loss in the past year, they are working on the turn around. The situation is similar to pre-1999 Marvel. The know-how of Marvel turn around can be applied.
  20. In recent years, the comic book market has gone through a slump due to increased competition from video games, electronic toys and cable television. The industry peaked in 1993, when sales topped $1 billion for the first time ever, fueled in part by the big comic book houses coming out with new titles. DC Comics decided to kill off Superman and that issue sold between 2.5 million and 3 million copies. But it has been a downhill slide since then for comic book sales, which have tumbled to about $550 million a year, as kids turn to PlayStation 2 and online games to keep them happy. During the 1993 heyday, there were about 10,000 comic book stores in the country. That has dipped to about 3,000 today, according to John Miller, managing editor of Comics Buyer's Guide. Ninety-four percent of comic book readers are men, ages 18 to 30. But there are no statistics on the ethnic breakdown of comic book readers, experts said.