Download to read offline
![Fields : names(dataset)
• names(dataset)
• [1] "NYEAR" "SYEAR" "QUARTERS"
• [4] "CITY" "CITYCODE" "NREGION"
• [7] "REGION" "NUTS3CODE" "NUTS2CODE"
• [10] "NUTS1CODE" "TRNUTS1REGION" "NUTS1REGION"
• [13] "TRGROUP" "SECTORAL" "CASHLOANS"
• [16] "NONCASHLOANS" "TOTALCASHLOANS" "AUTO"
• [19] "MORTGAGE" "OVERDRAFTACCOUNT" "CREDITCARDS"
• [22] "FOOD" "BUILDING" "MINERALS "
• [25] "FINANCIAL" "TEXTILE" "WHOSESALE "
• [28] "TOURISM" "AGRICULTURE" "ENERGY"
• [31] "MARITIME" "OTHERCONSUMER" "DEFRECEIVABLE"
• [34] "DEFCREDITCARDS" "DEFAUTO" "DEFMORTGAGE"
• [37] "DEFOTHERCONSUMER" "DEFFOOD" "DEFBUILDING"
• [40] "DEFMINERALS" "DEFFINANCIAL" "DEFTEXTILE"
• [43] "DEFWHOLESALE " "DEFTOURISM" "DEFAGRICULTURE"
• [46] "DEFENERGY" "DEFMARITIME" "NONCASHFOOD"
• [49] "NONCAHBUILDING" "NONCASHMINERALS" "NONFINANCIAL"
• [52] "NONCASHTEXTILE" "NONCASHWHOLESALE " "NONCASHTOURISM"
• [55] "NONCASHAGRICULTURE“ "NONCASHENERGY" "NONCASHMARITIME"](https://image.slidesharecdn.com/riskreport-151113141640-lva1-app6892/75/Risk-Report-abridged-6-2048.jpg)
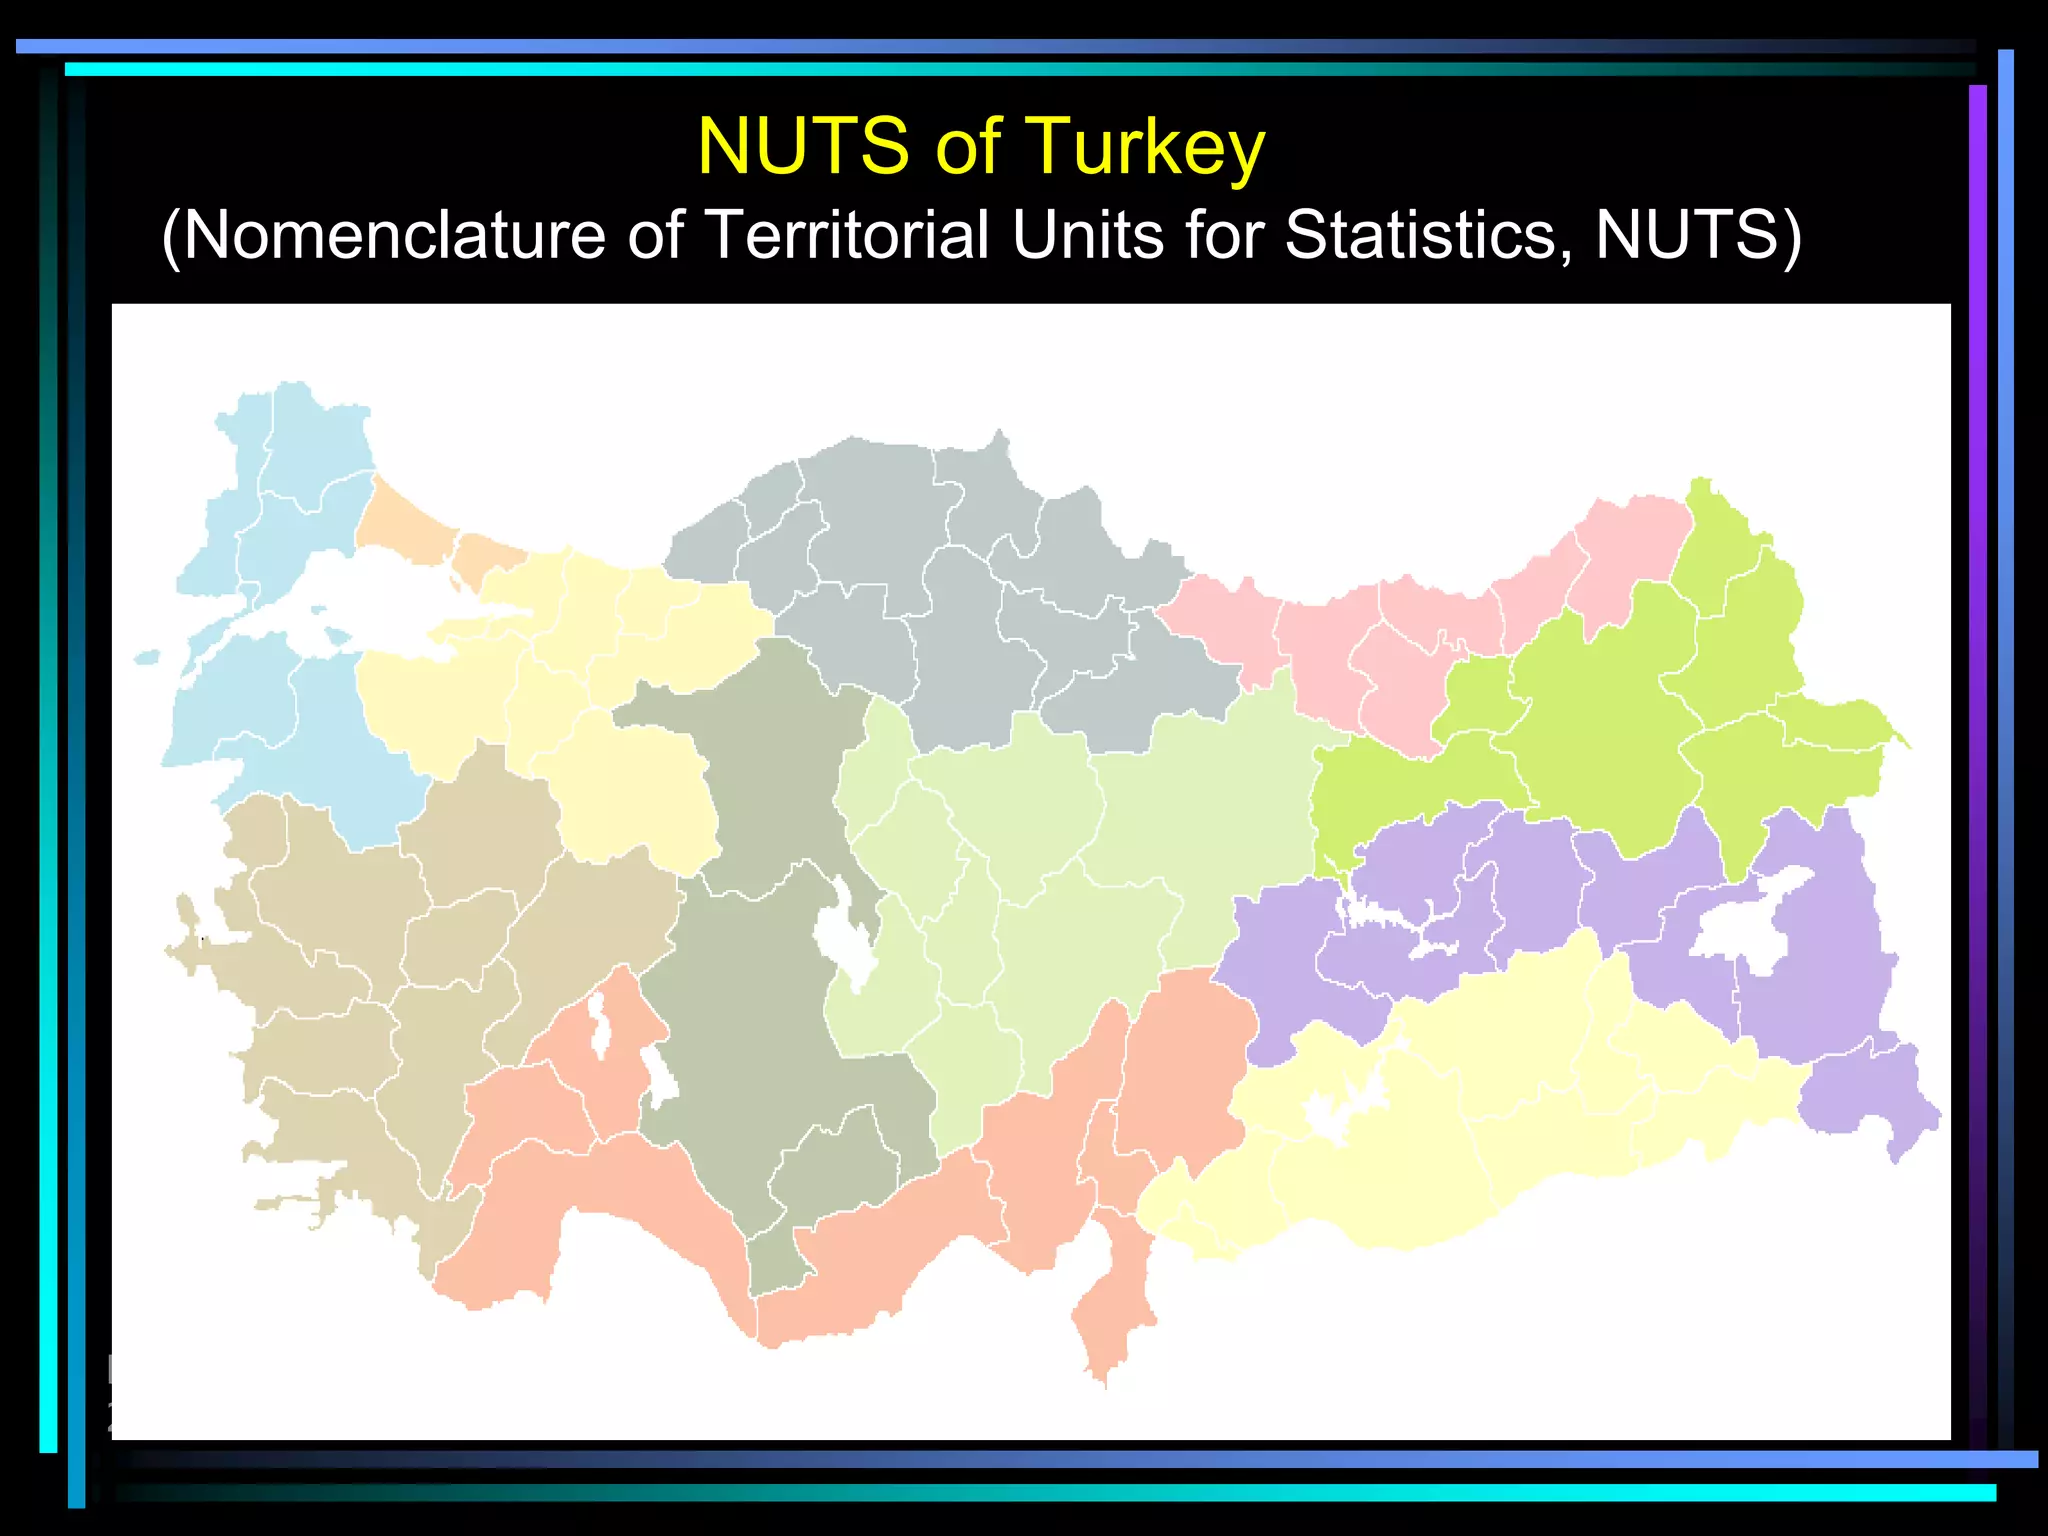
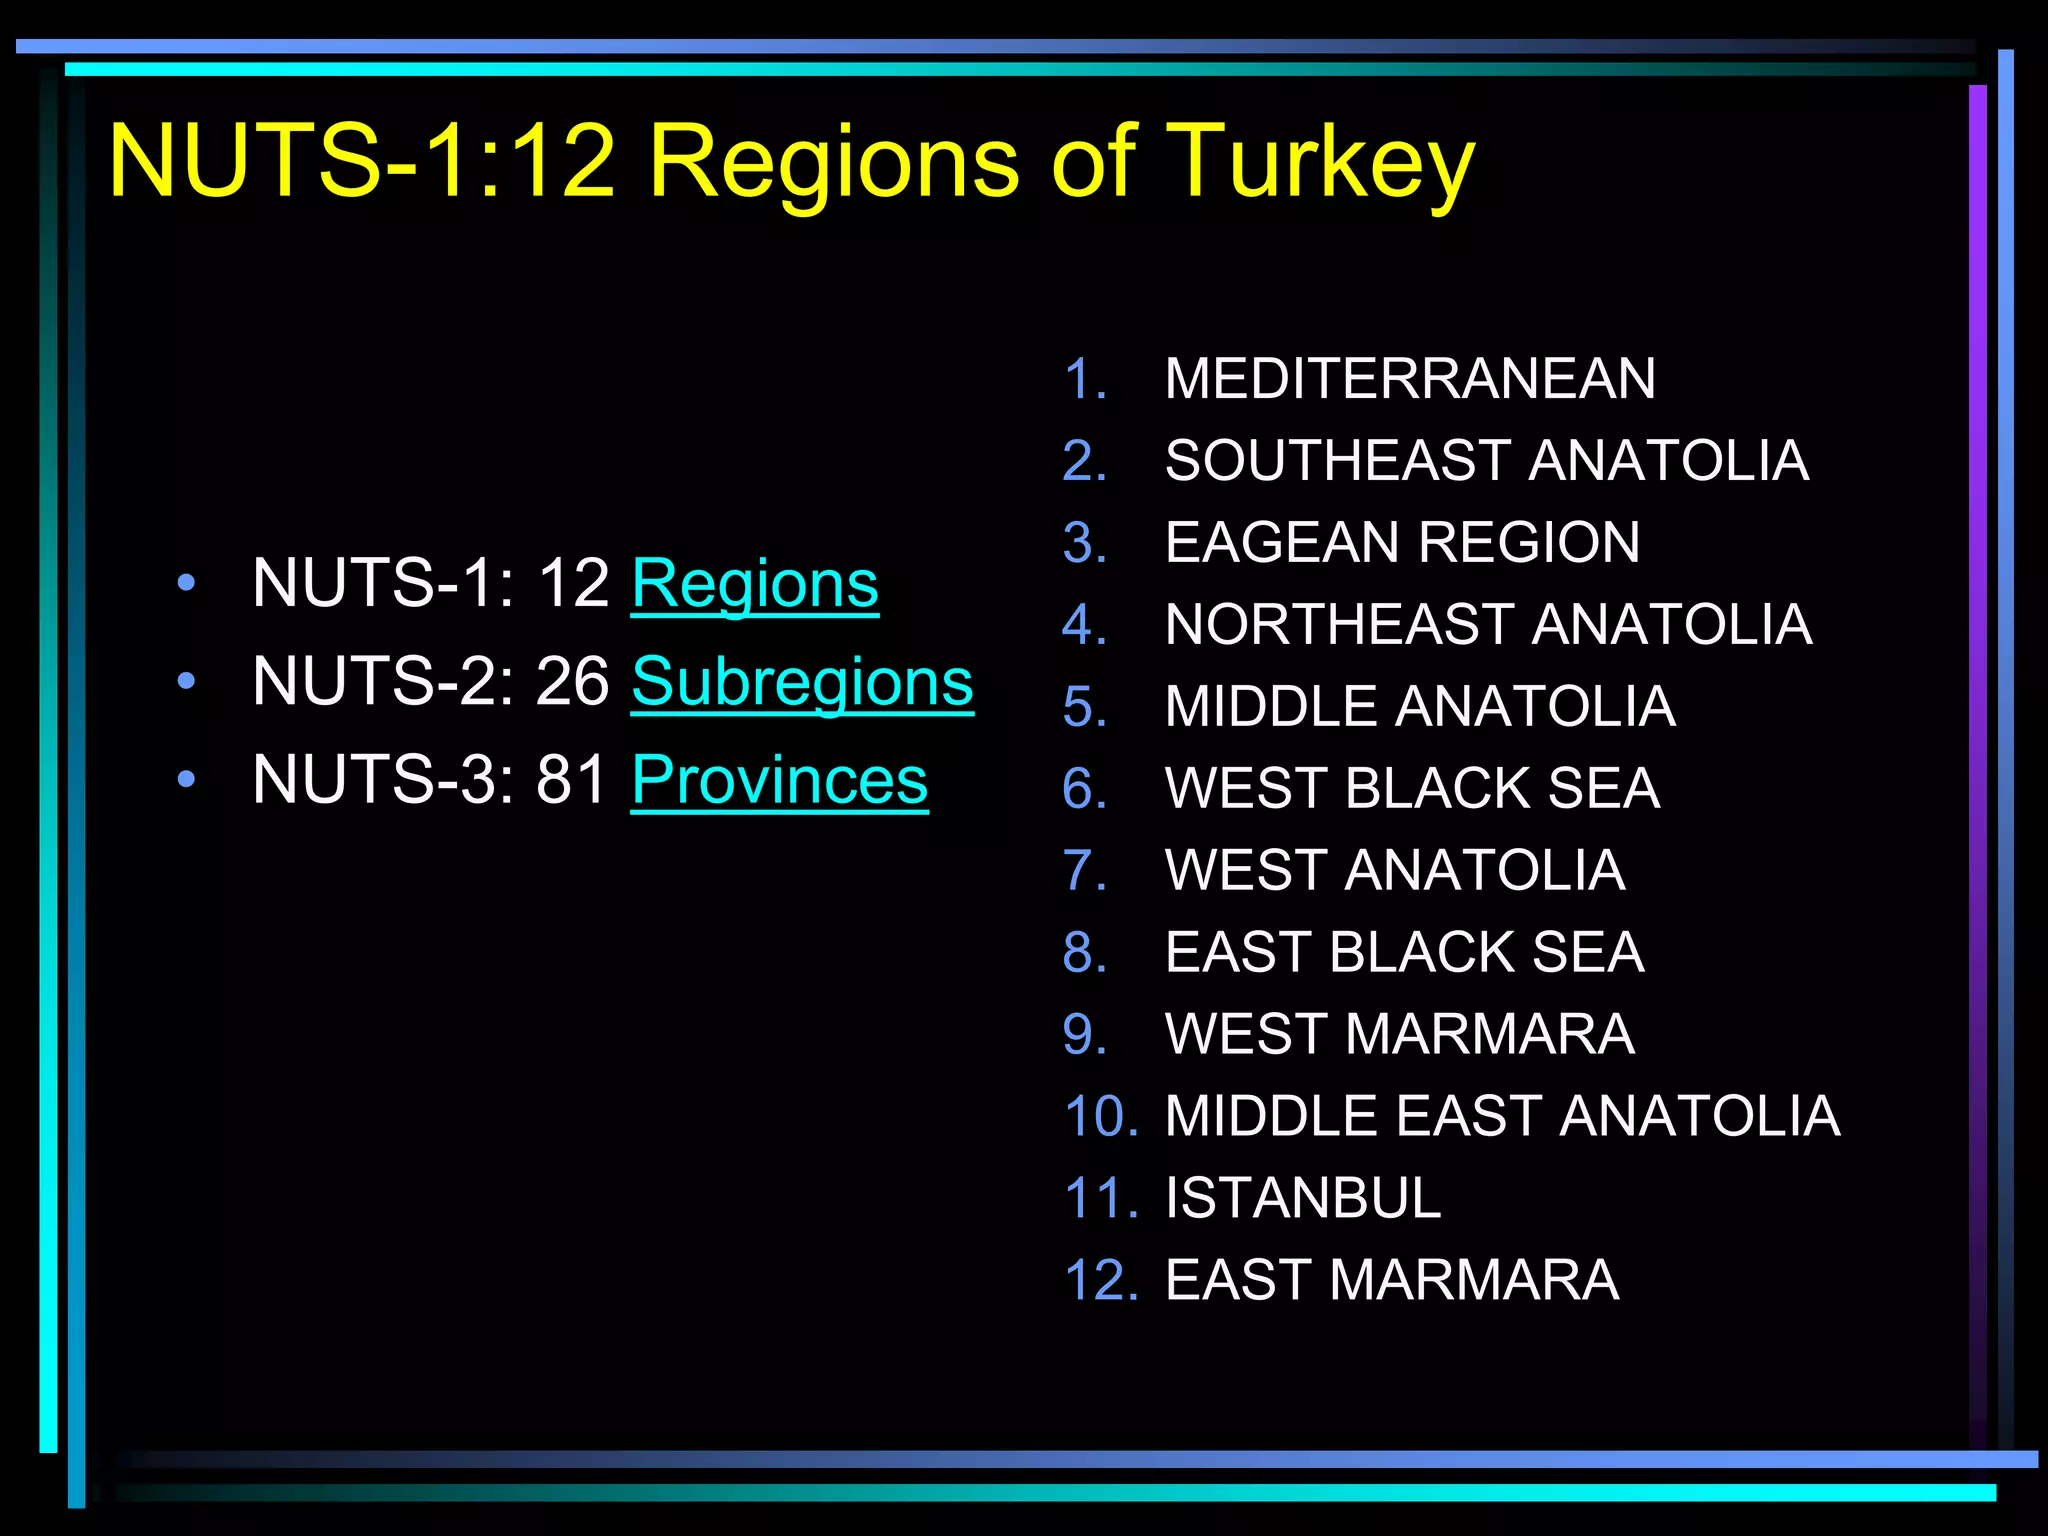
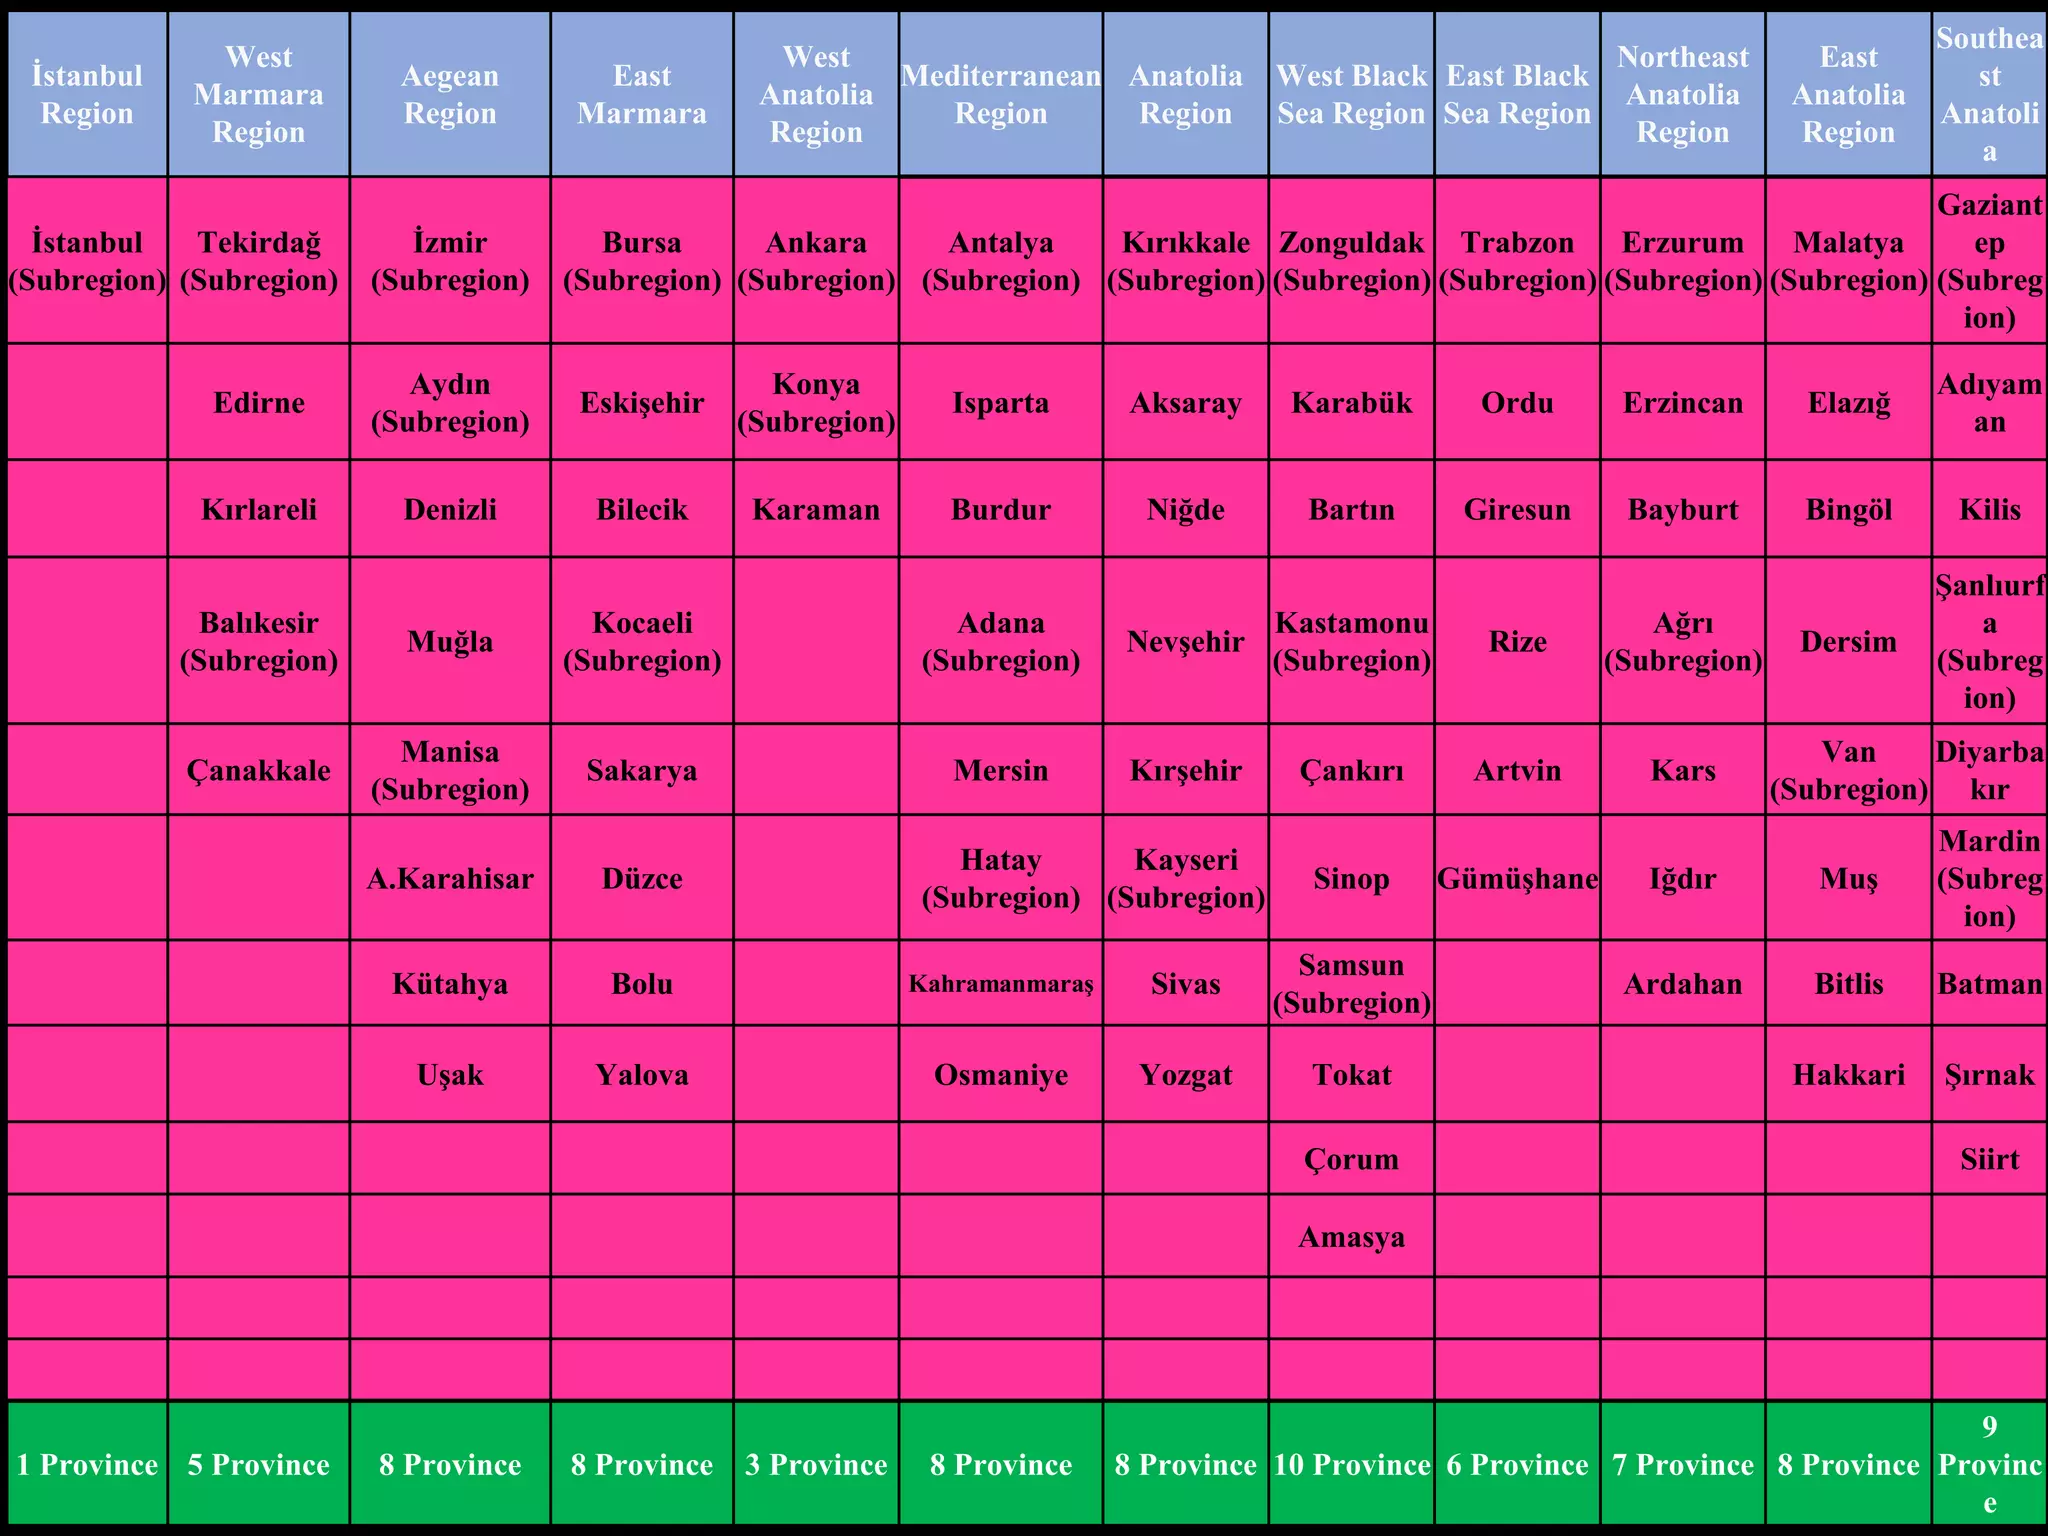
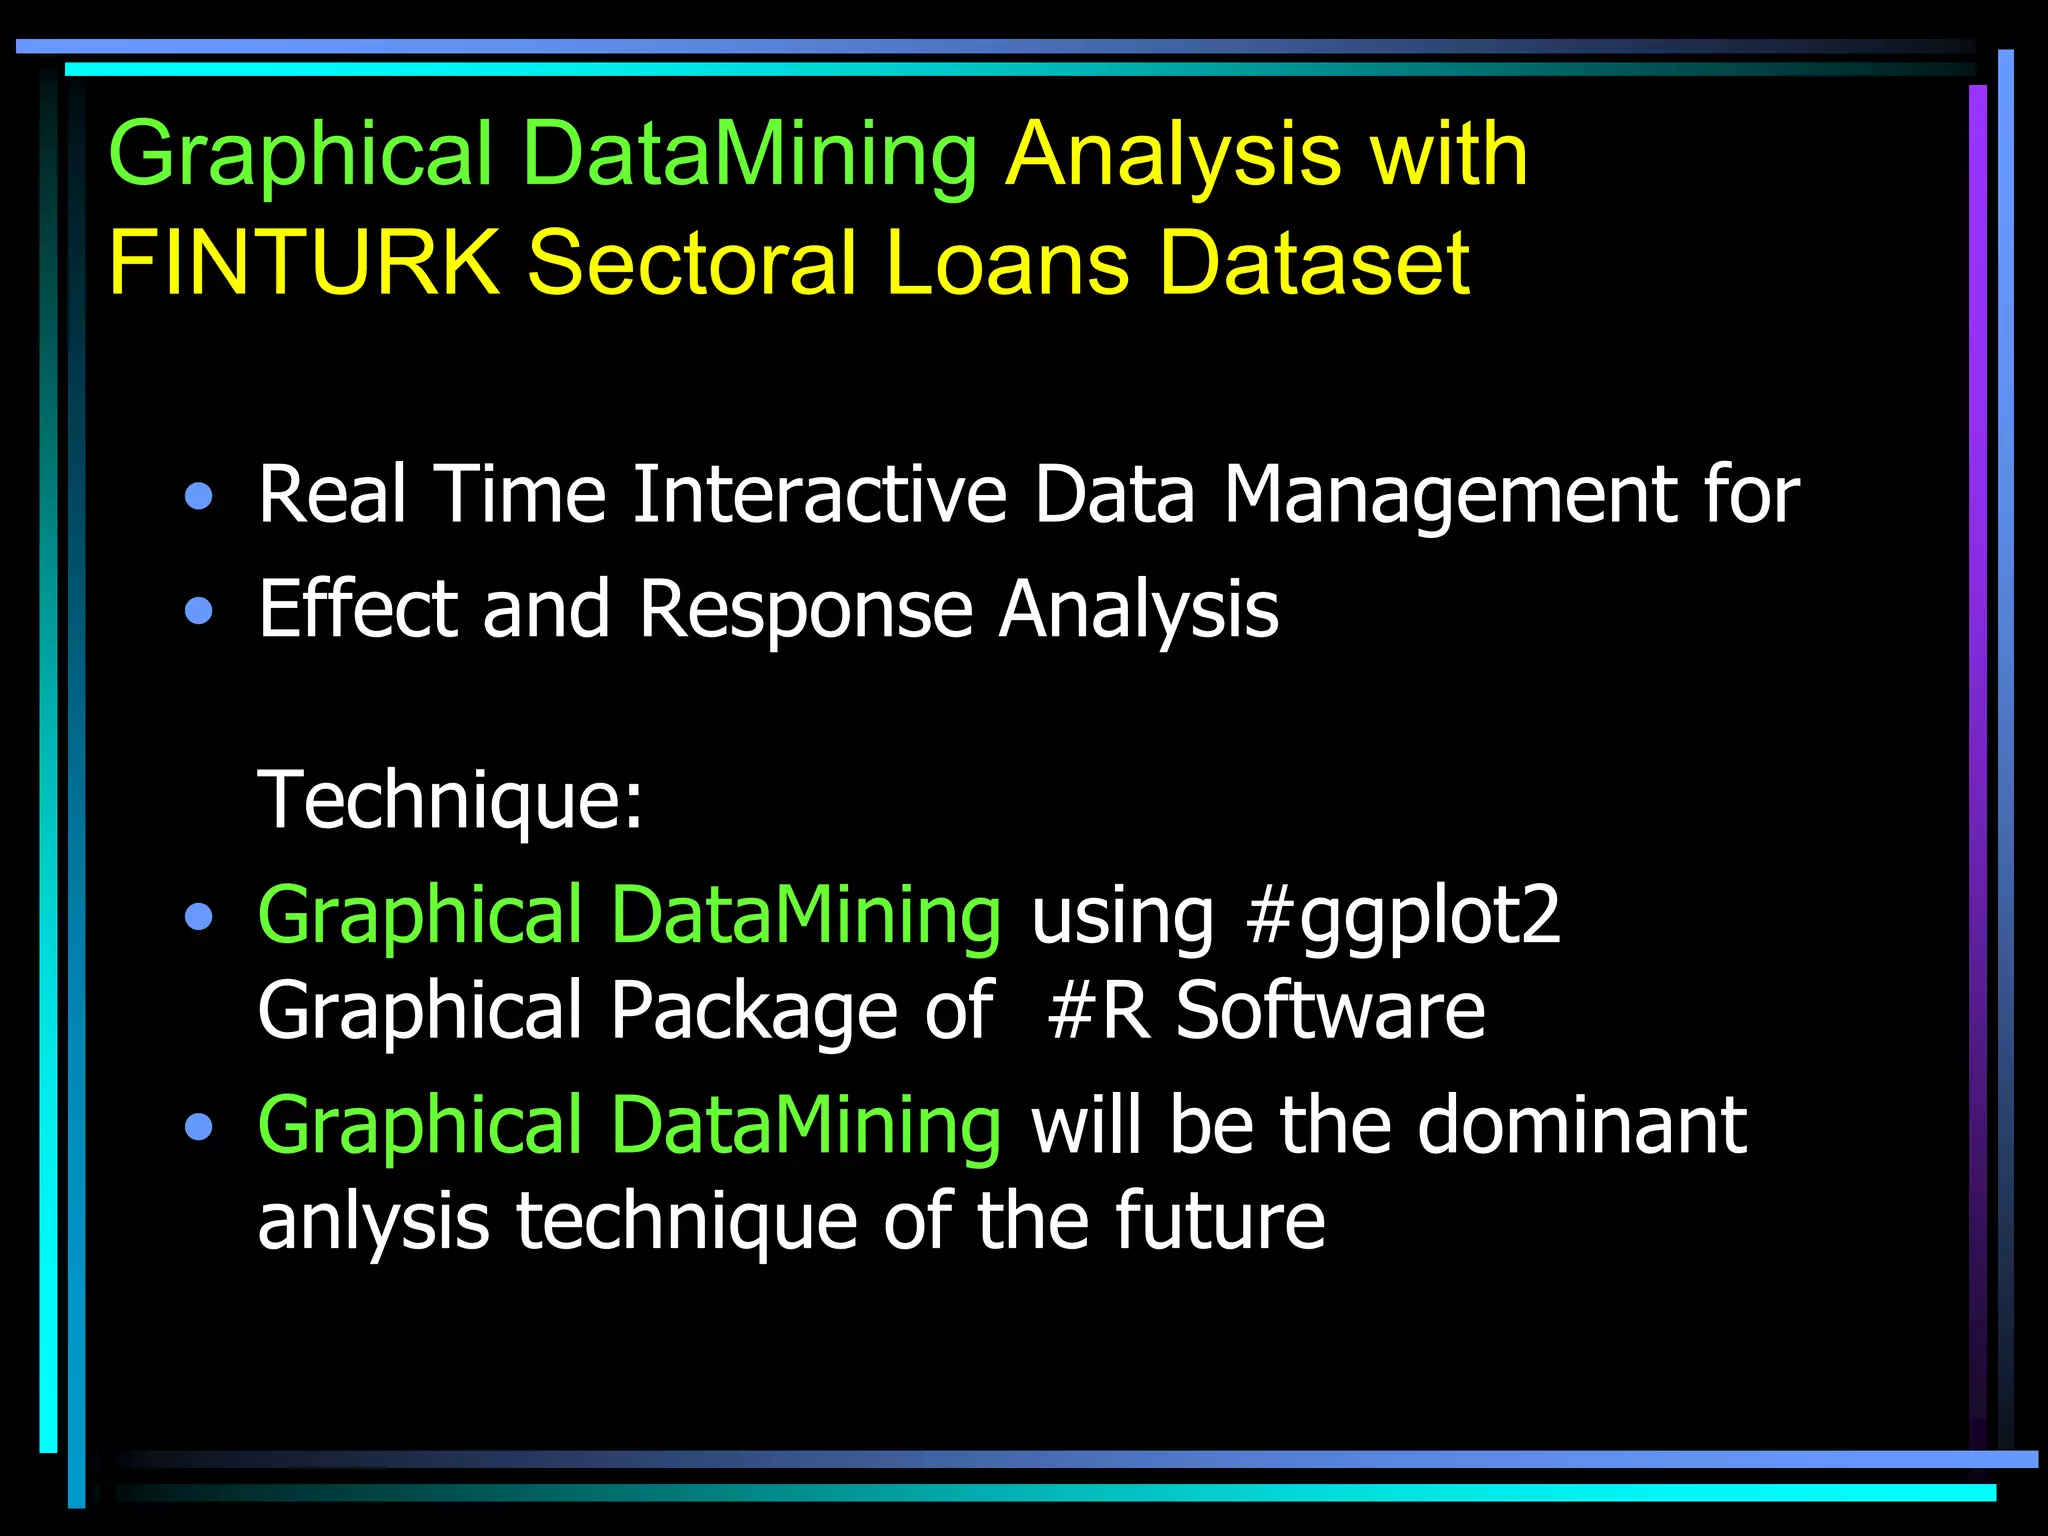
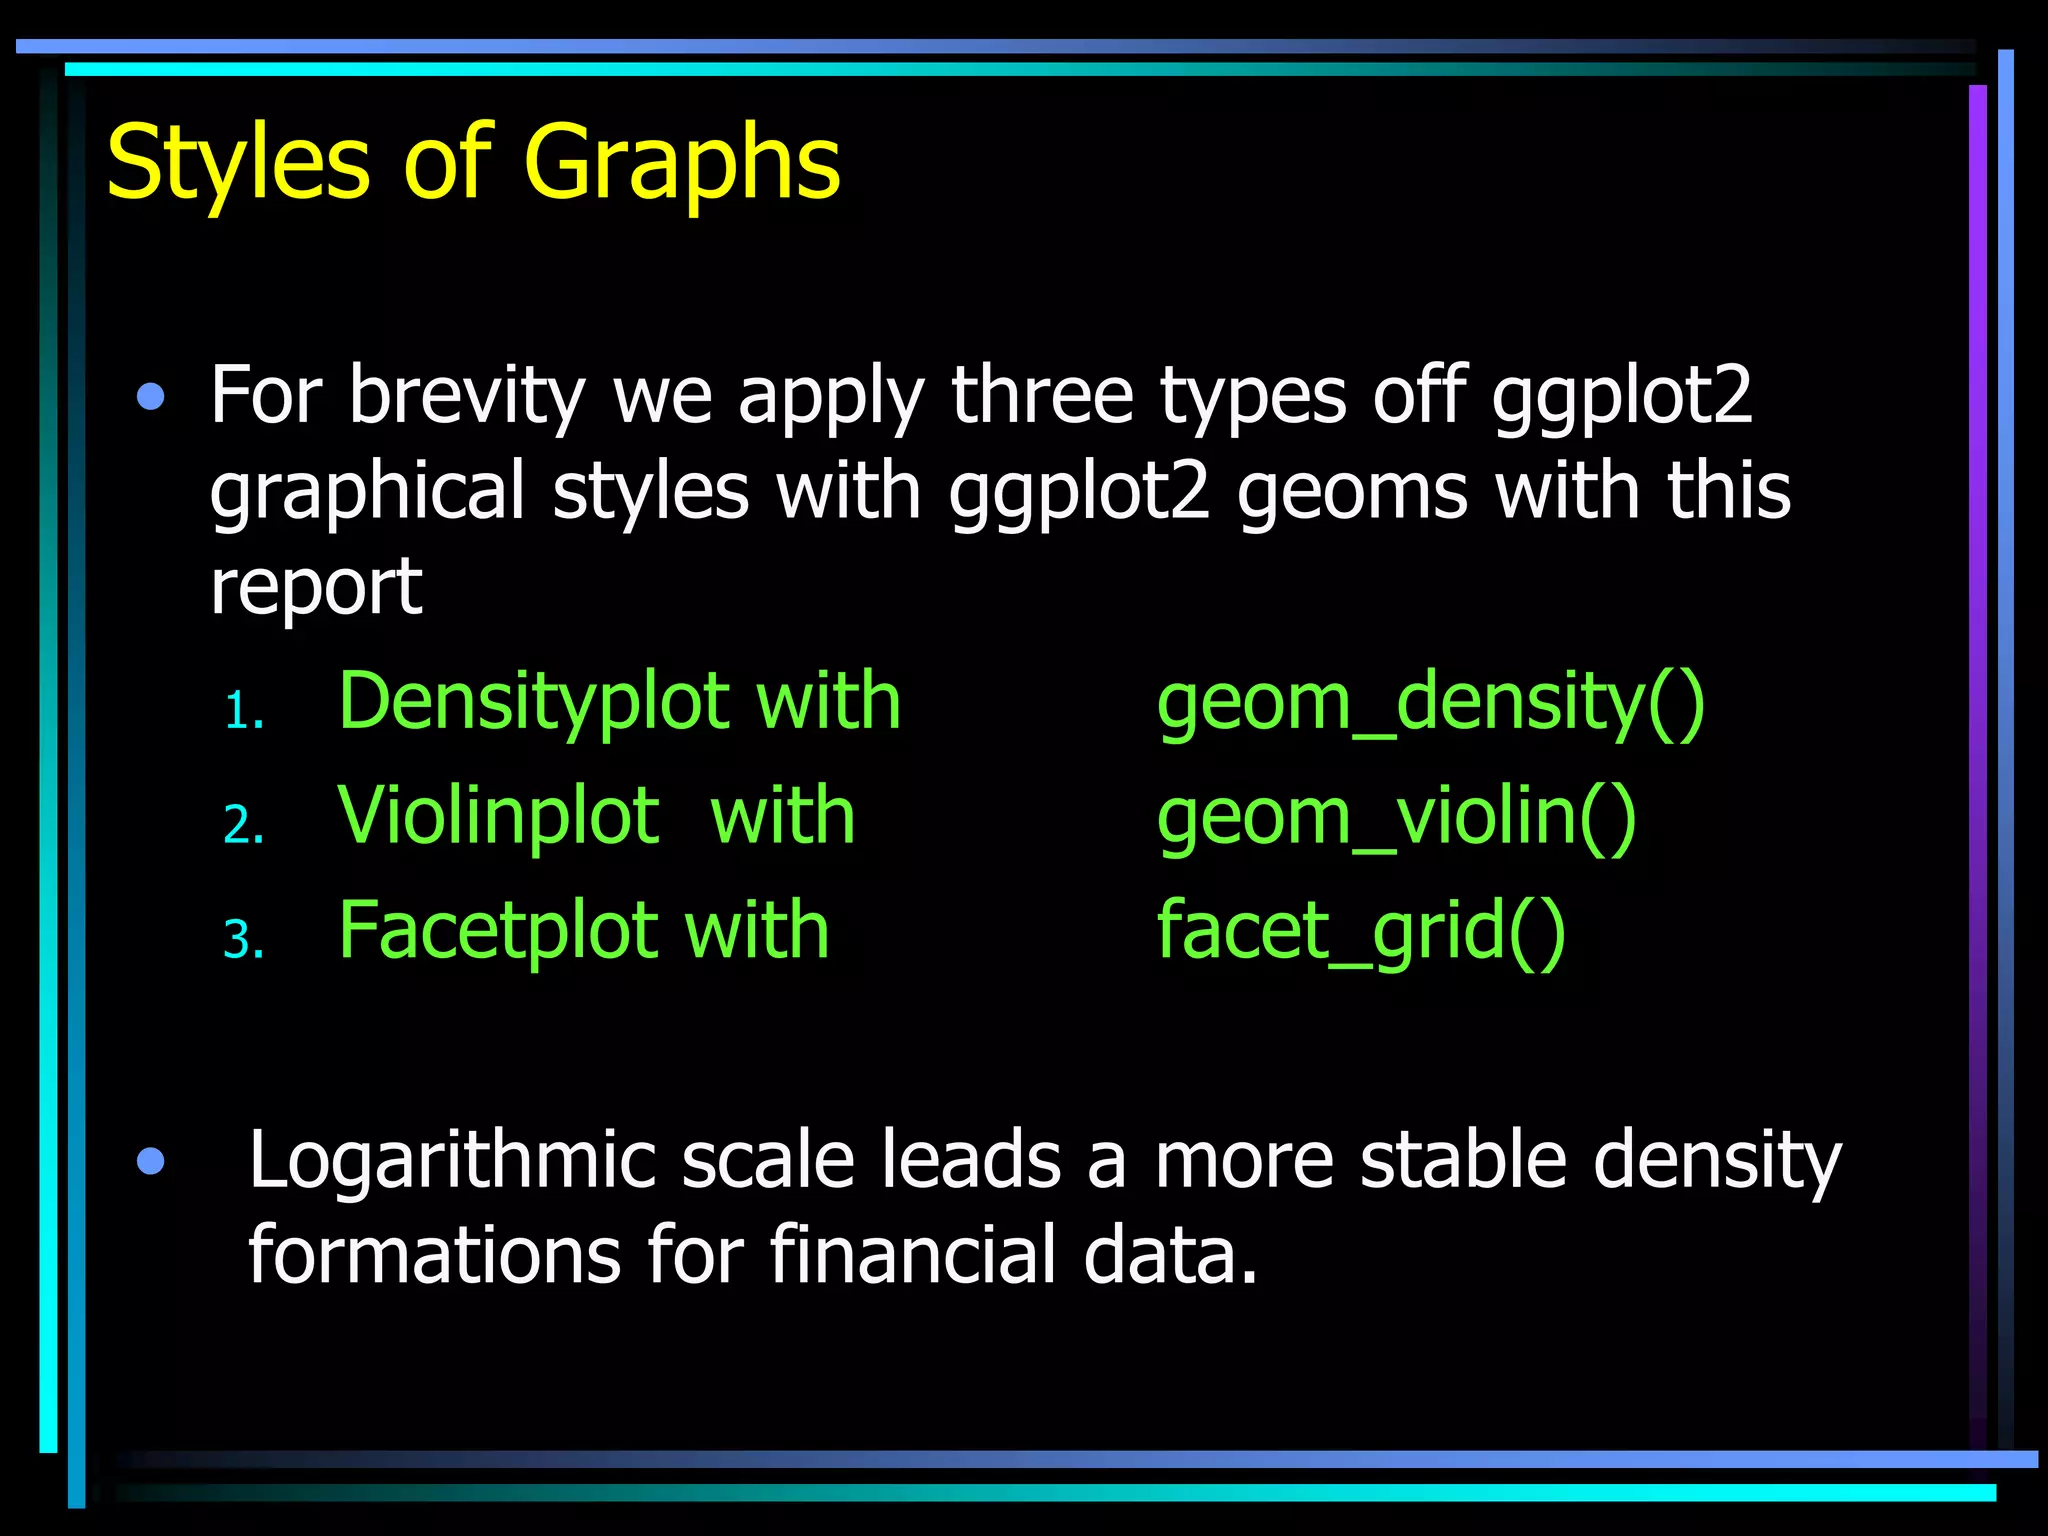
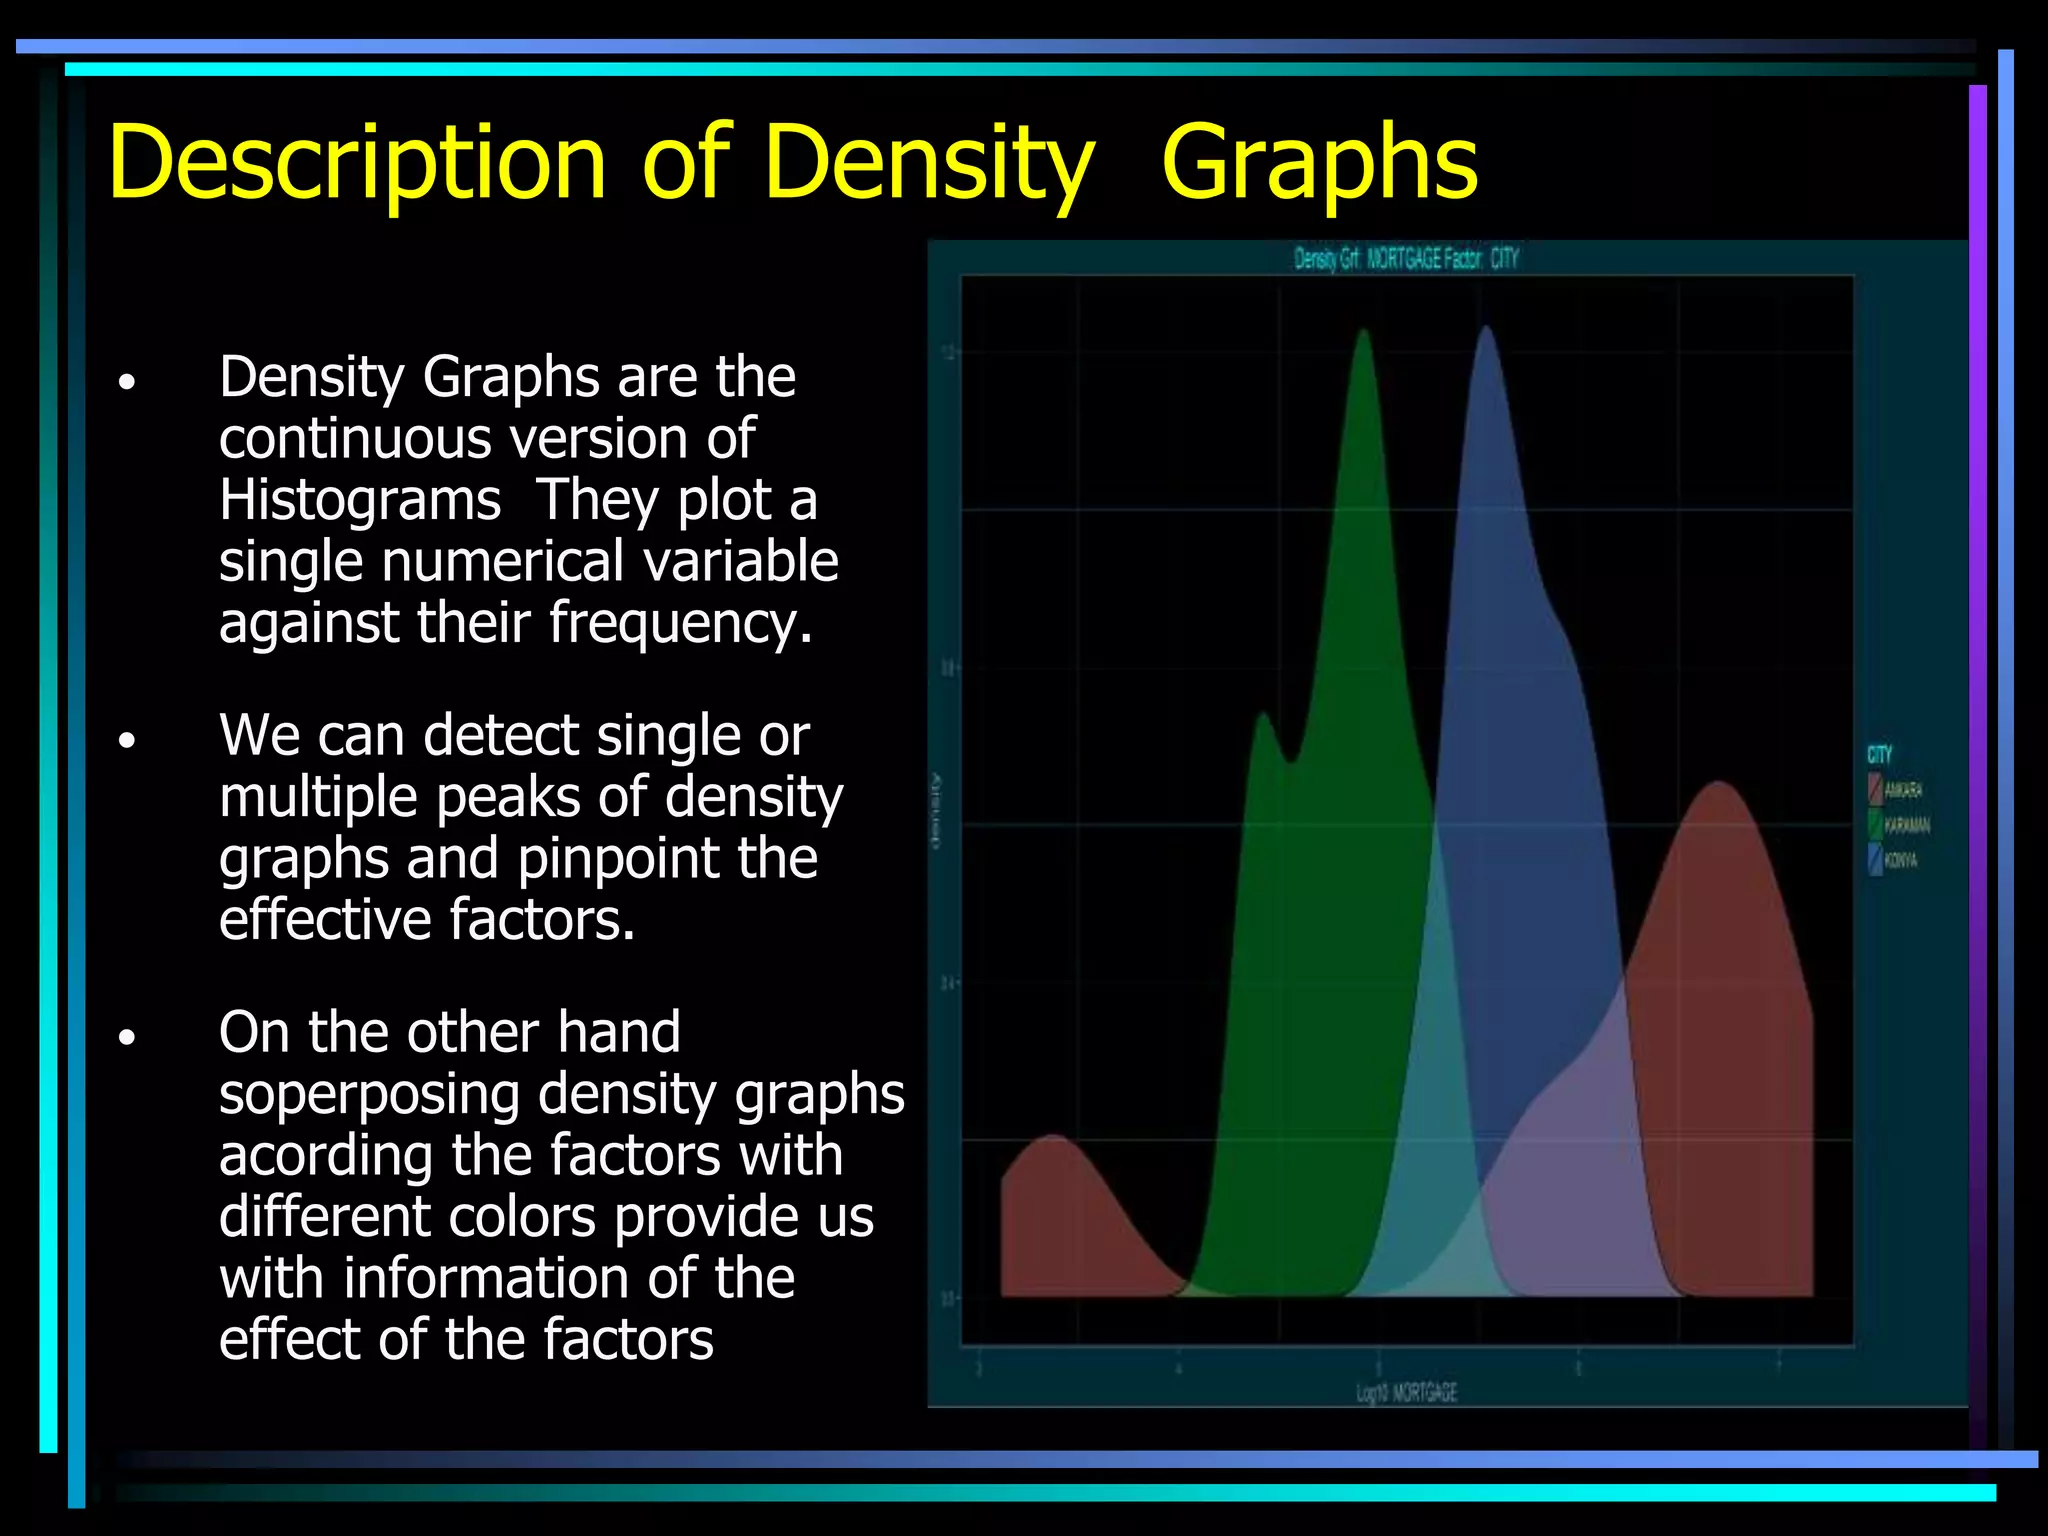
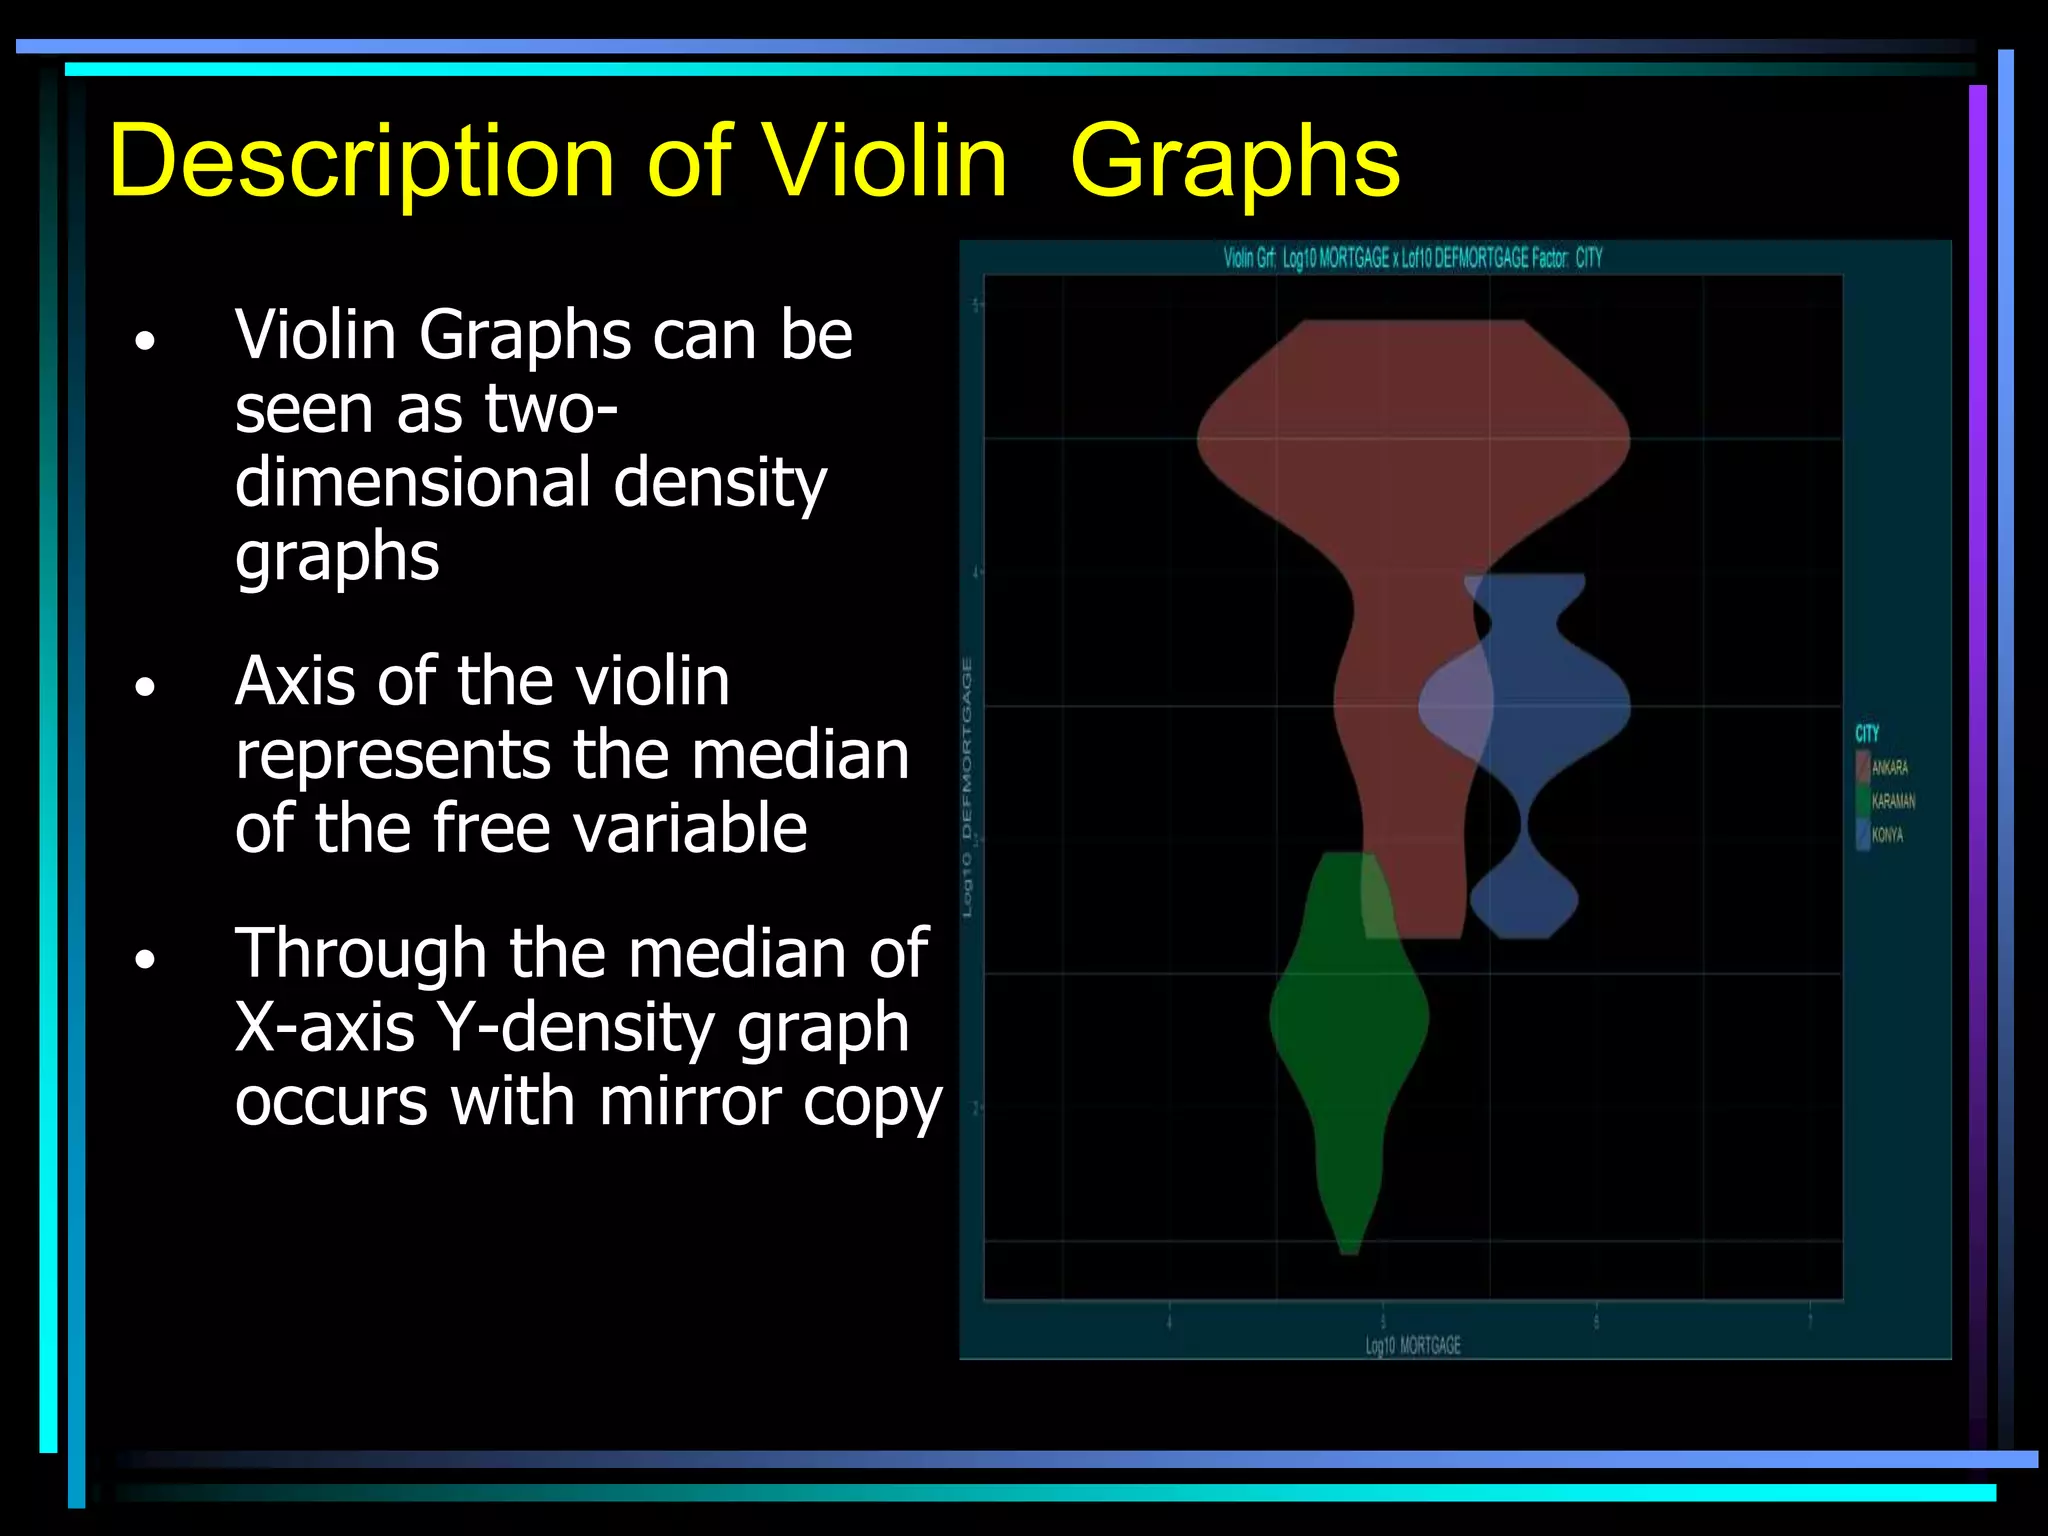
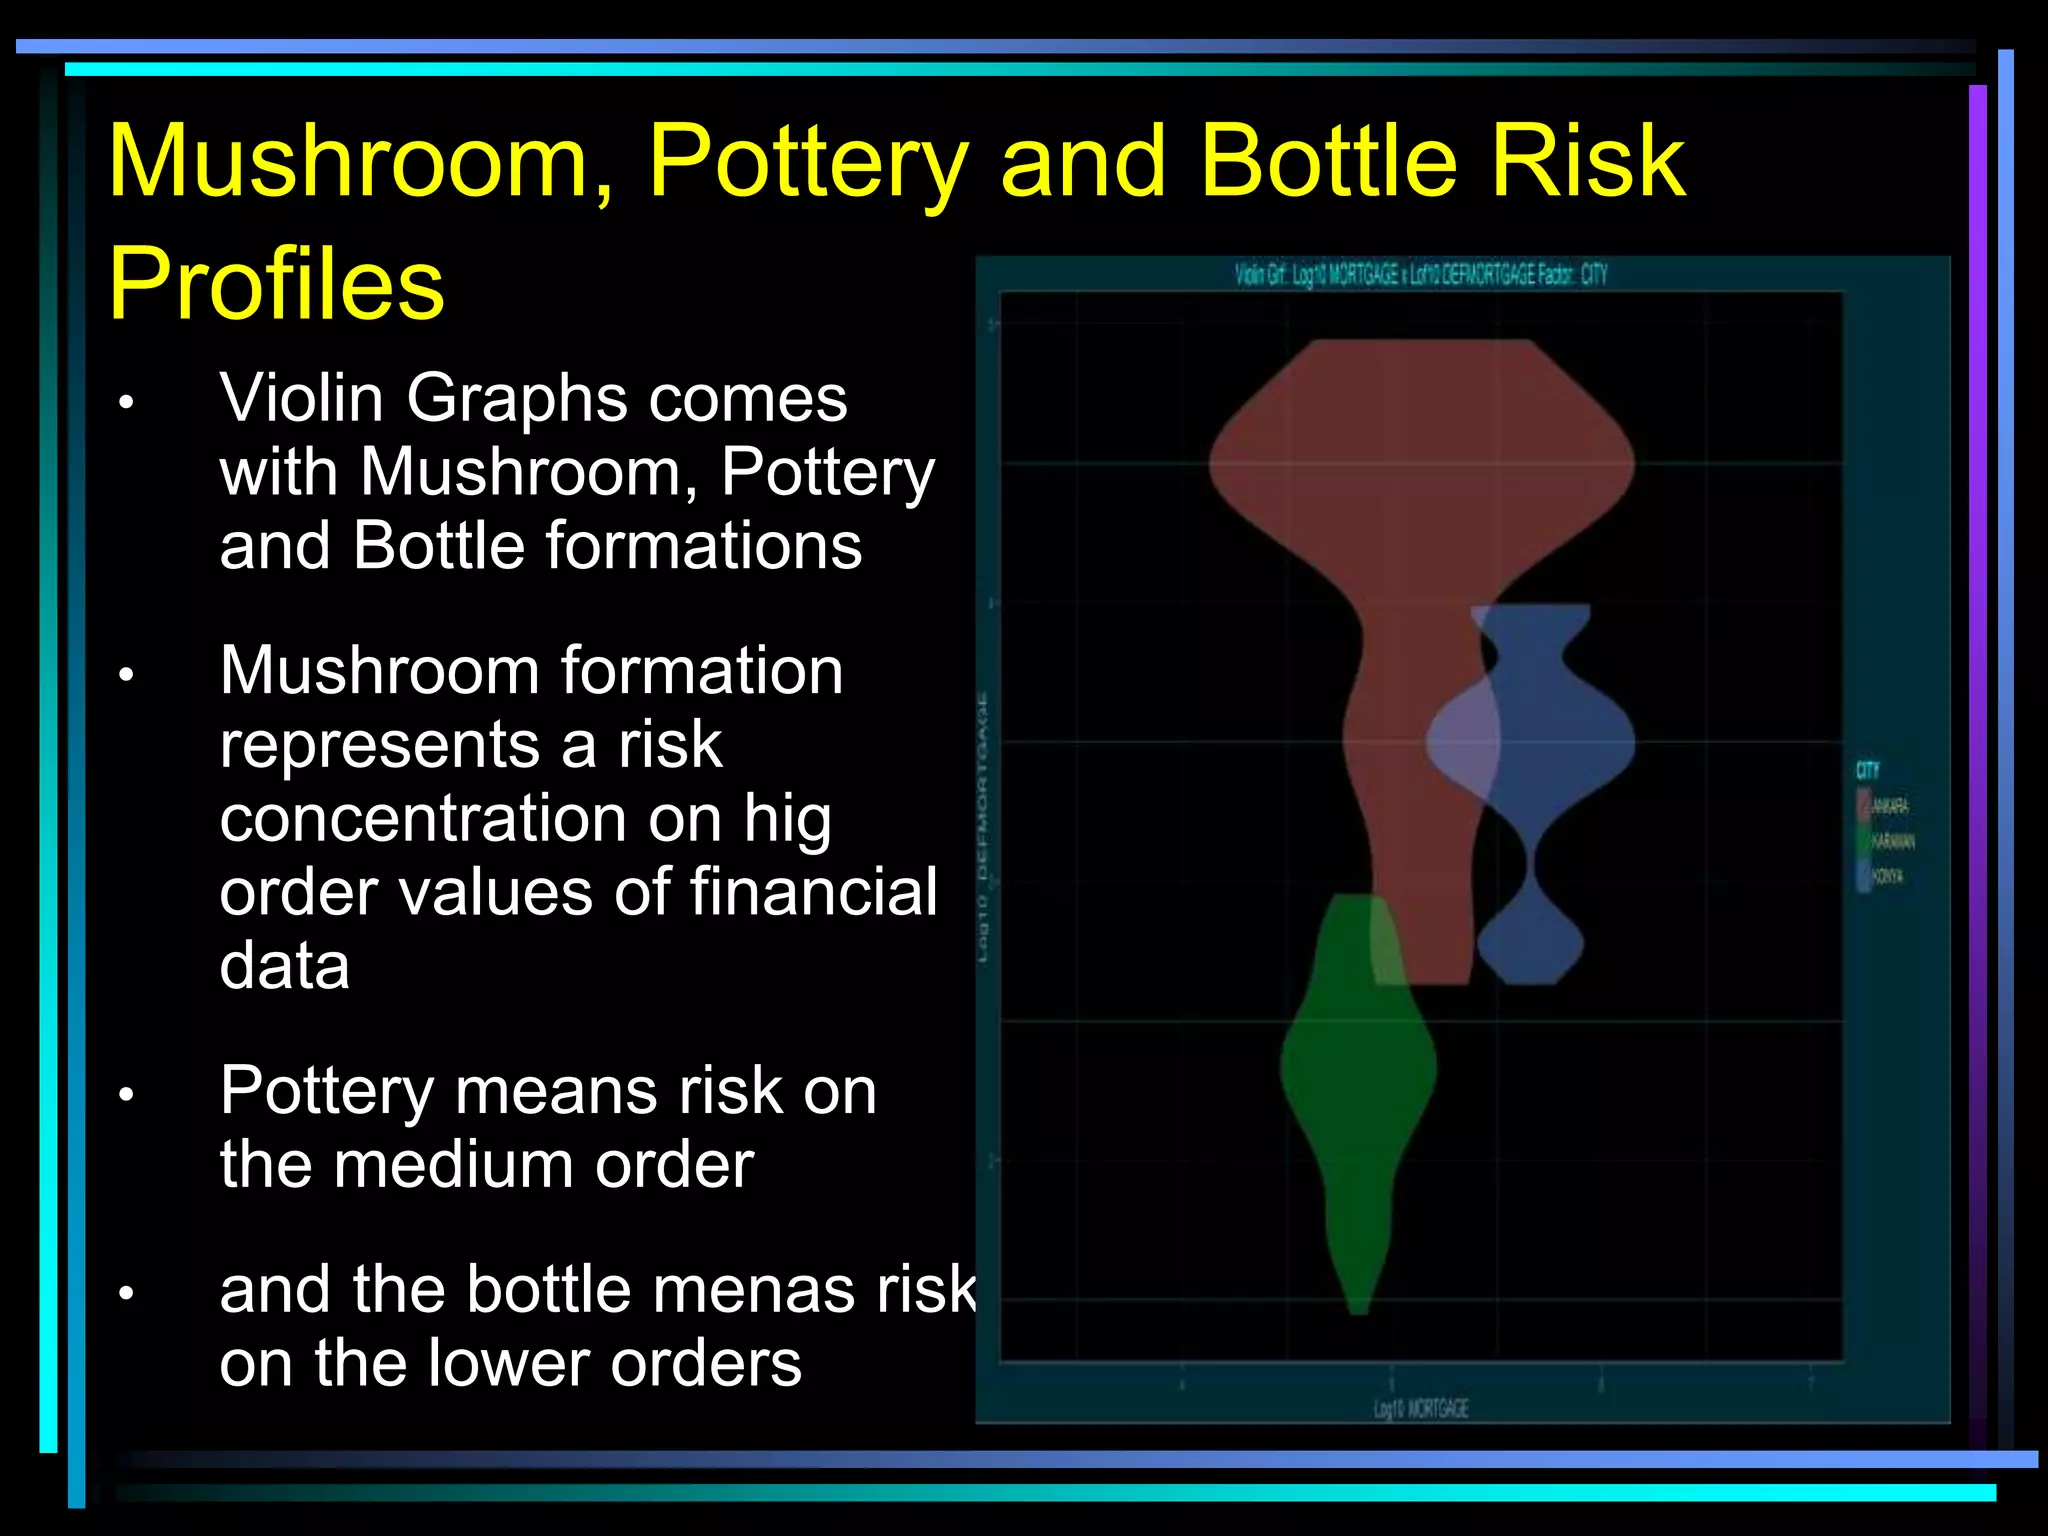
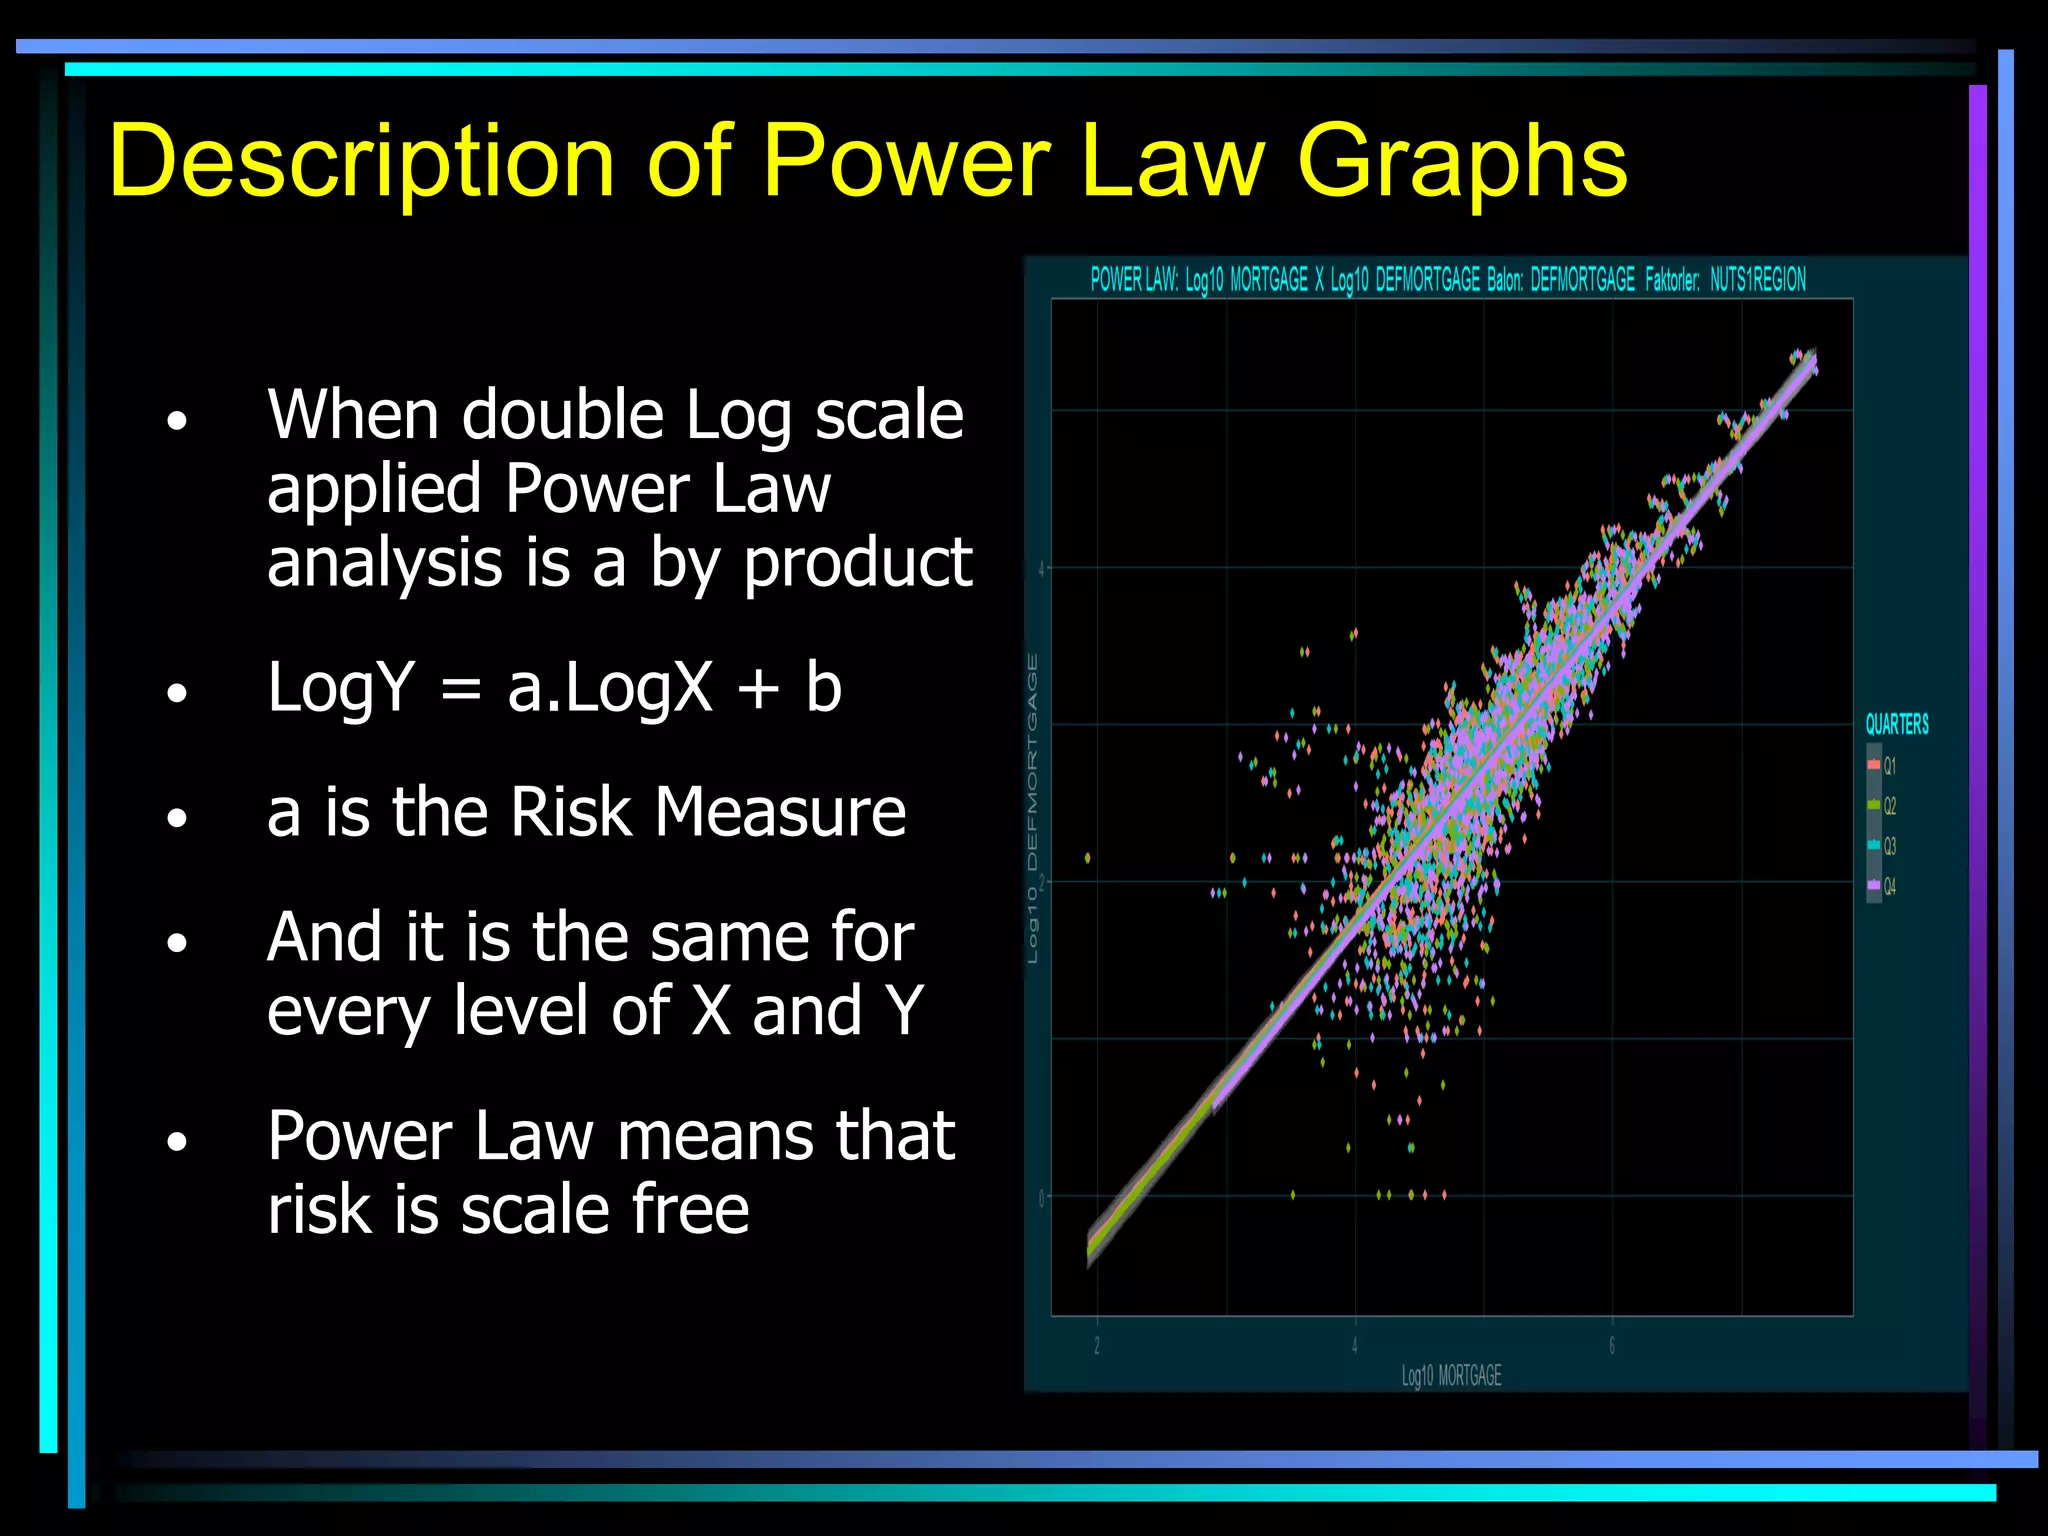
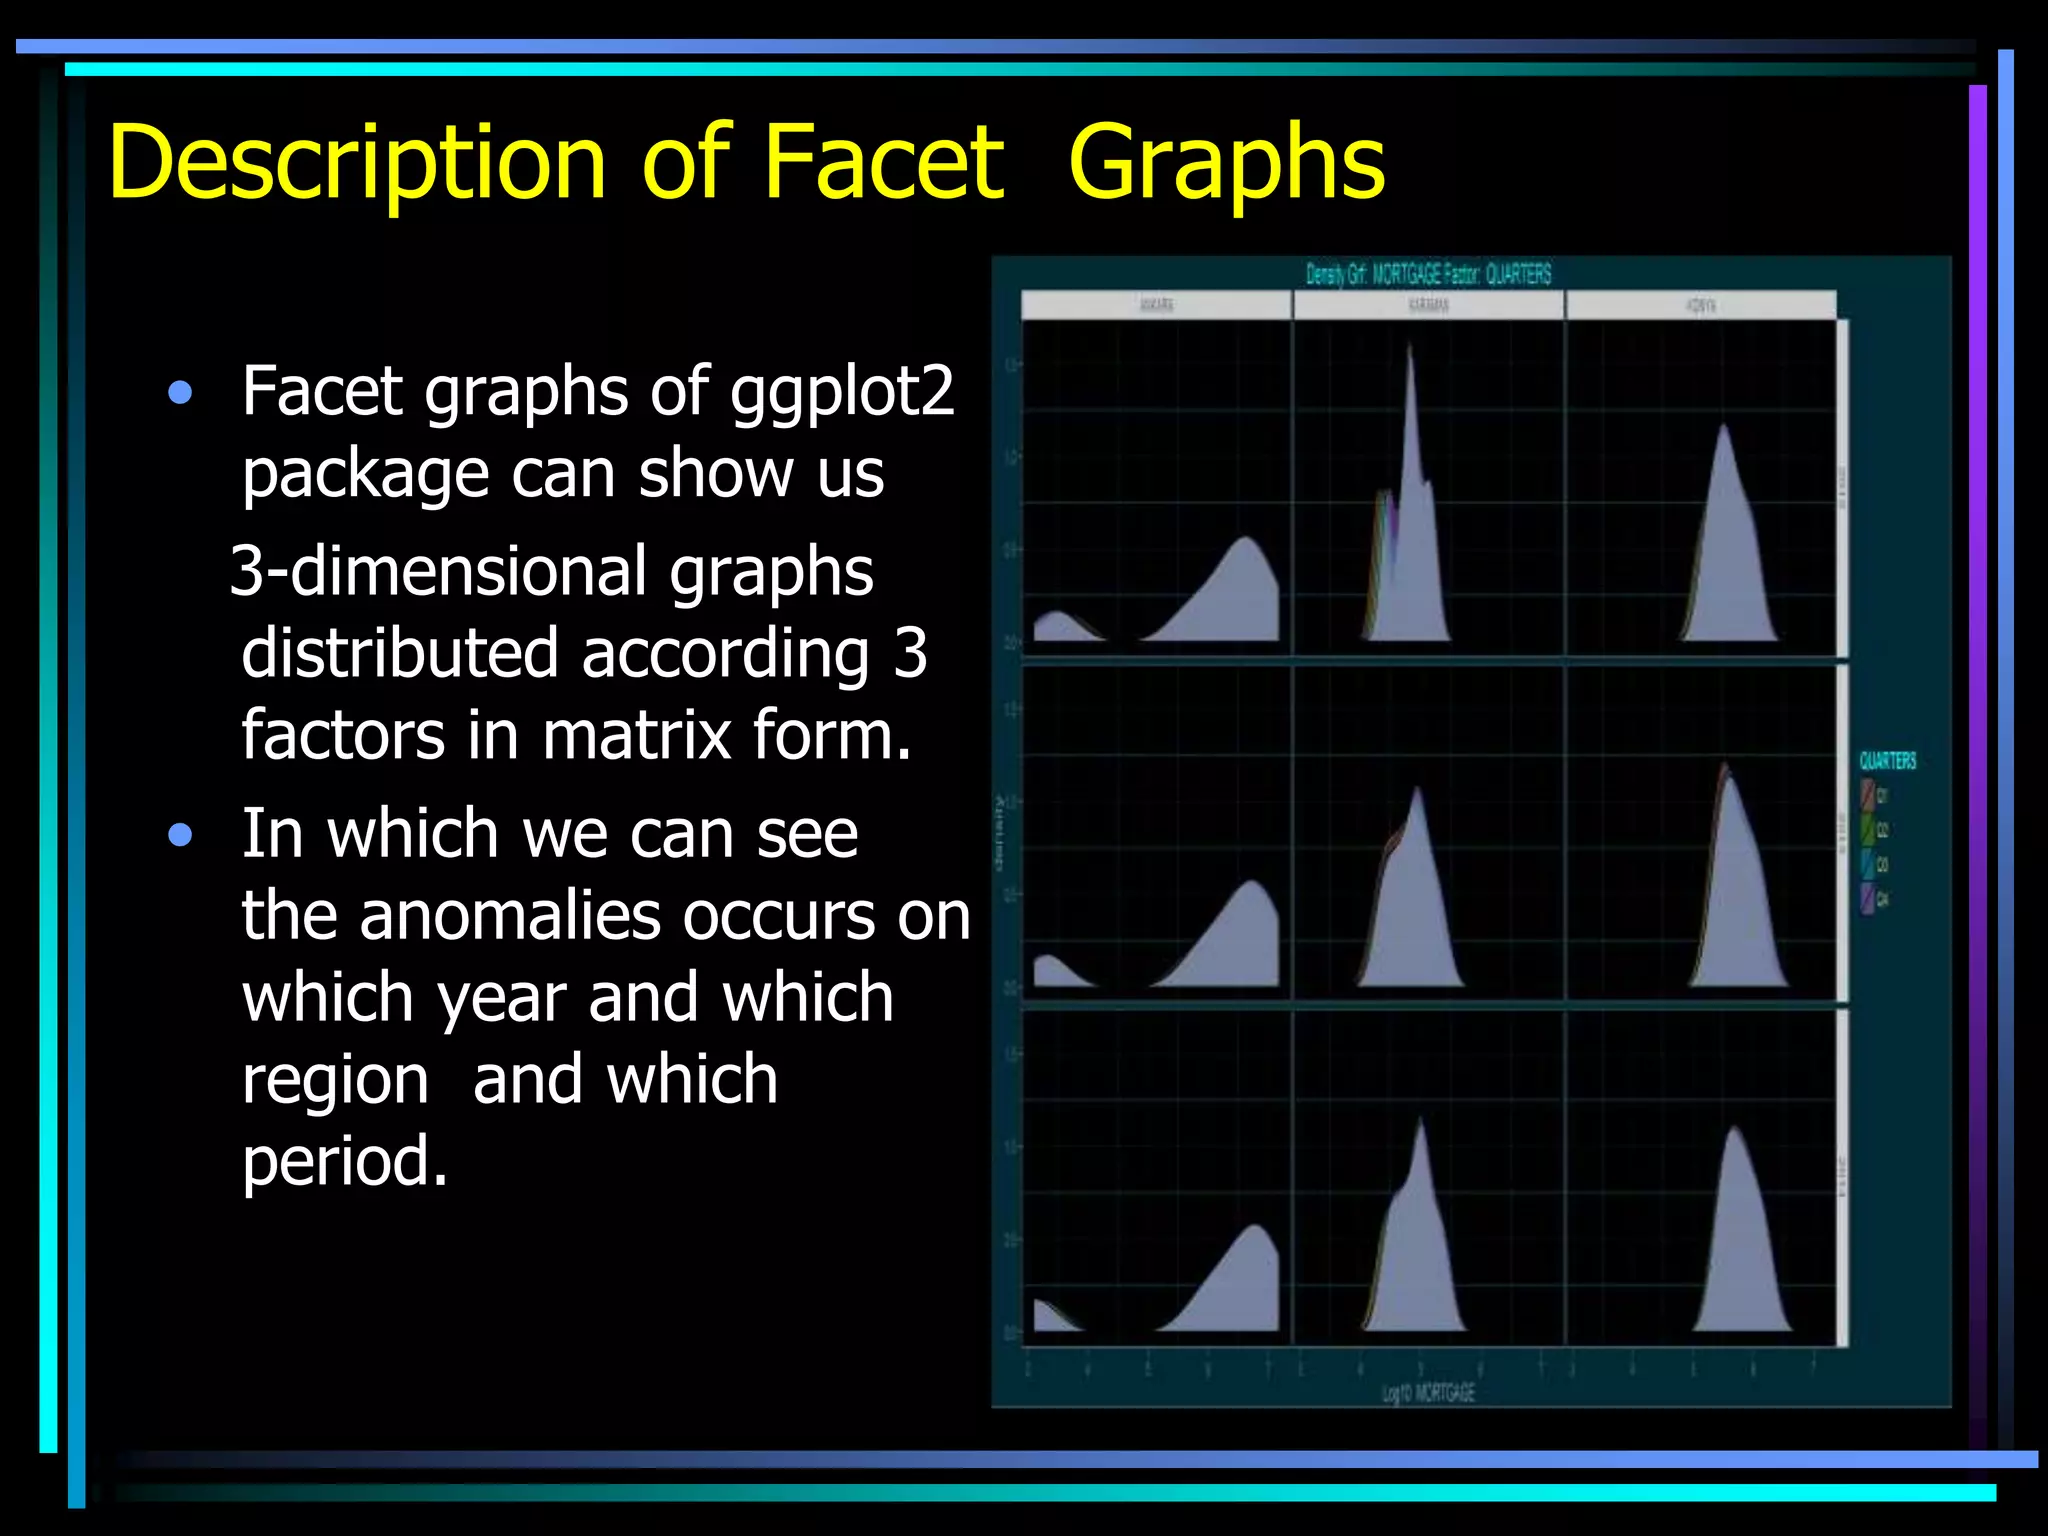
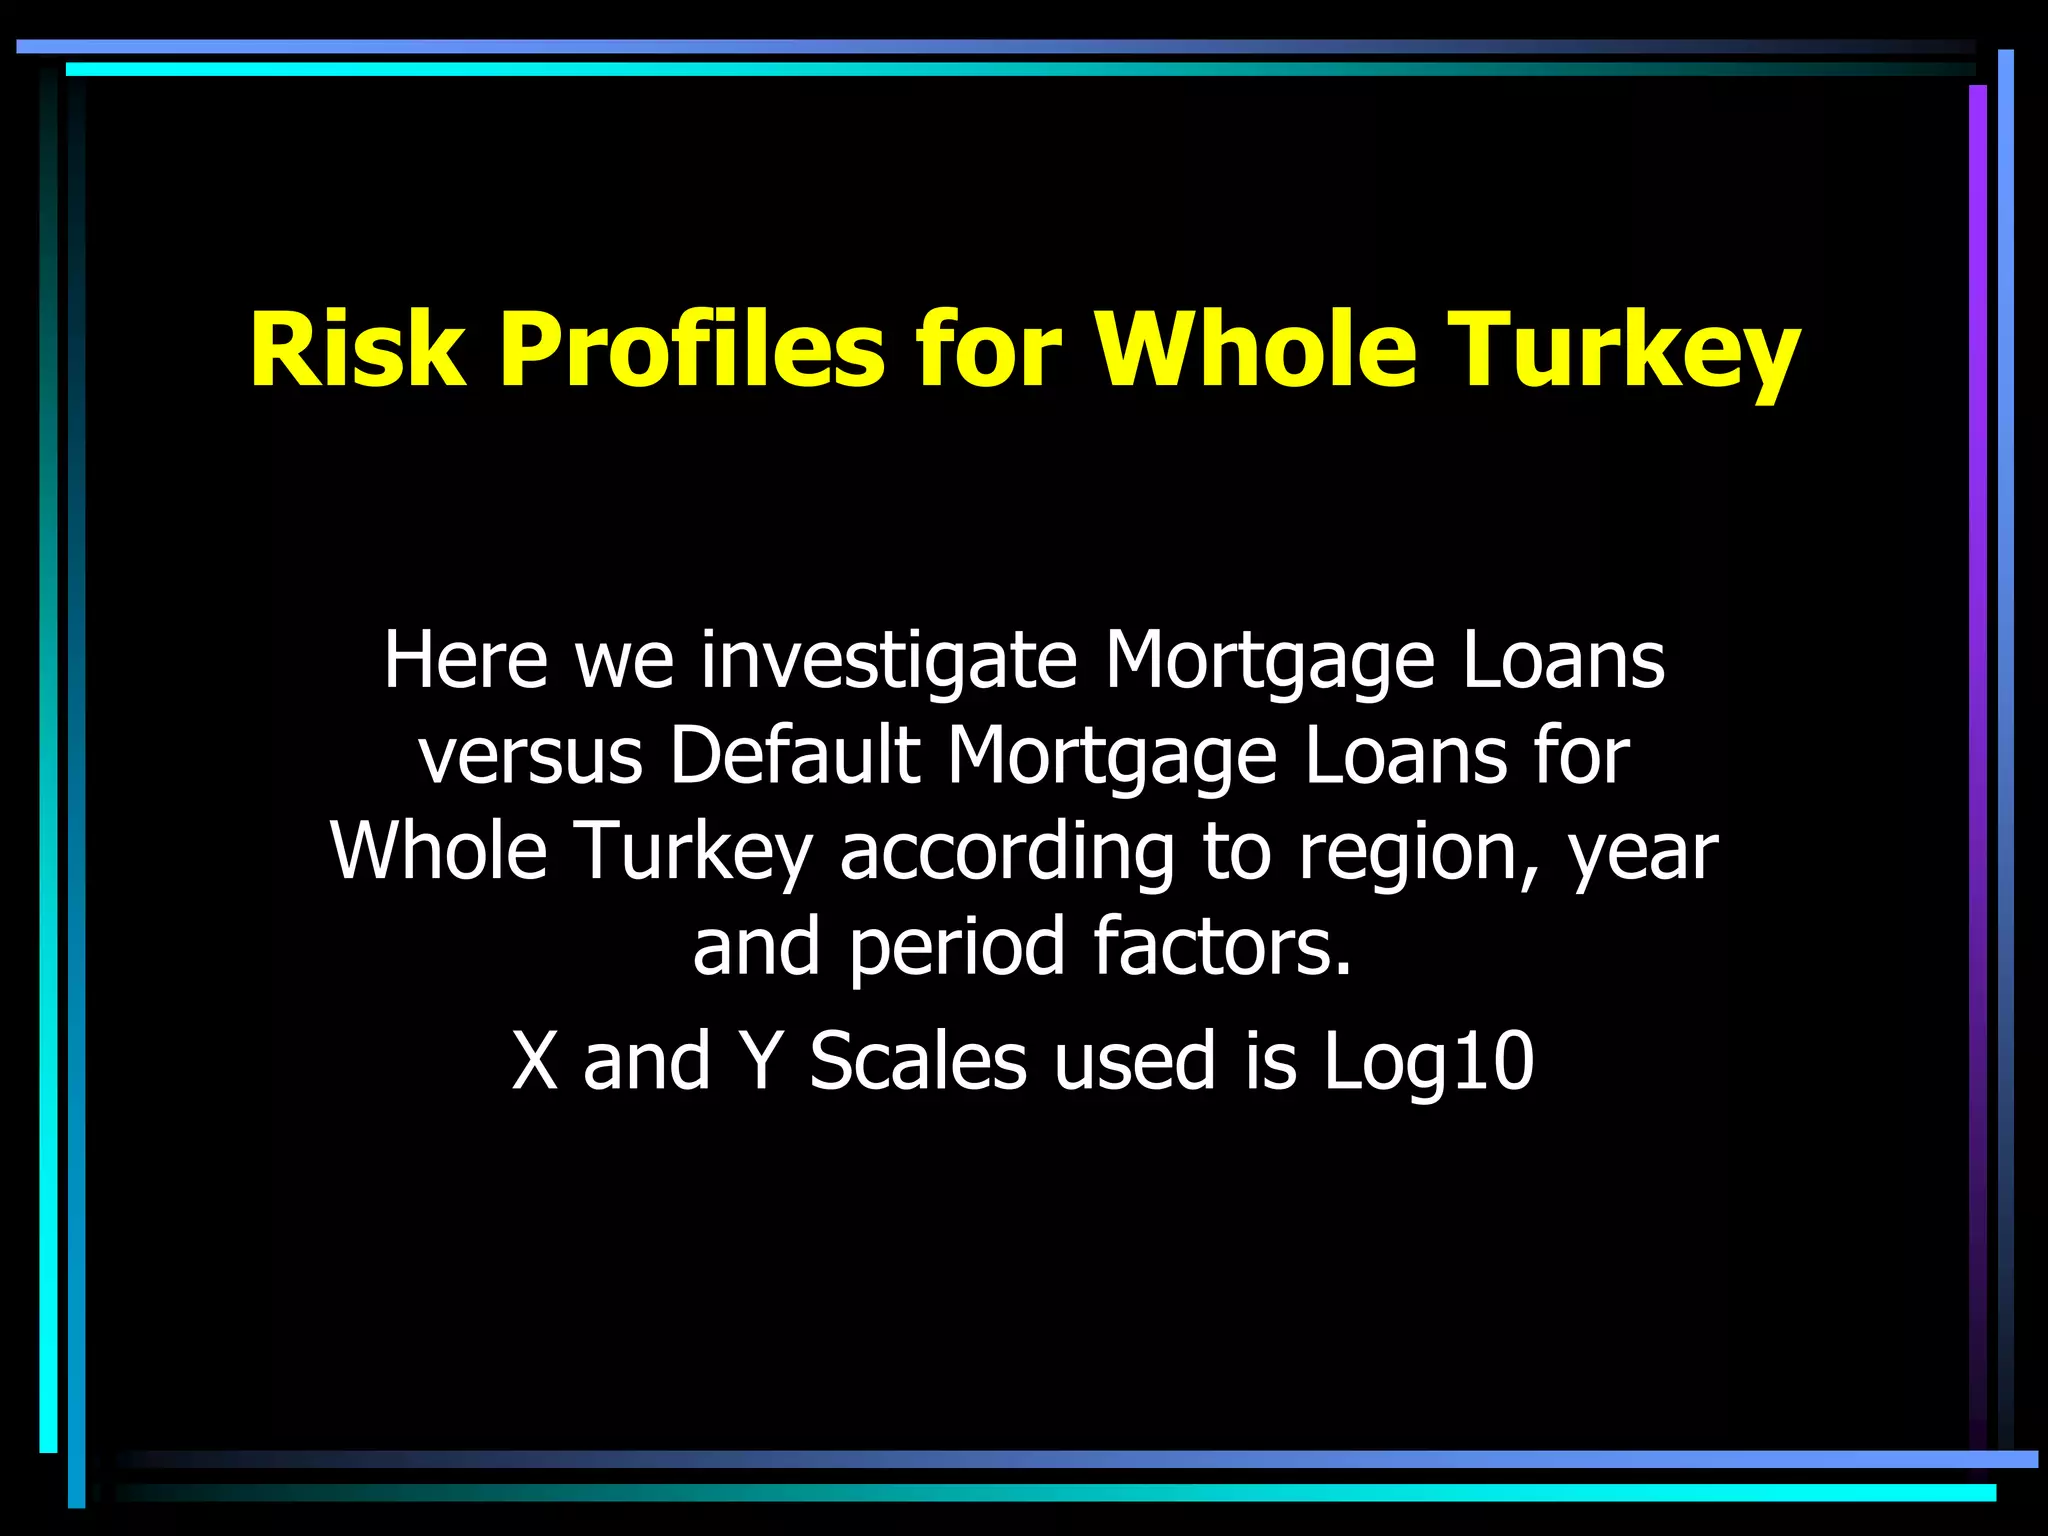
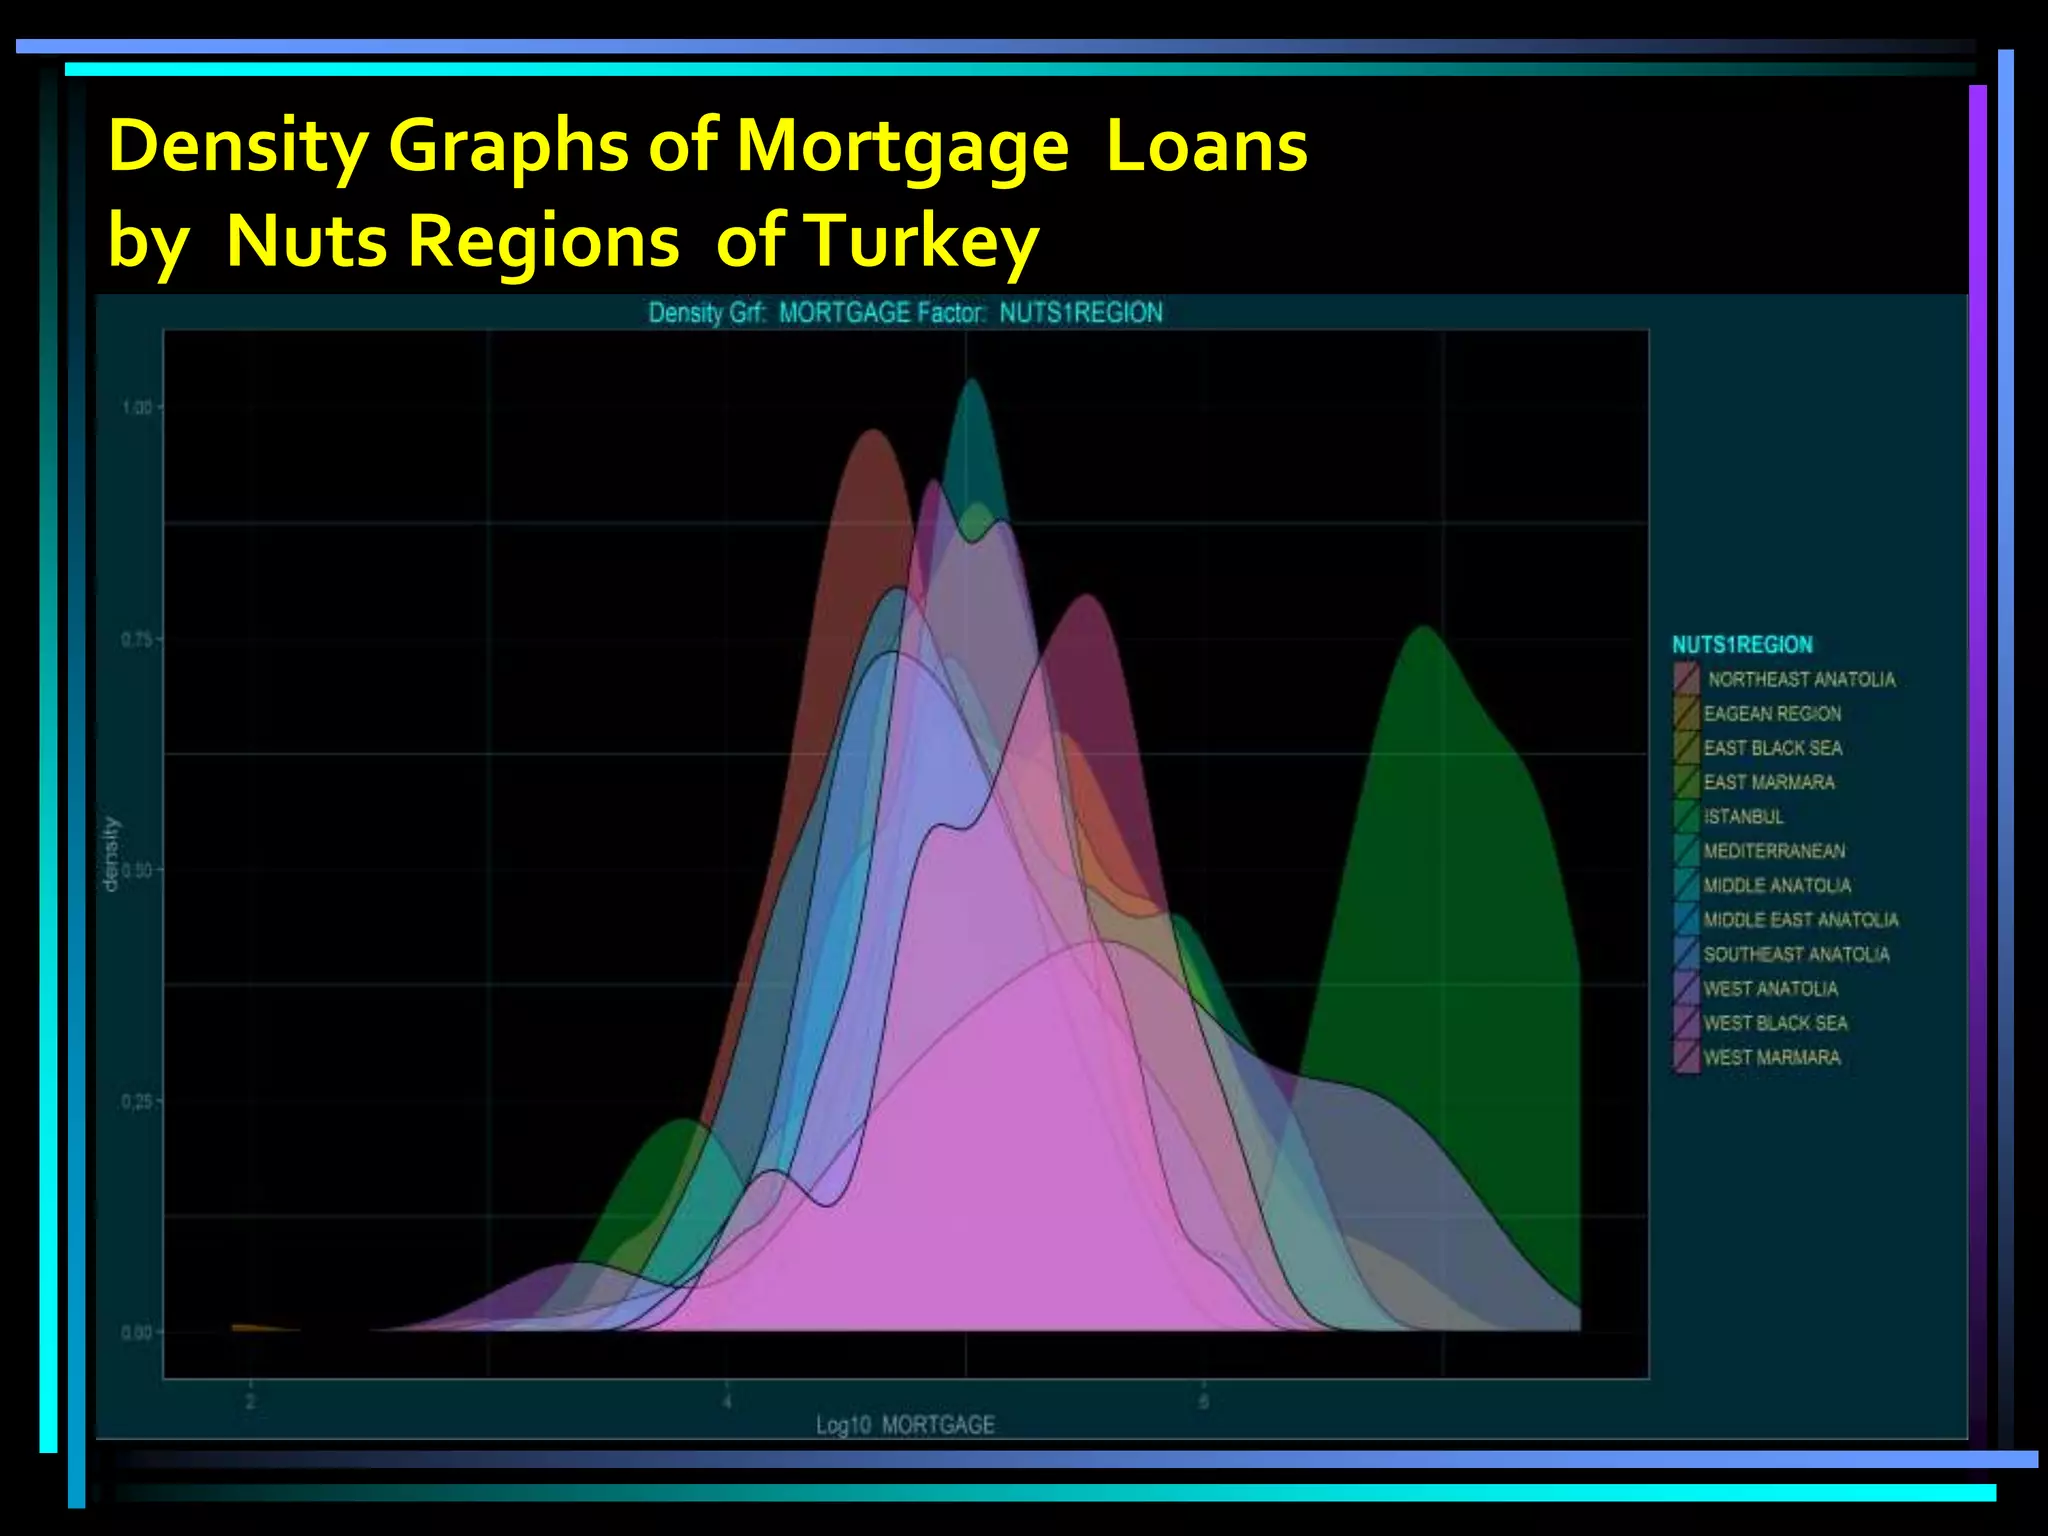
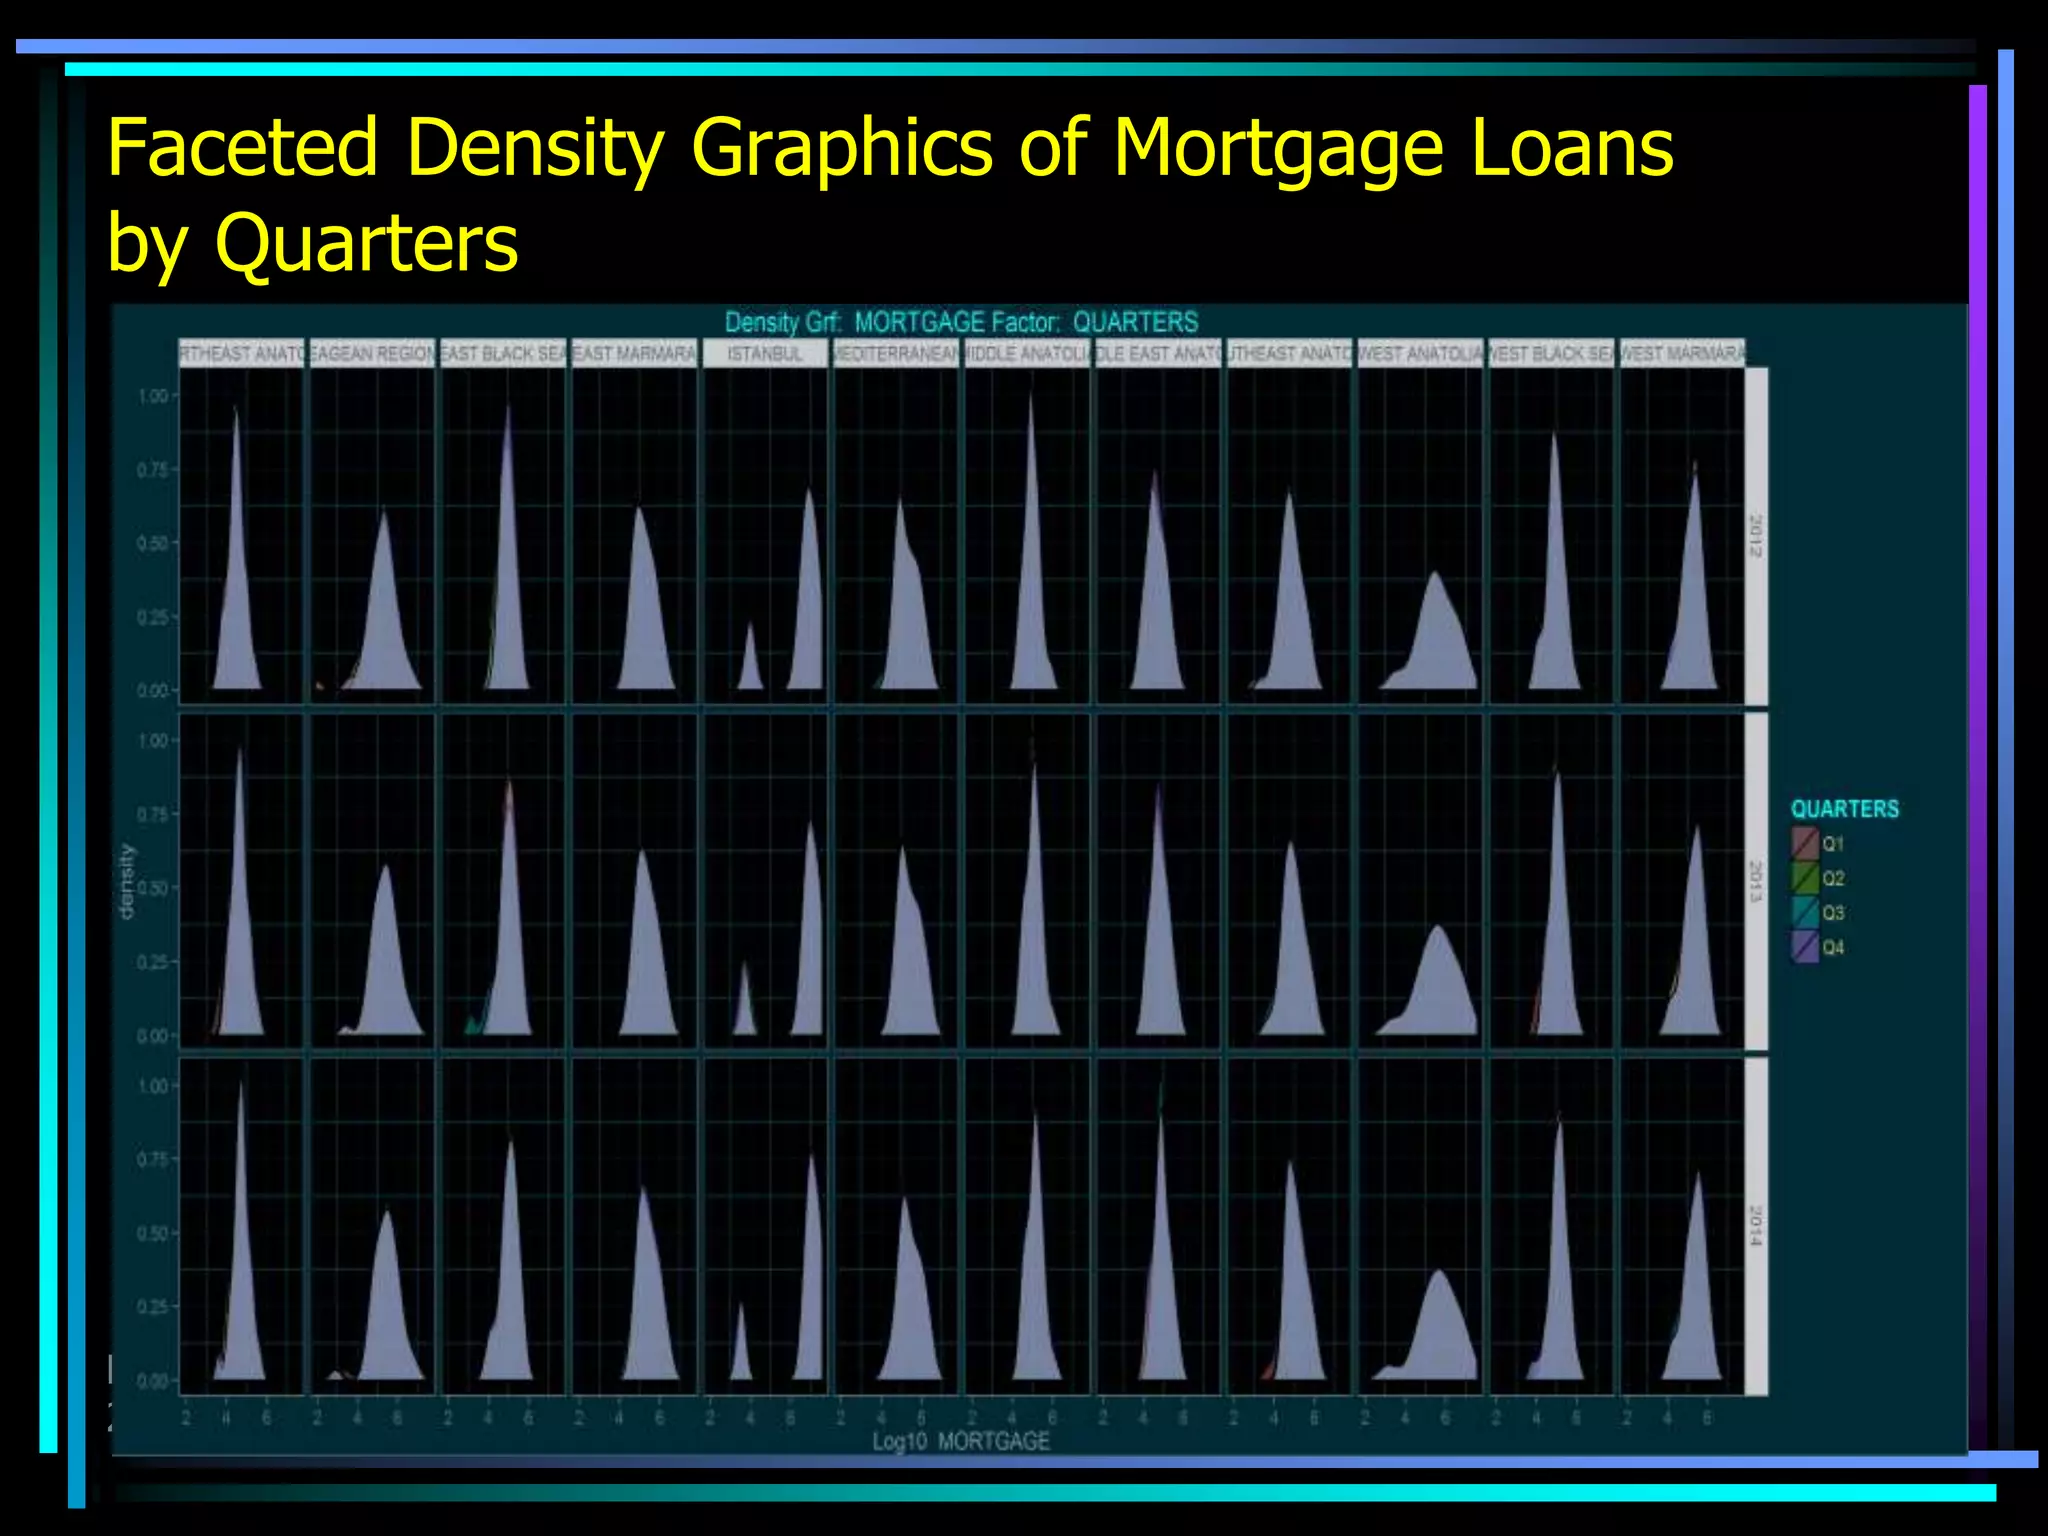
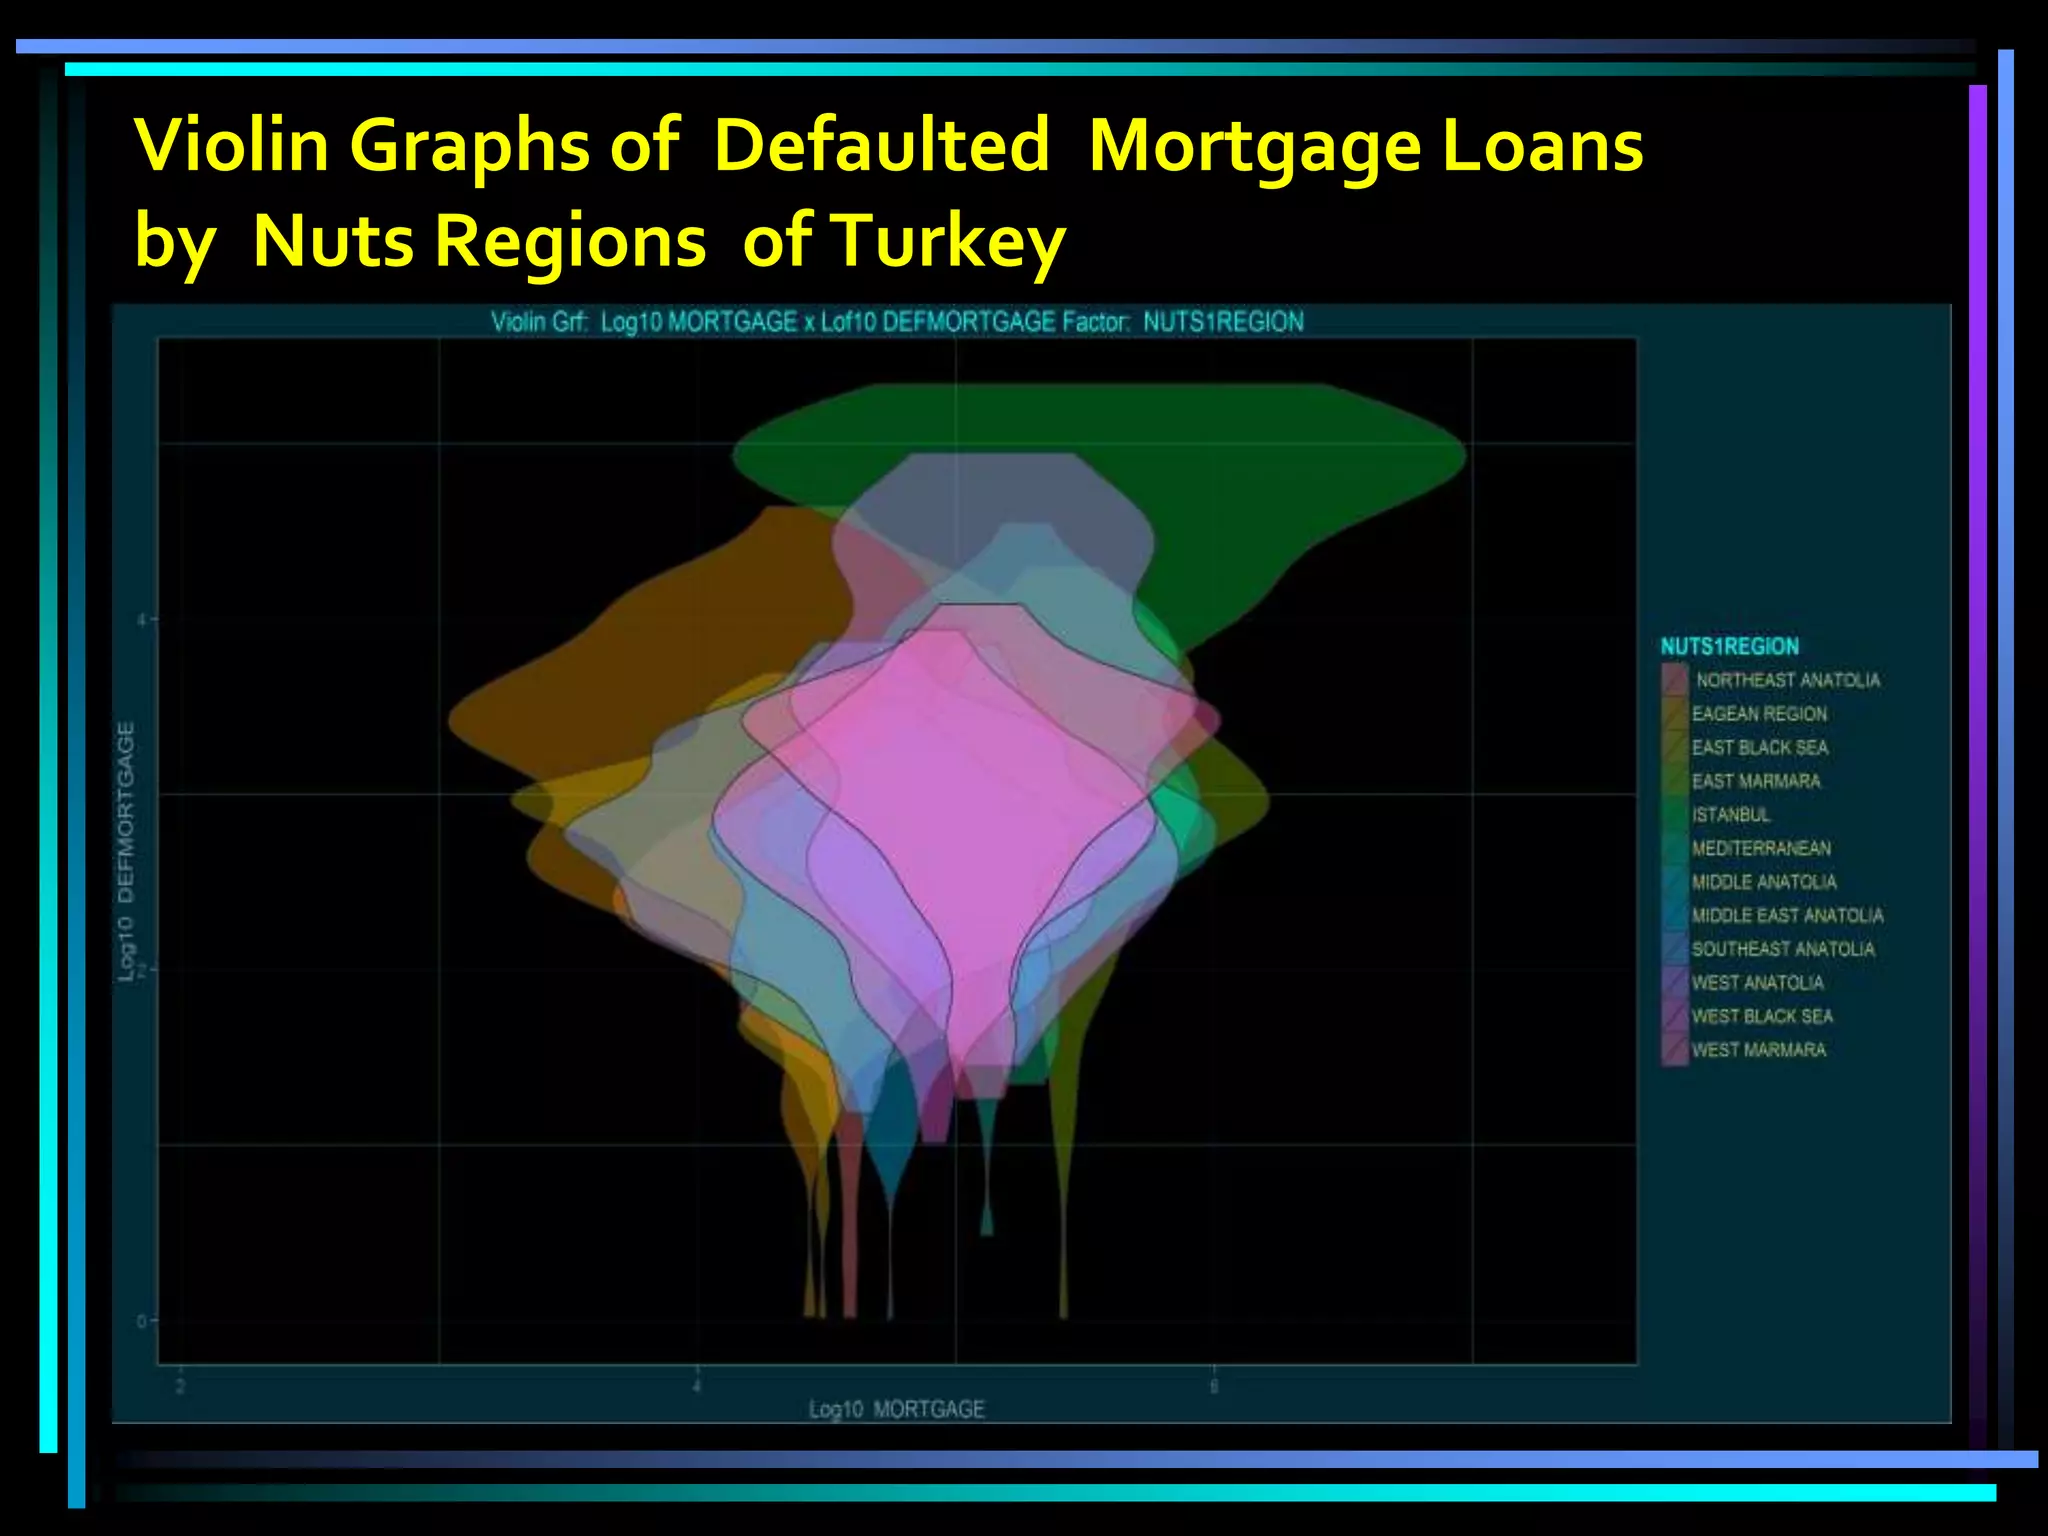
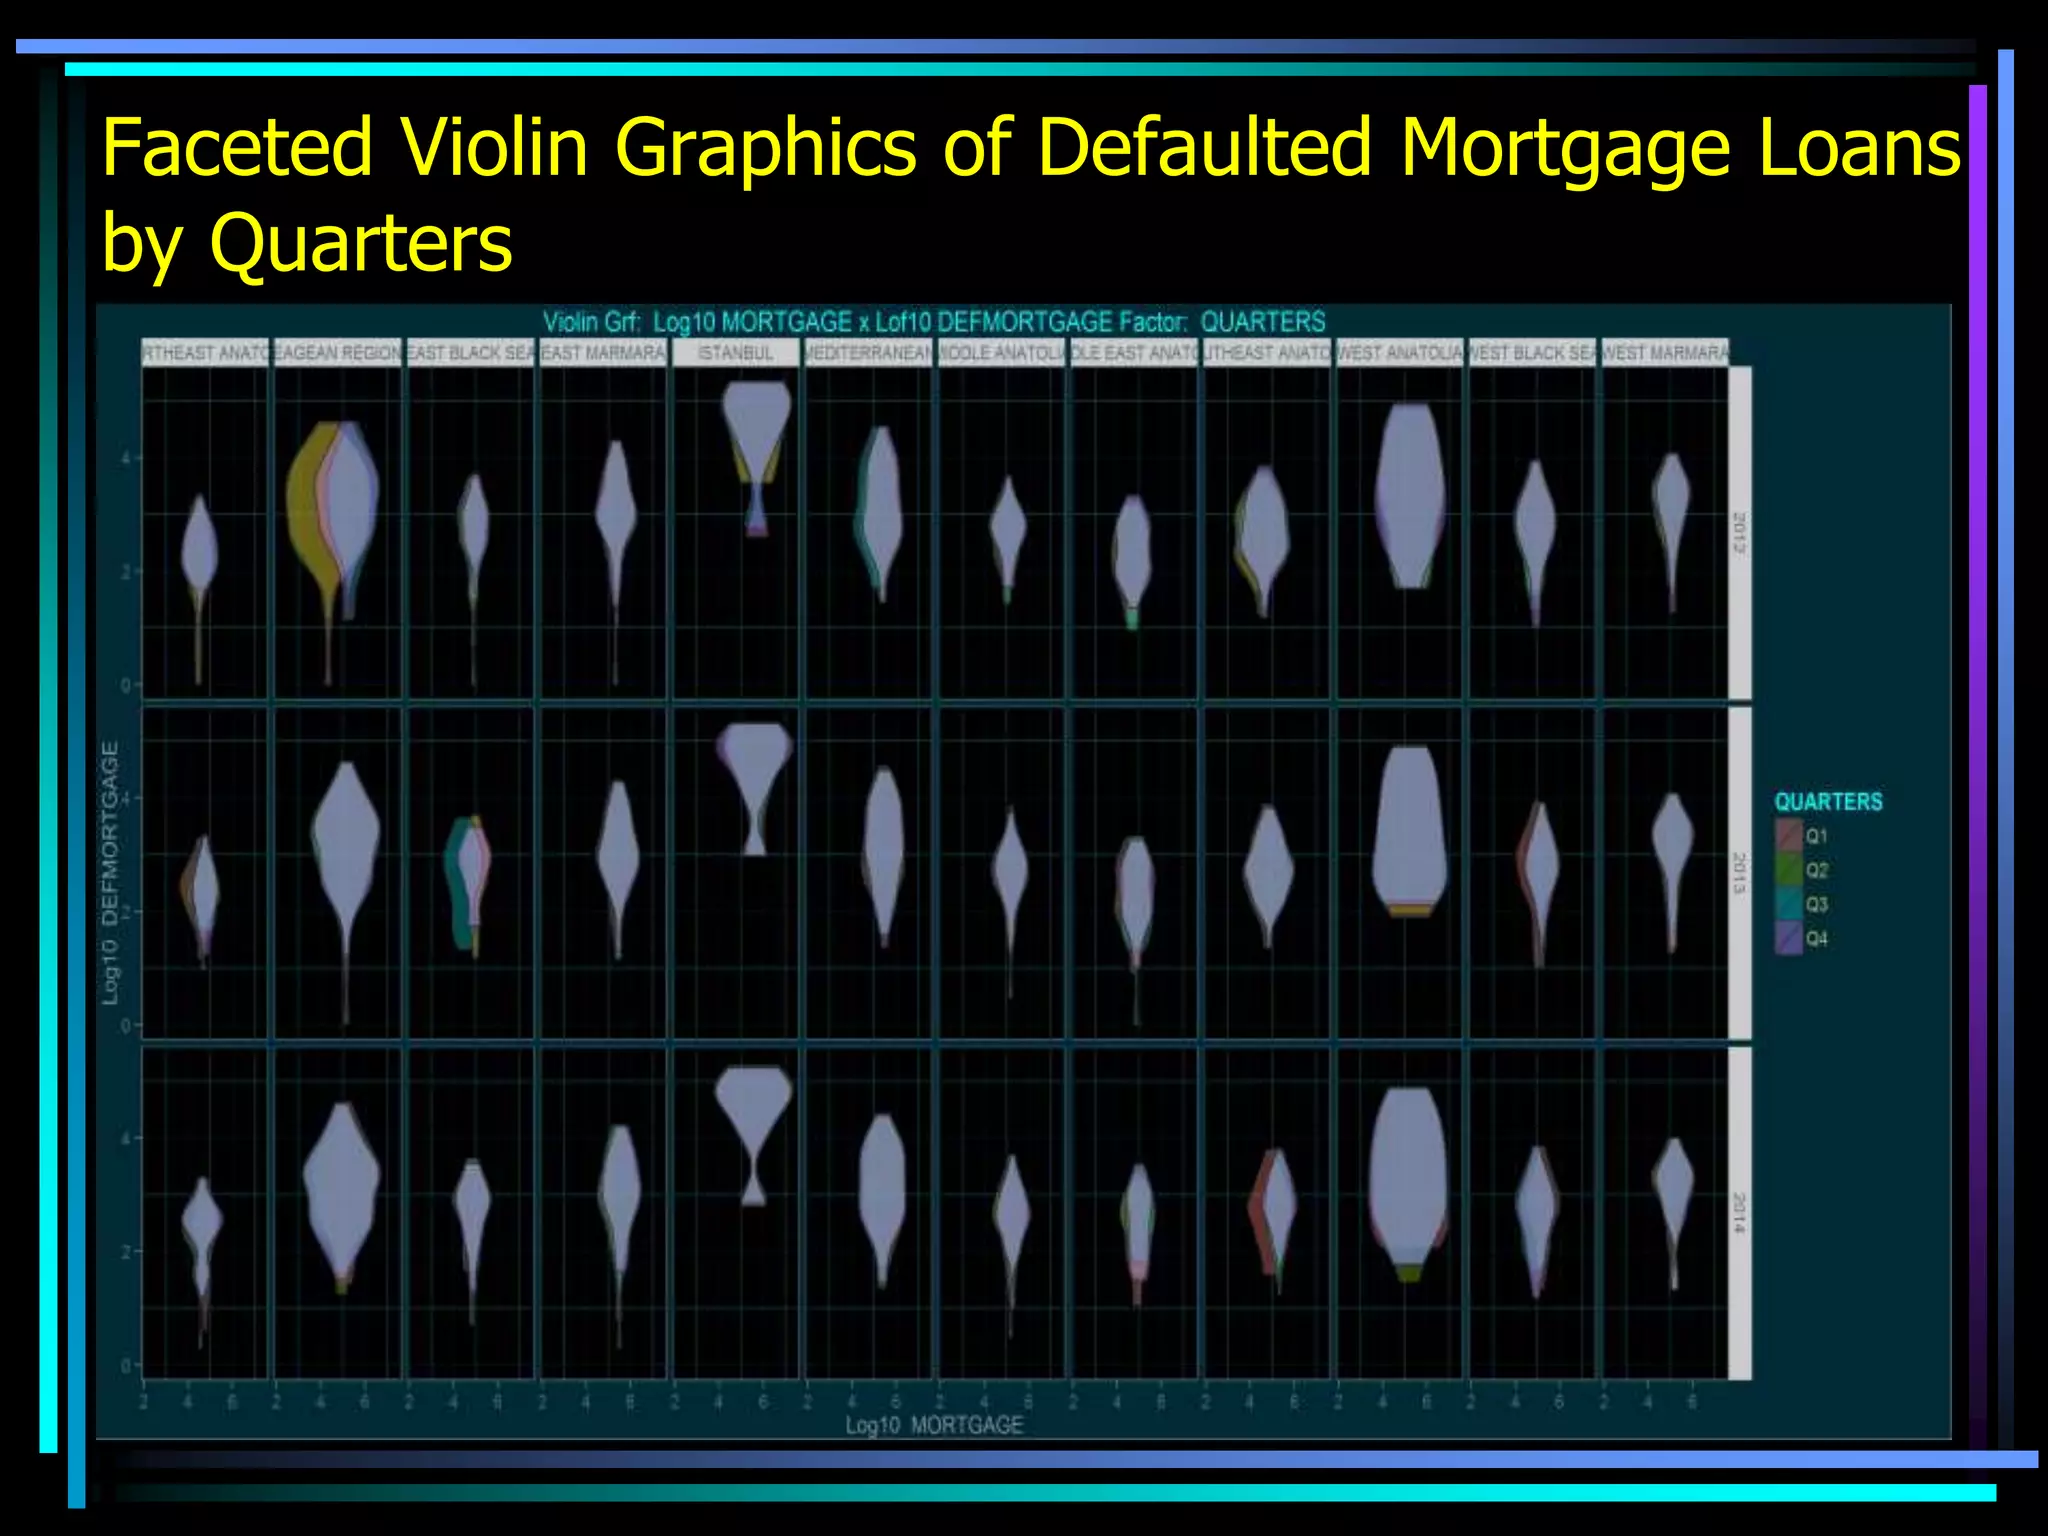
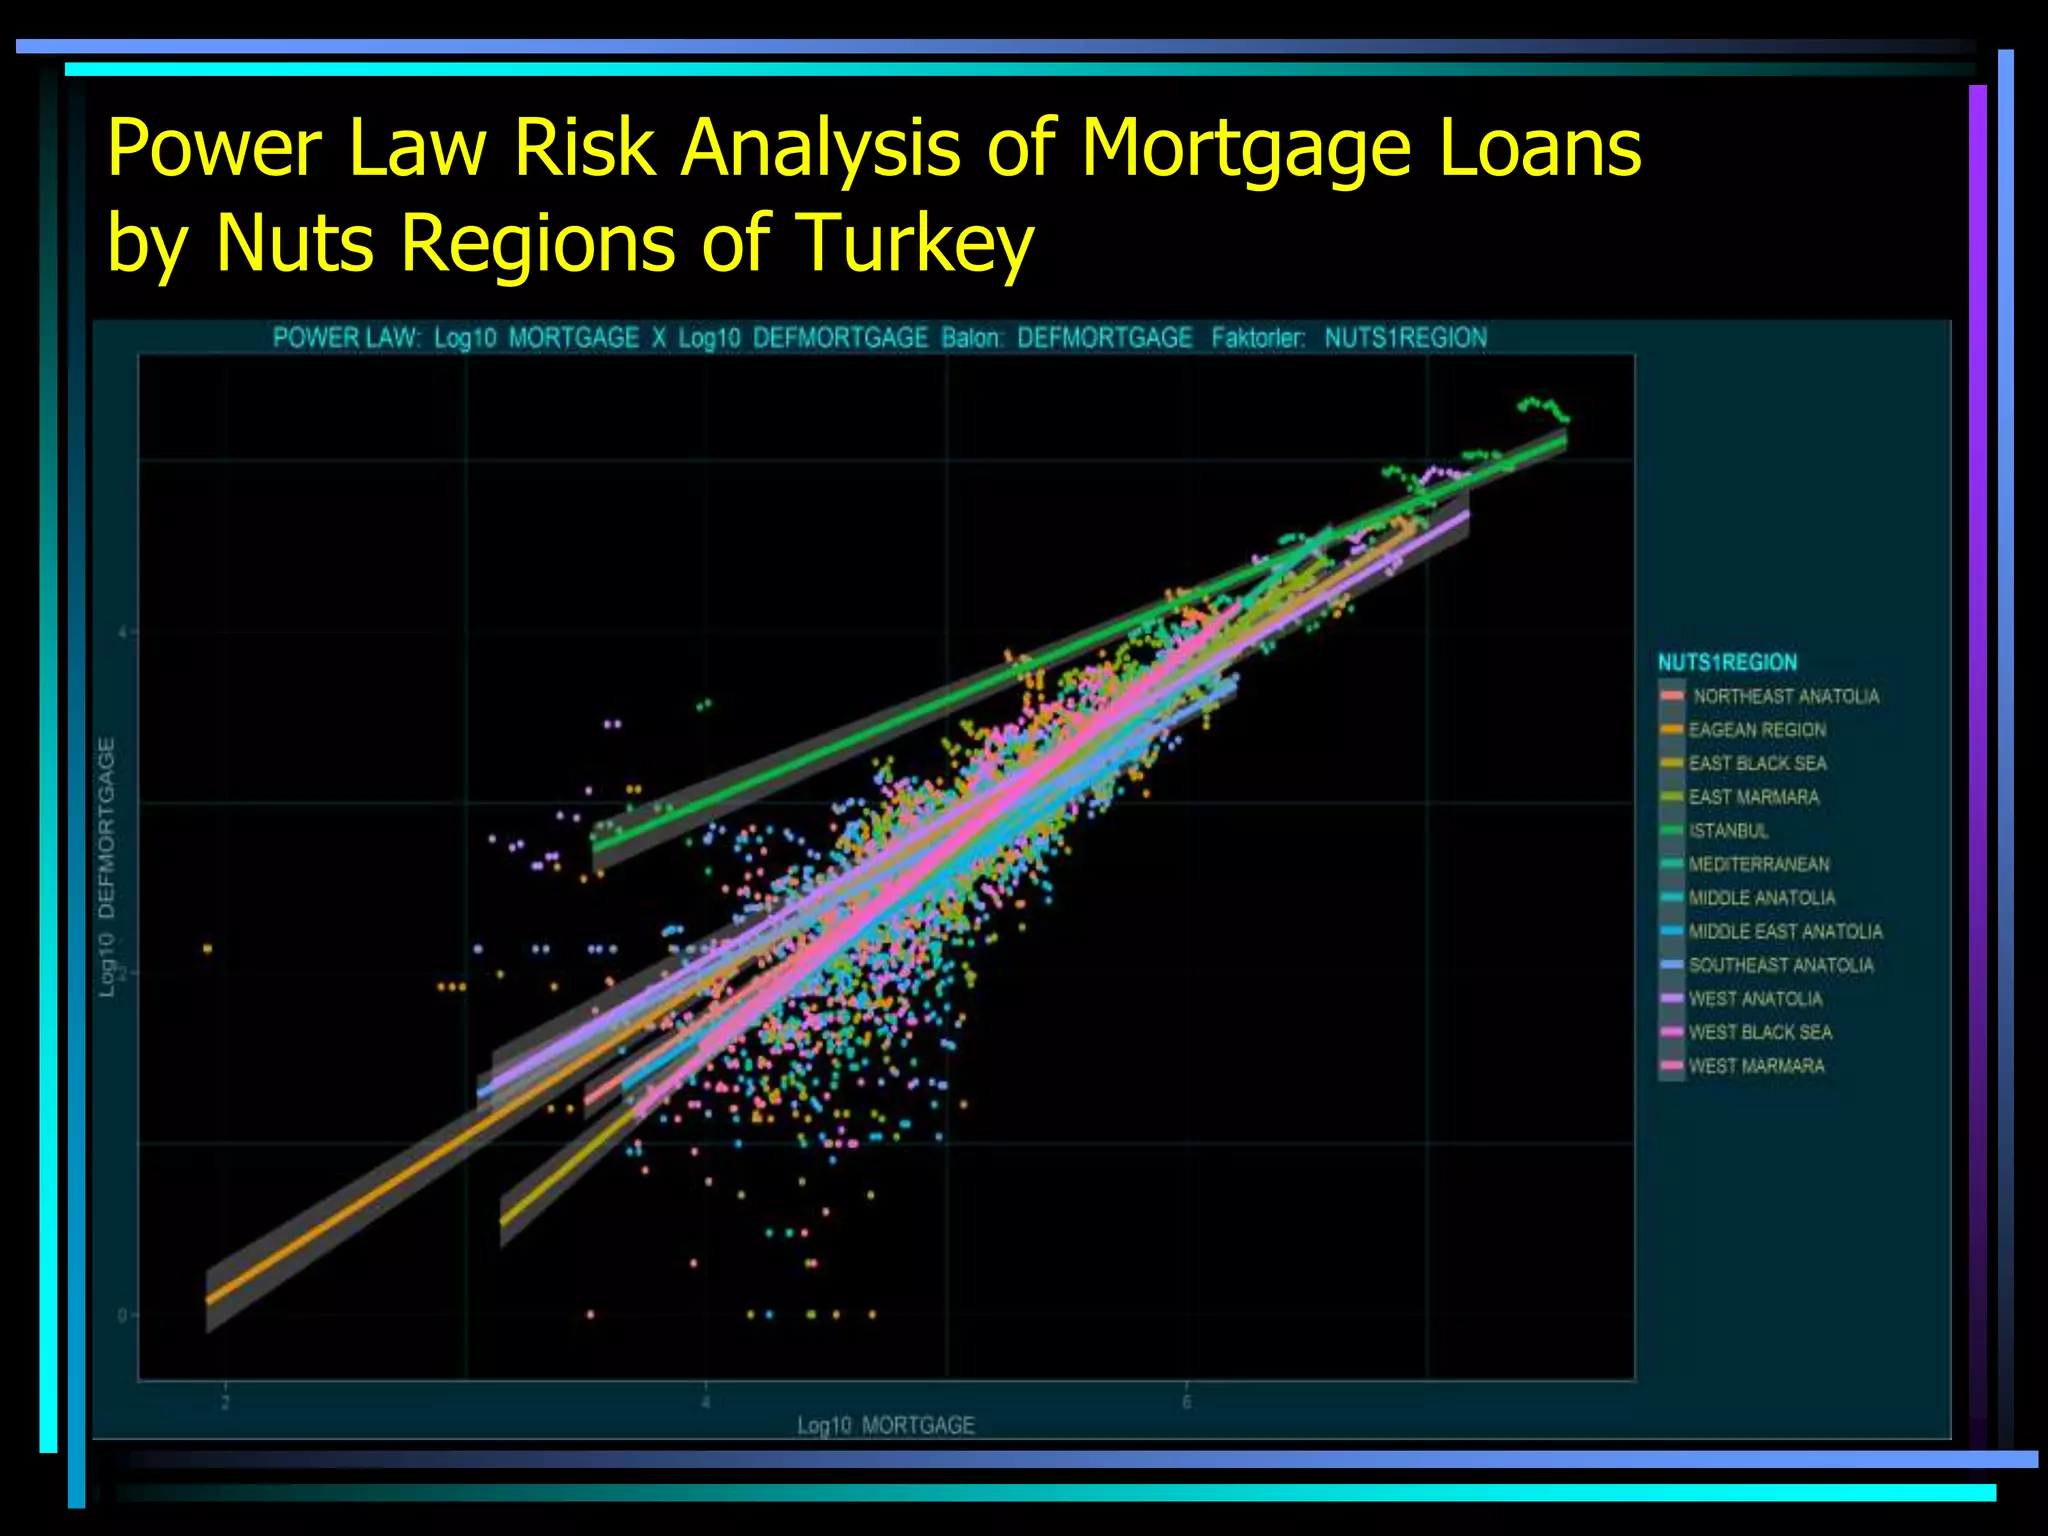
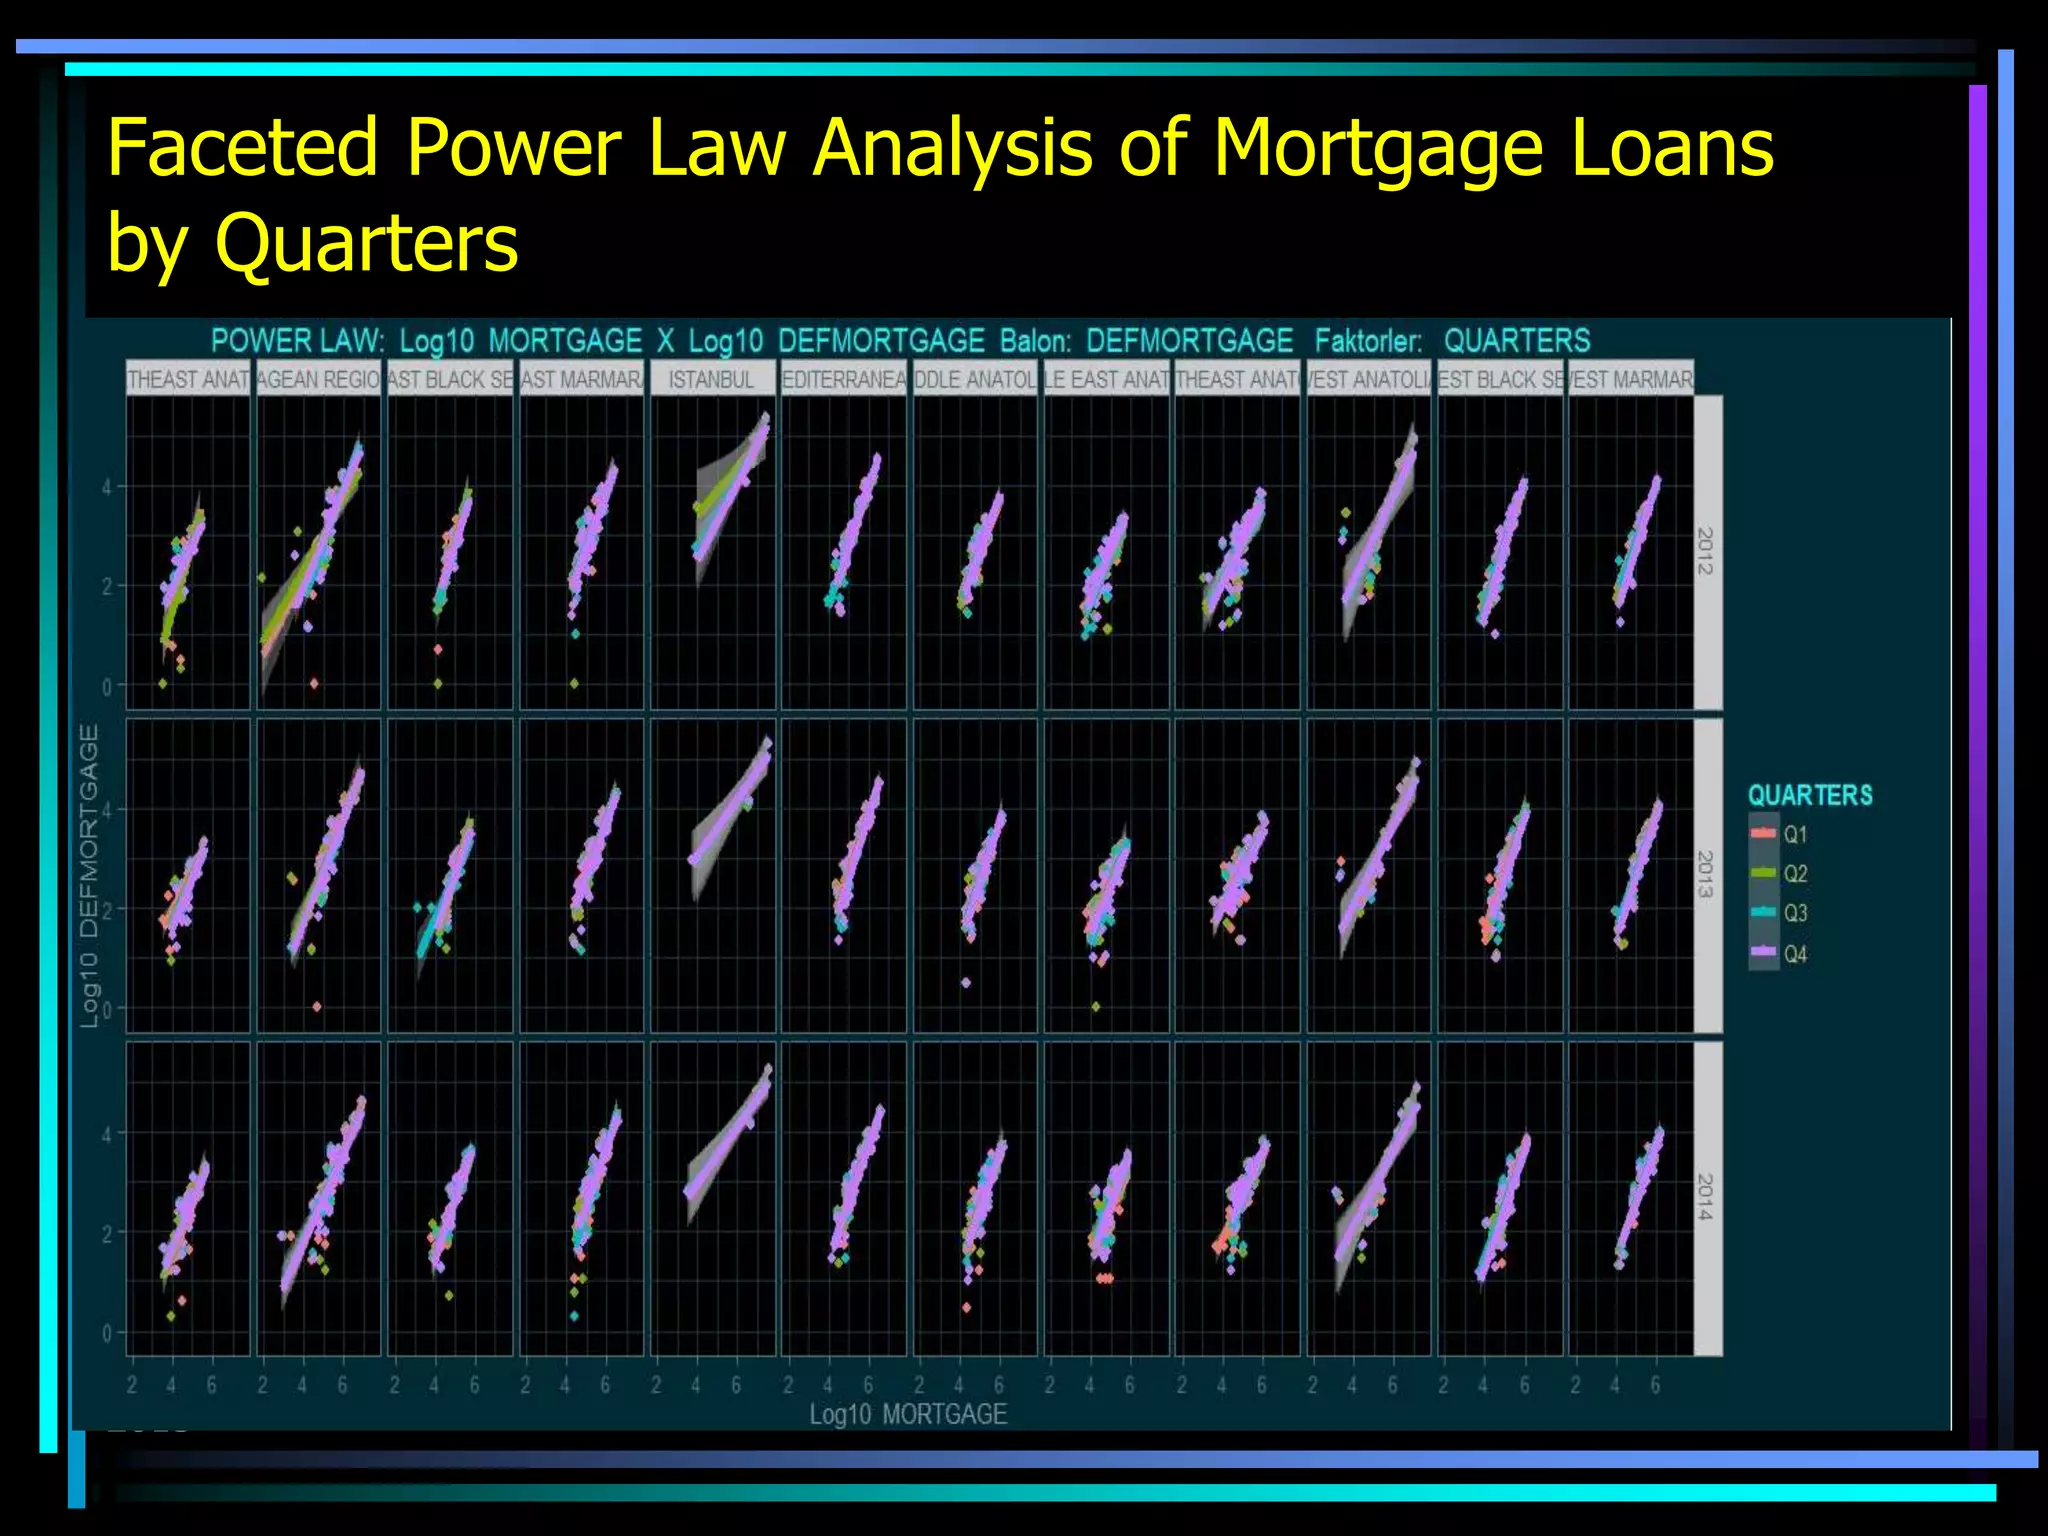
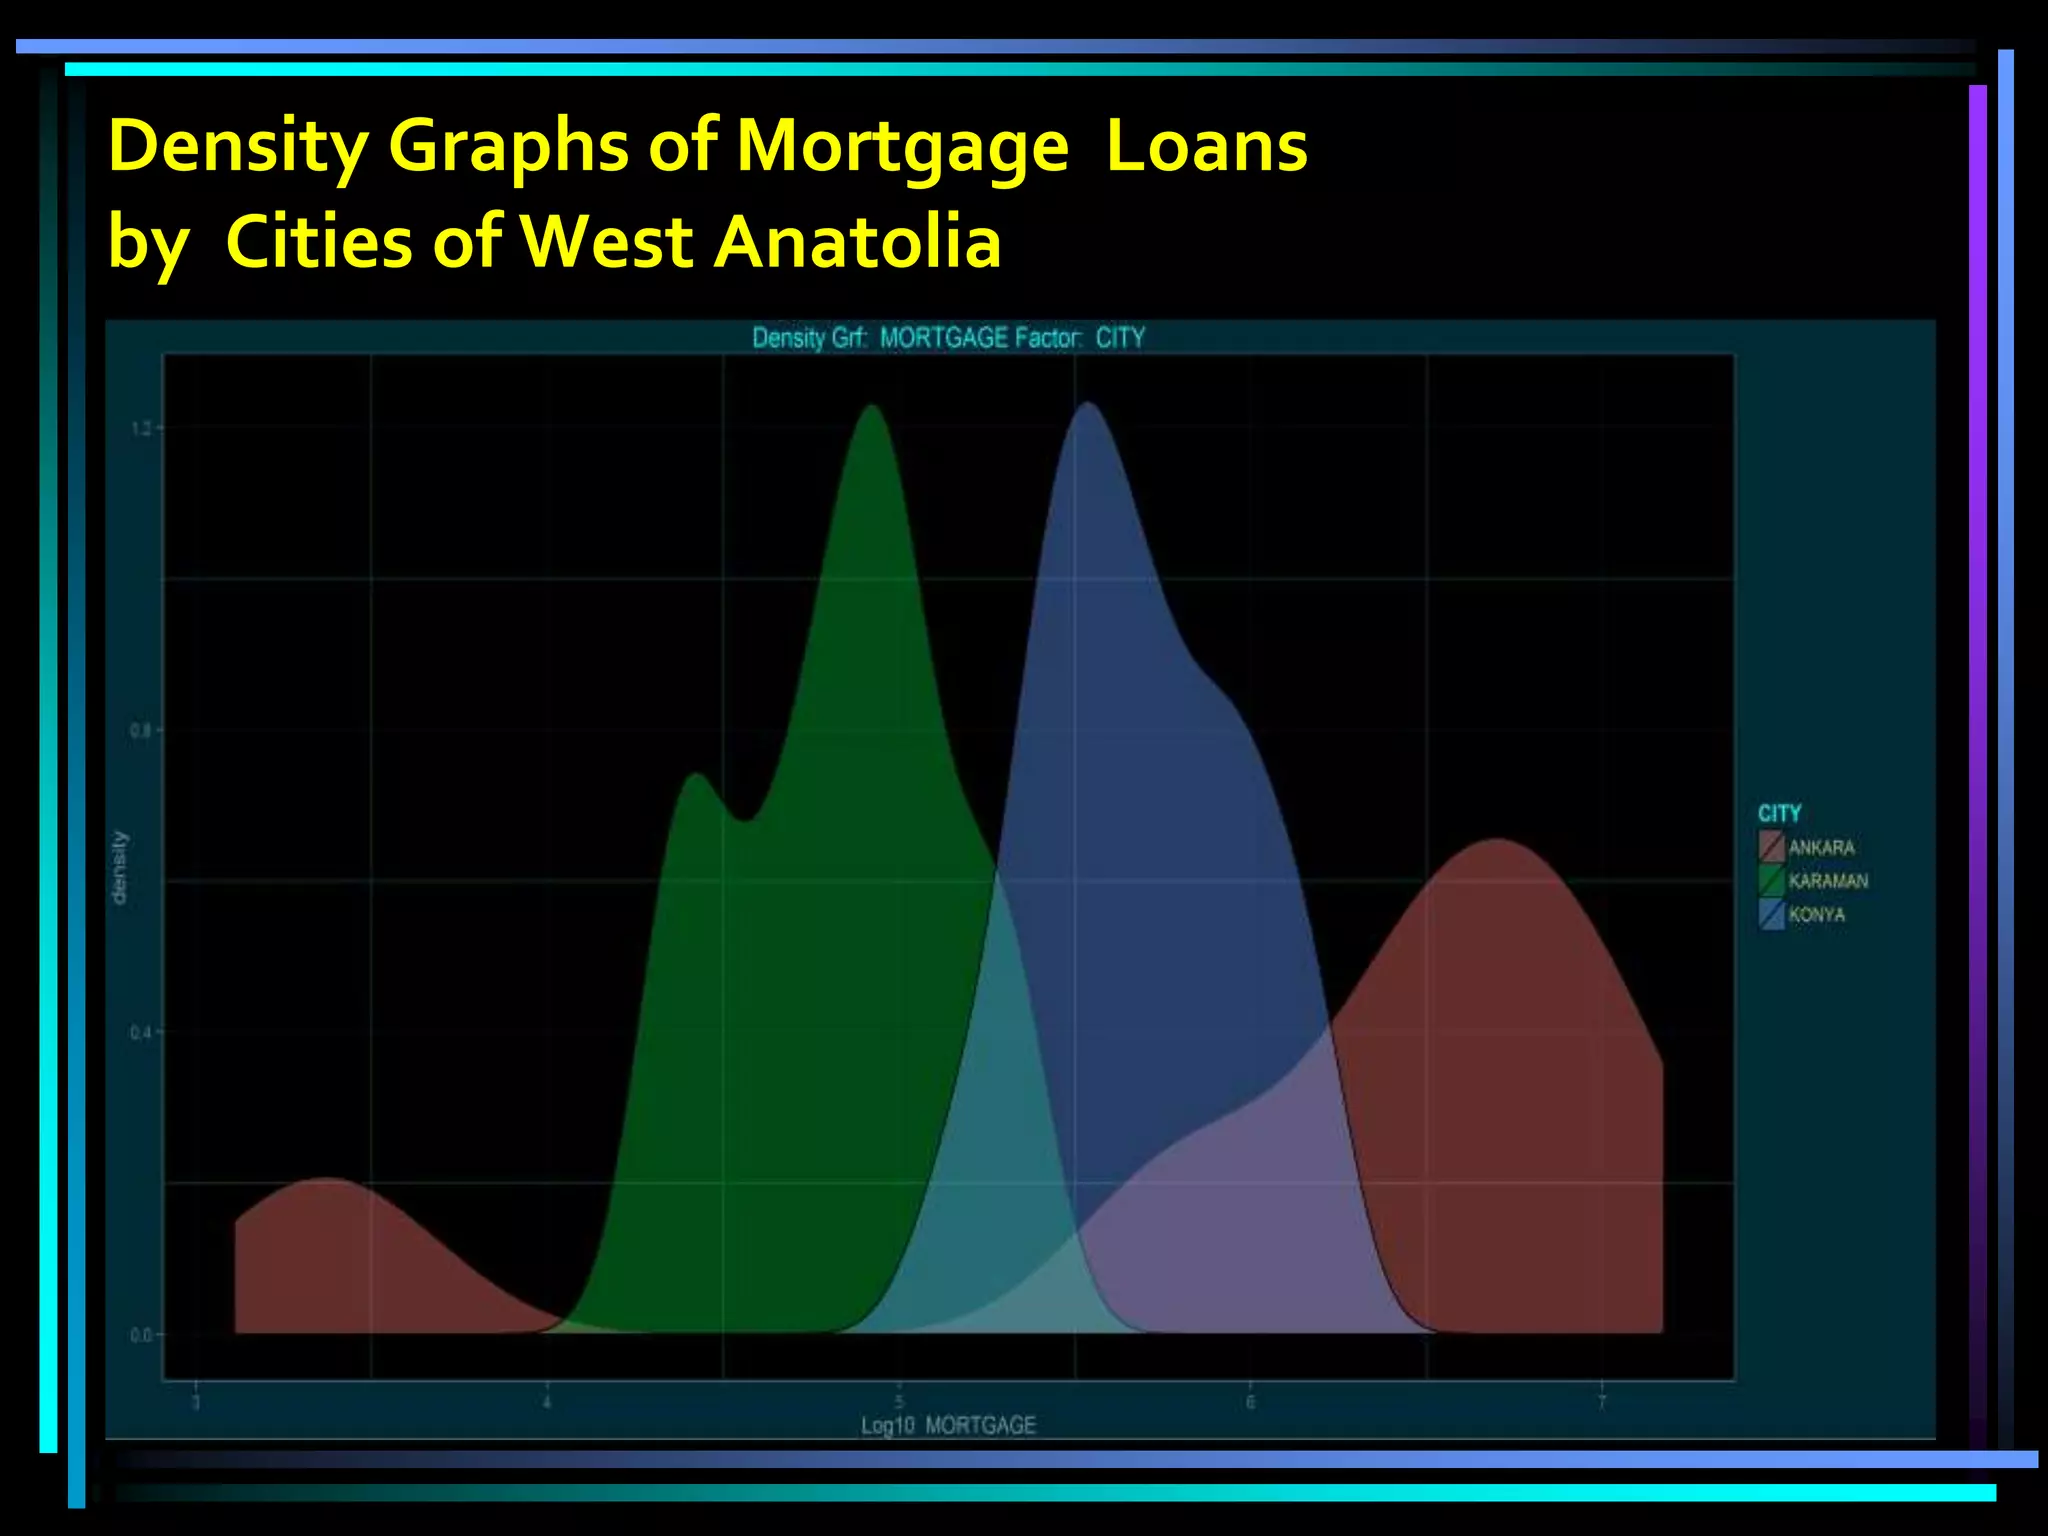
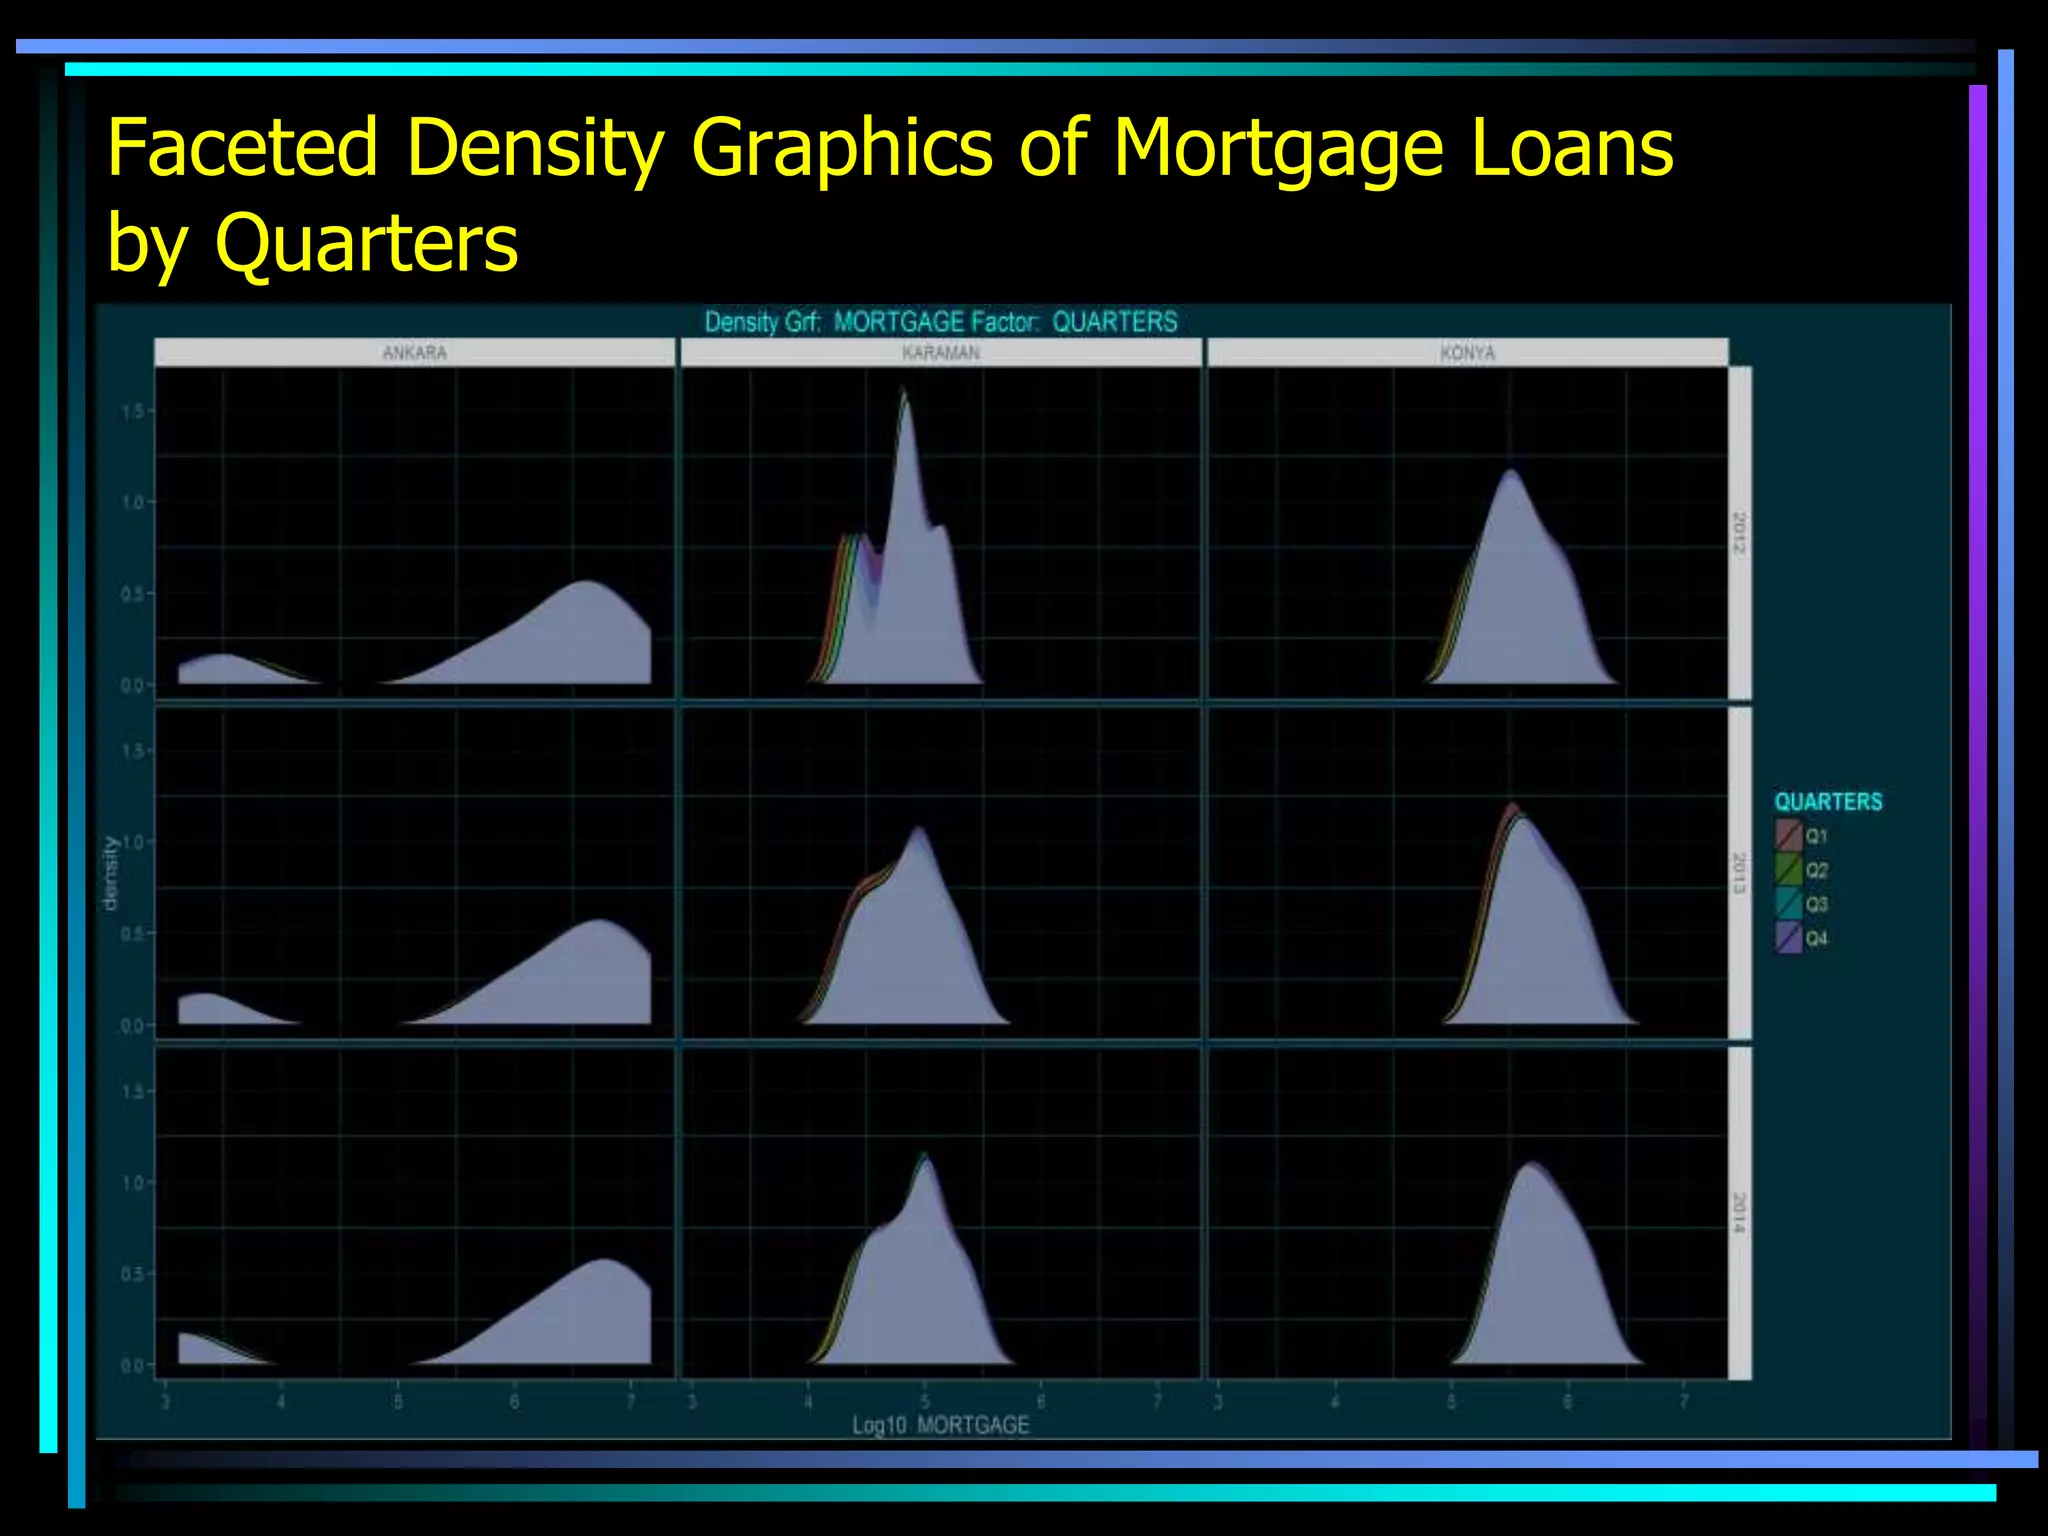
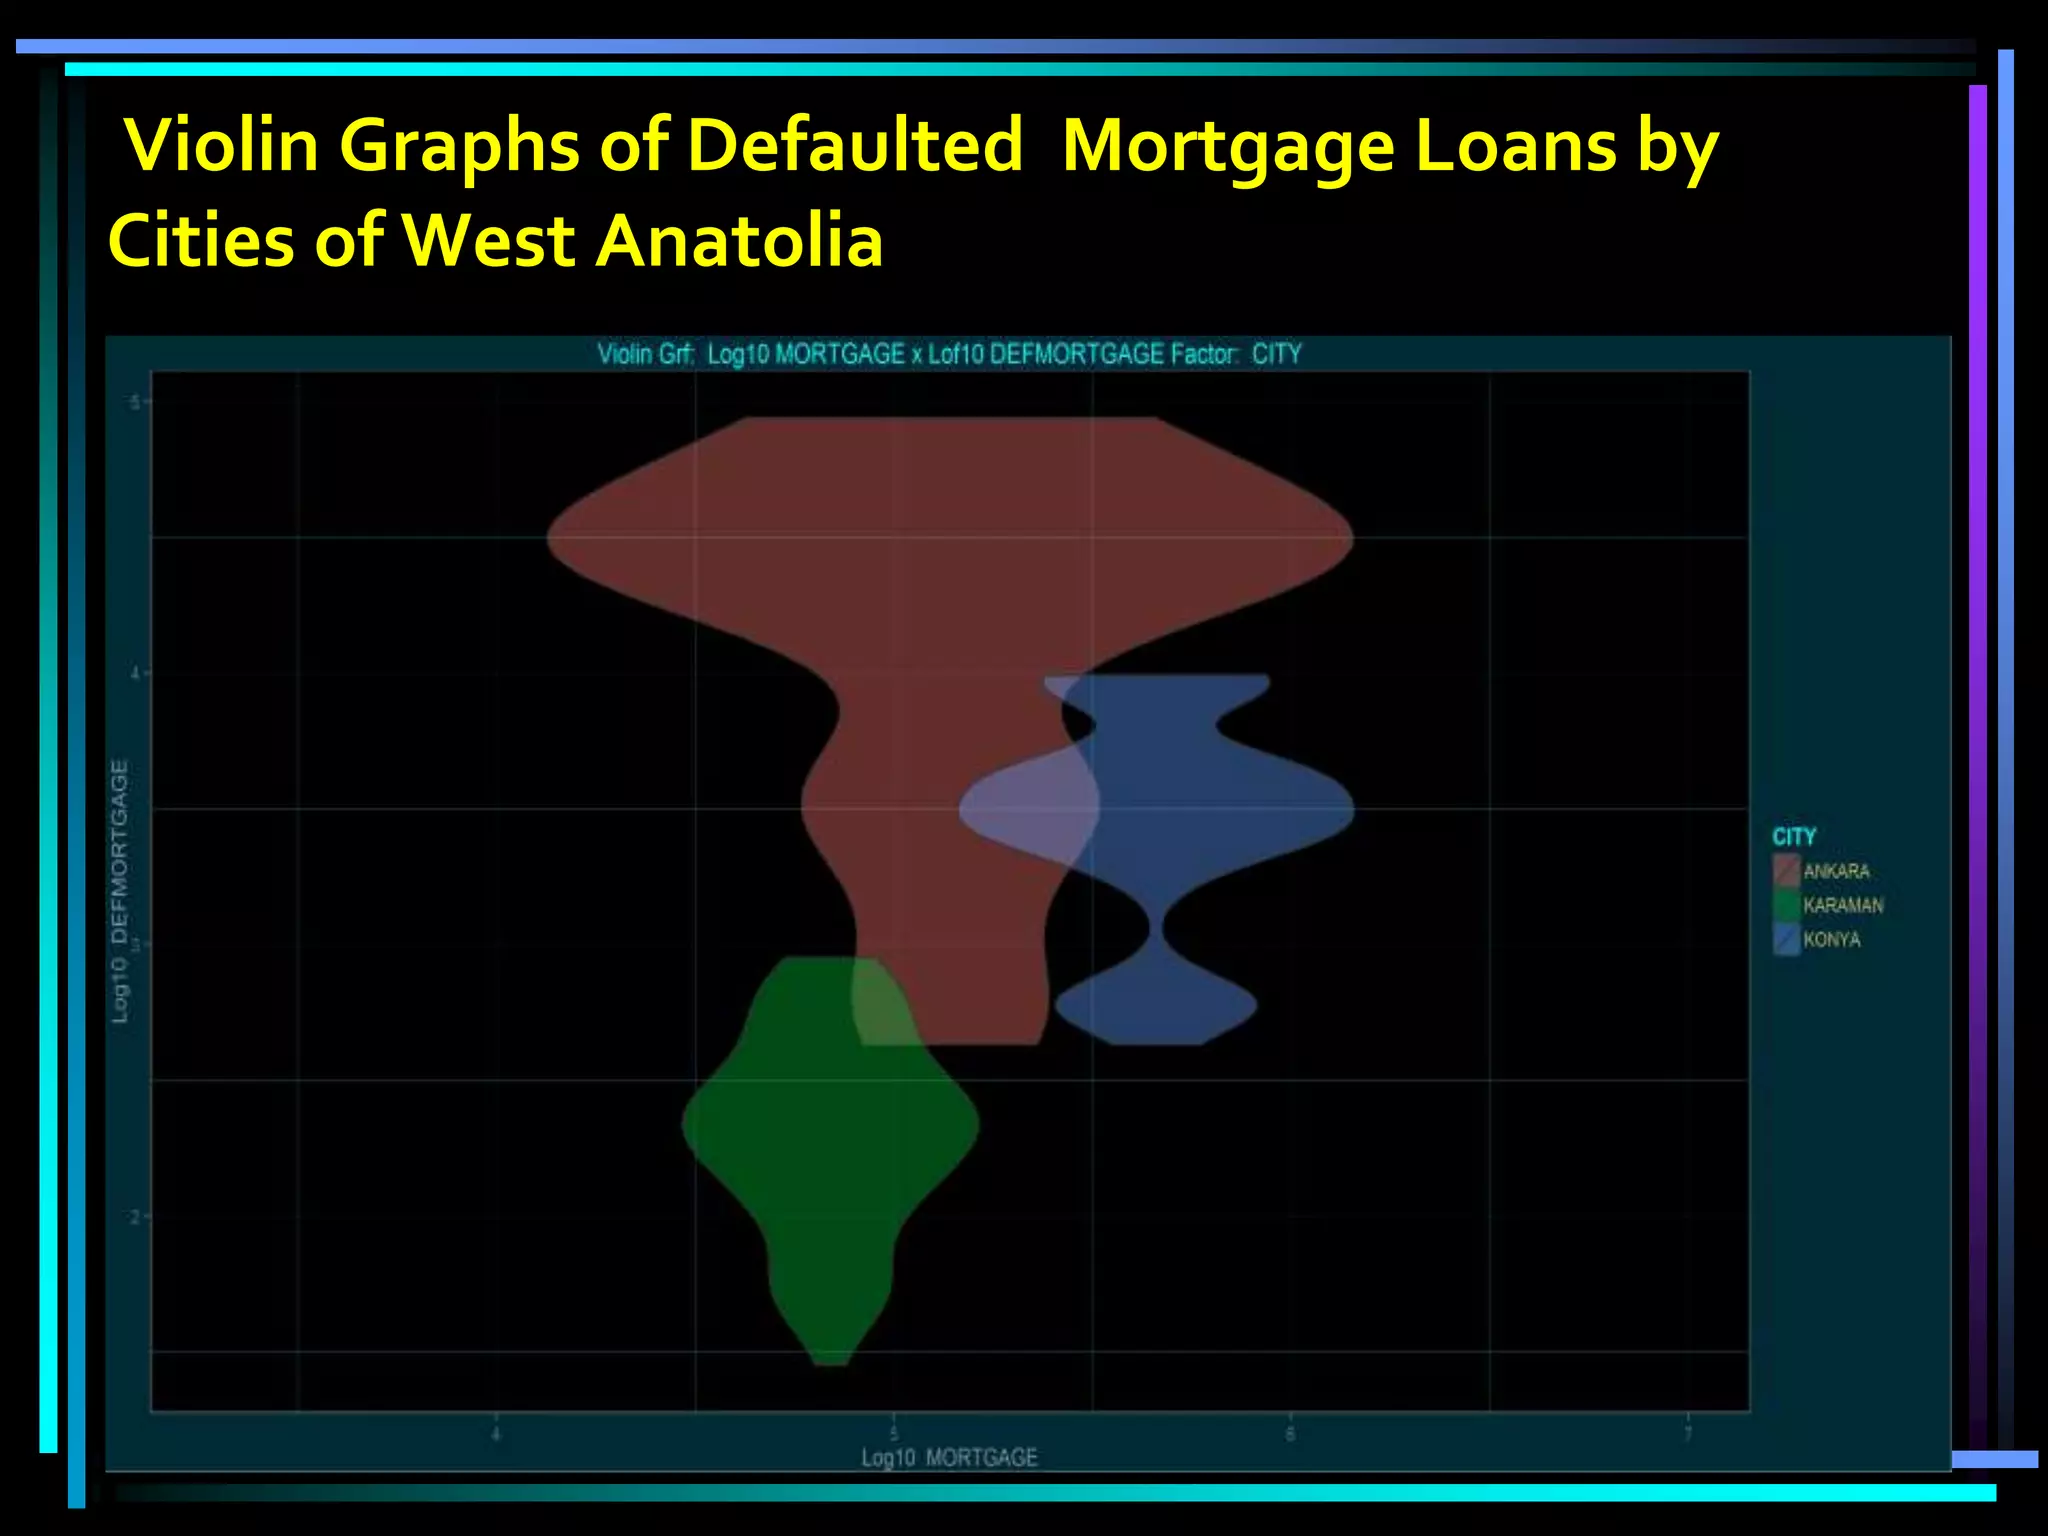
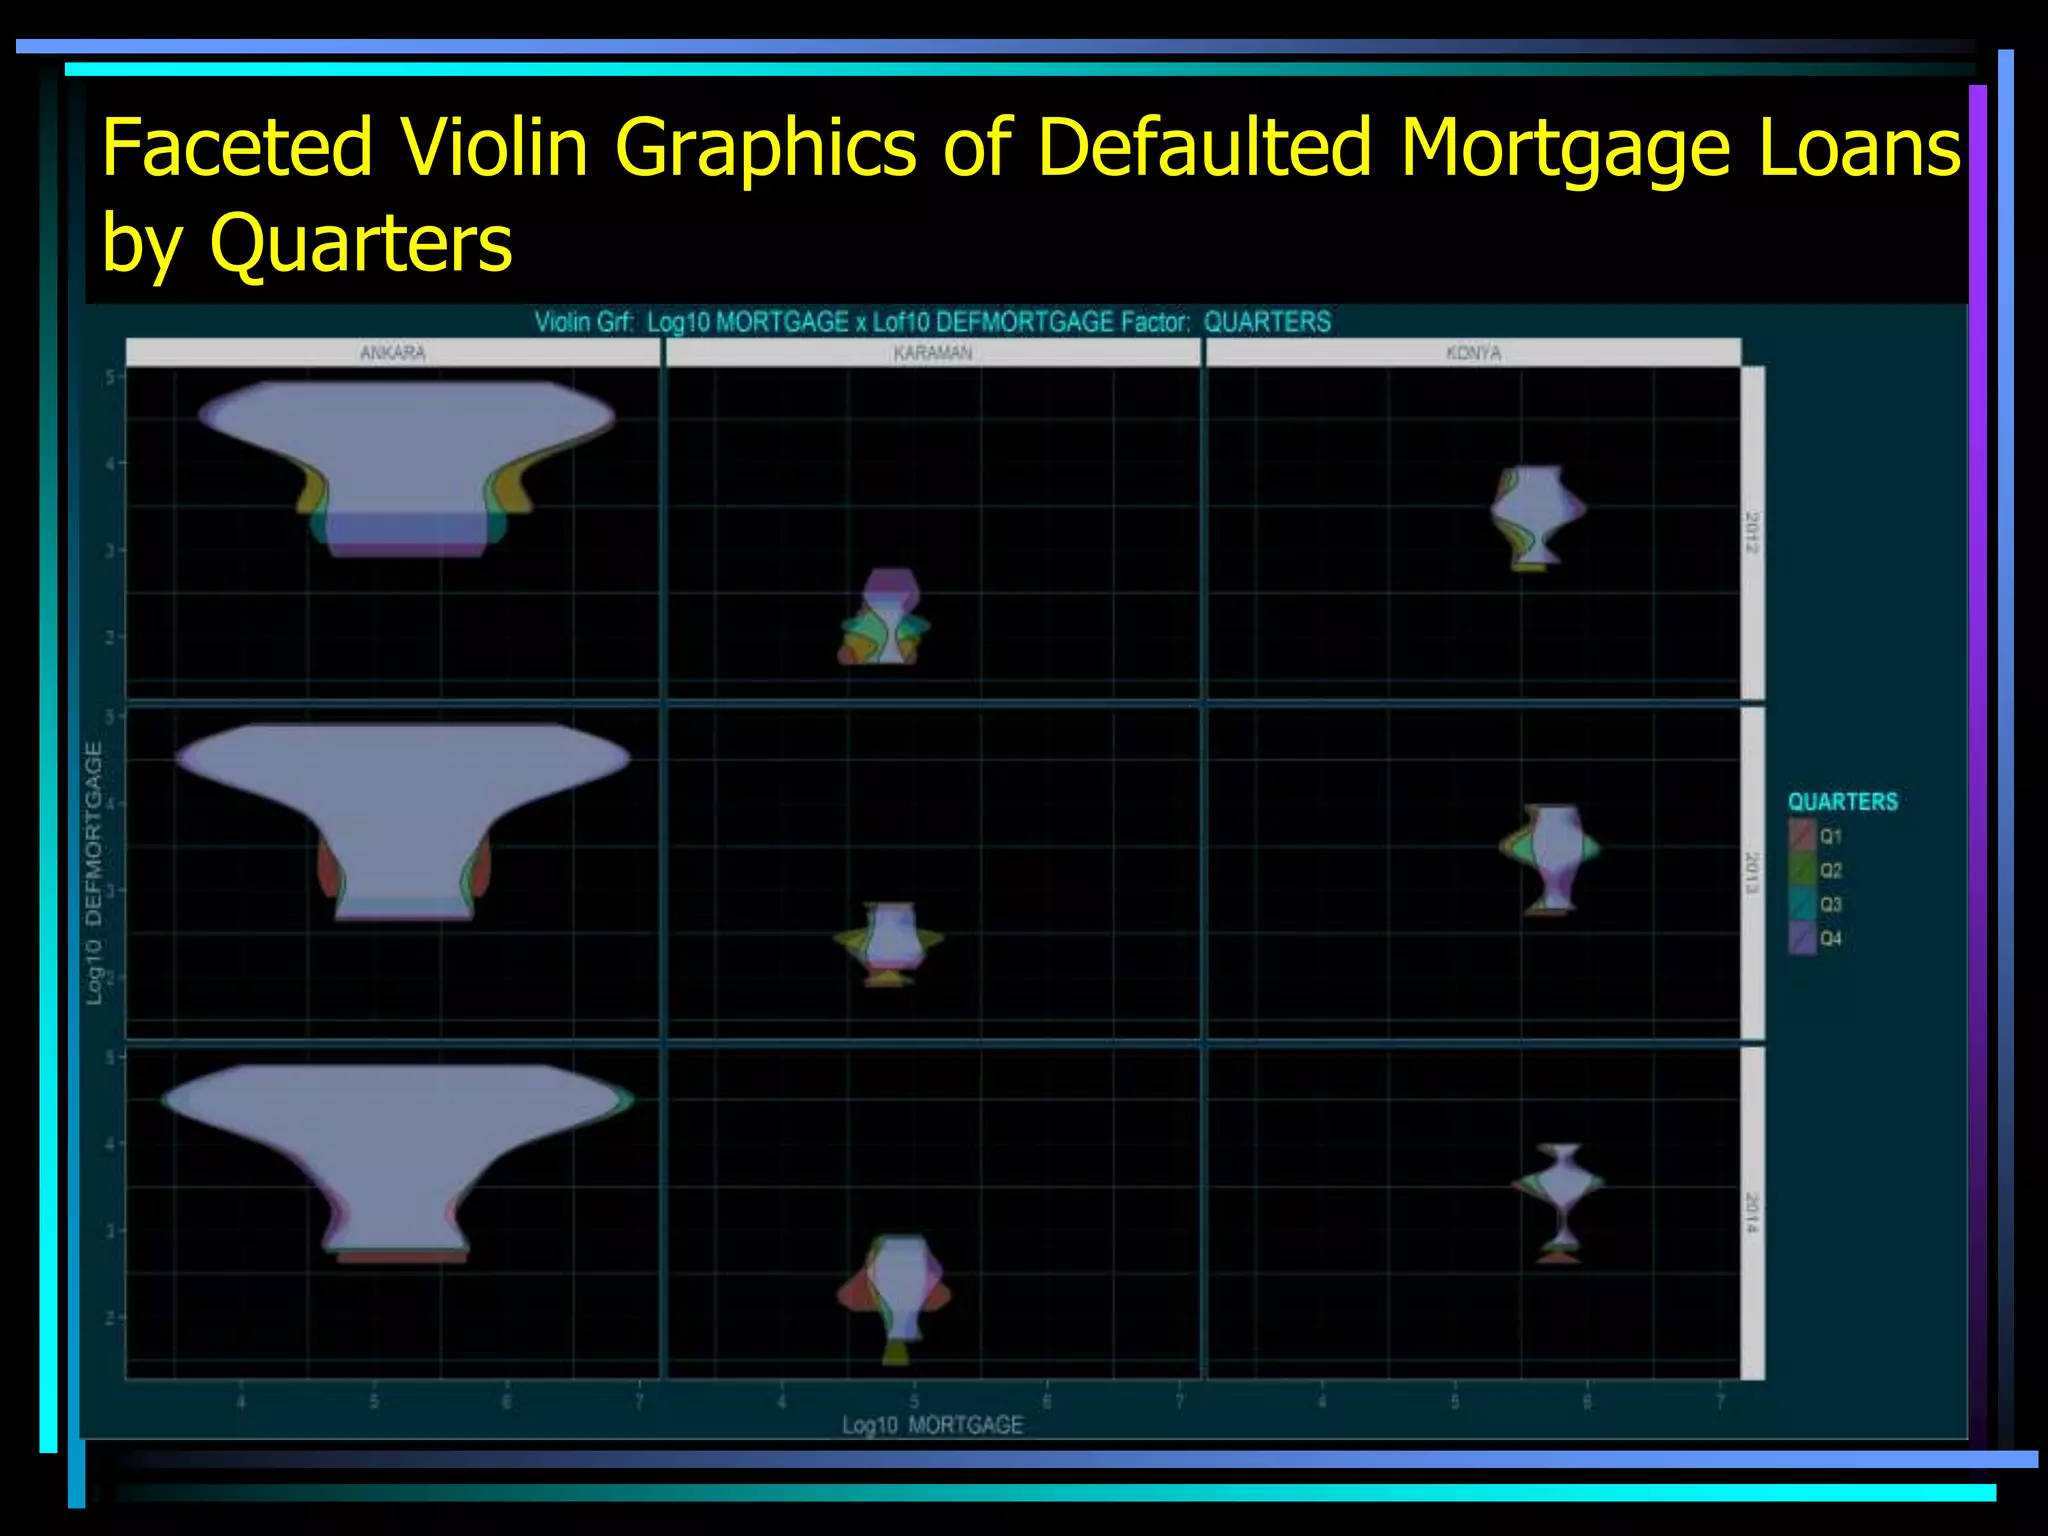
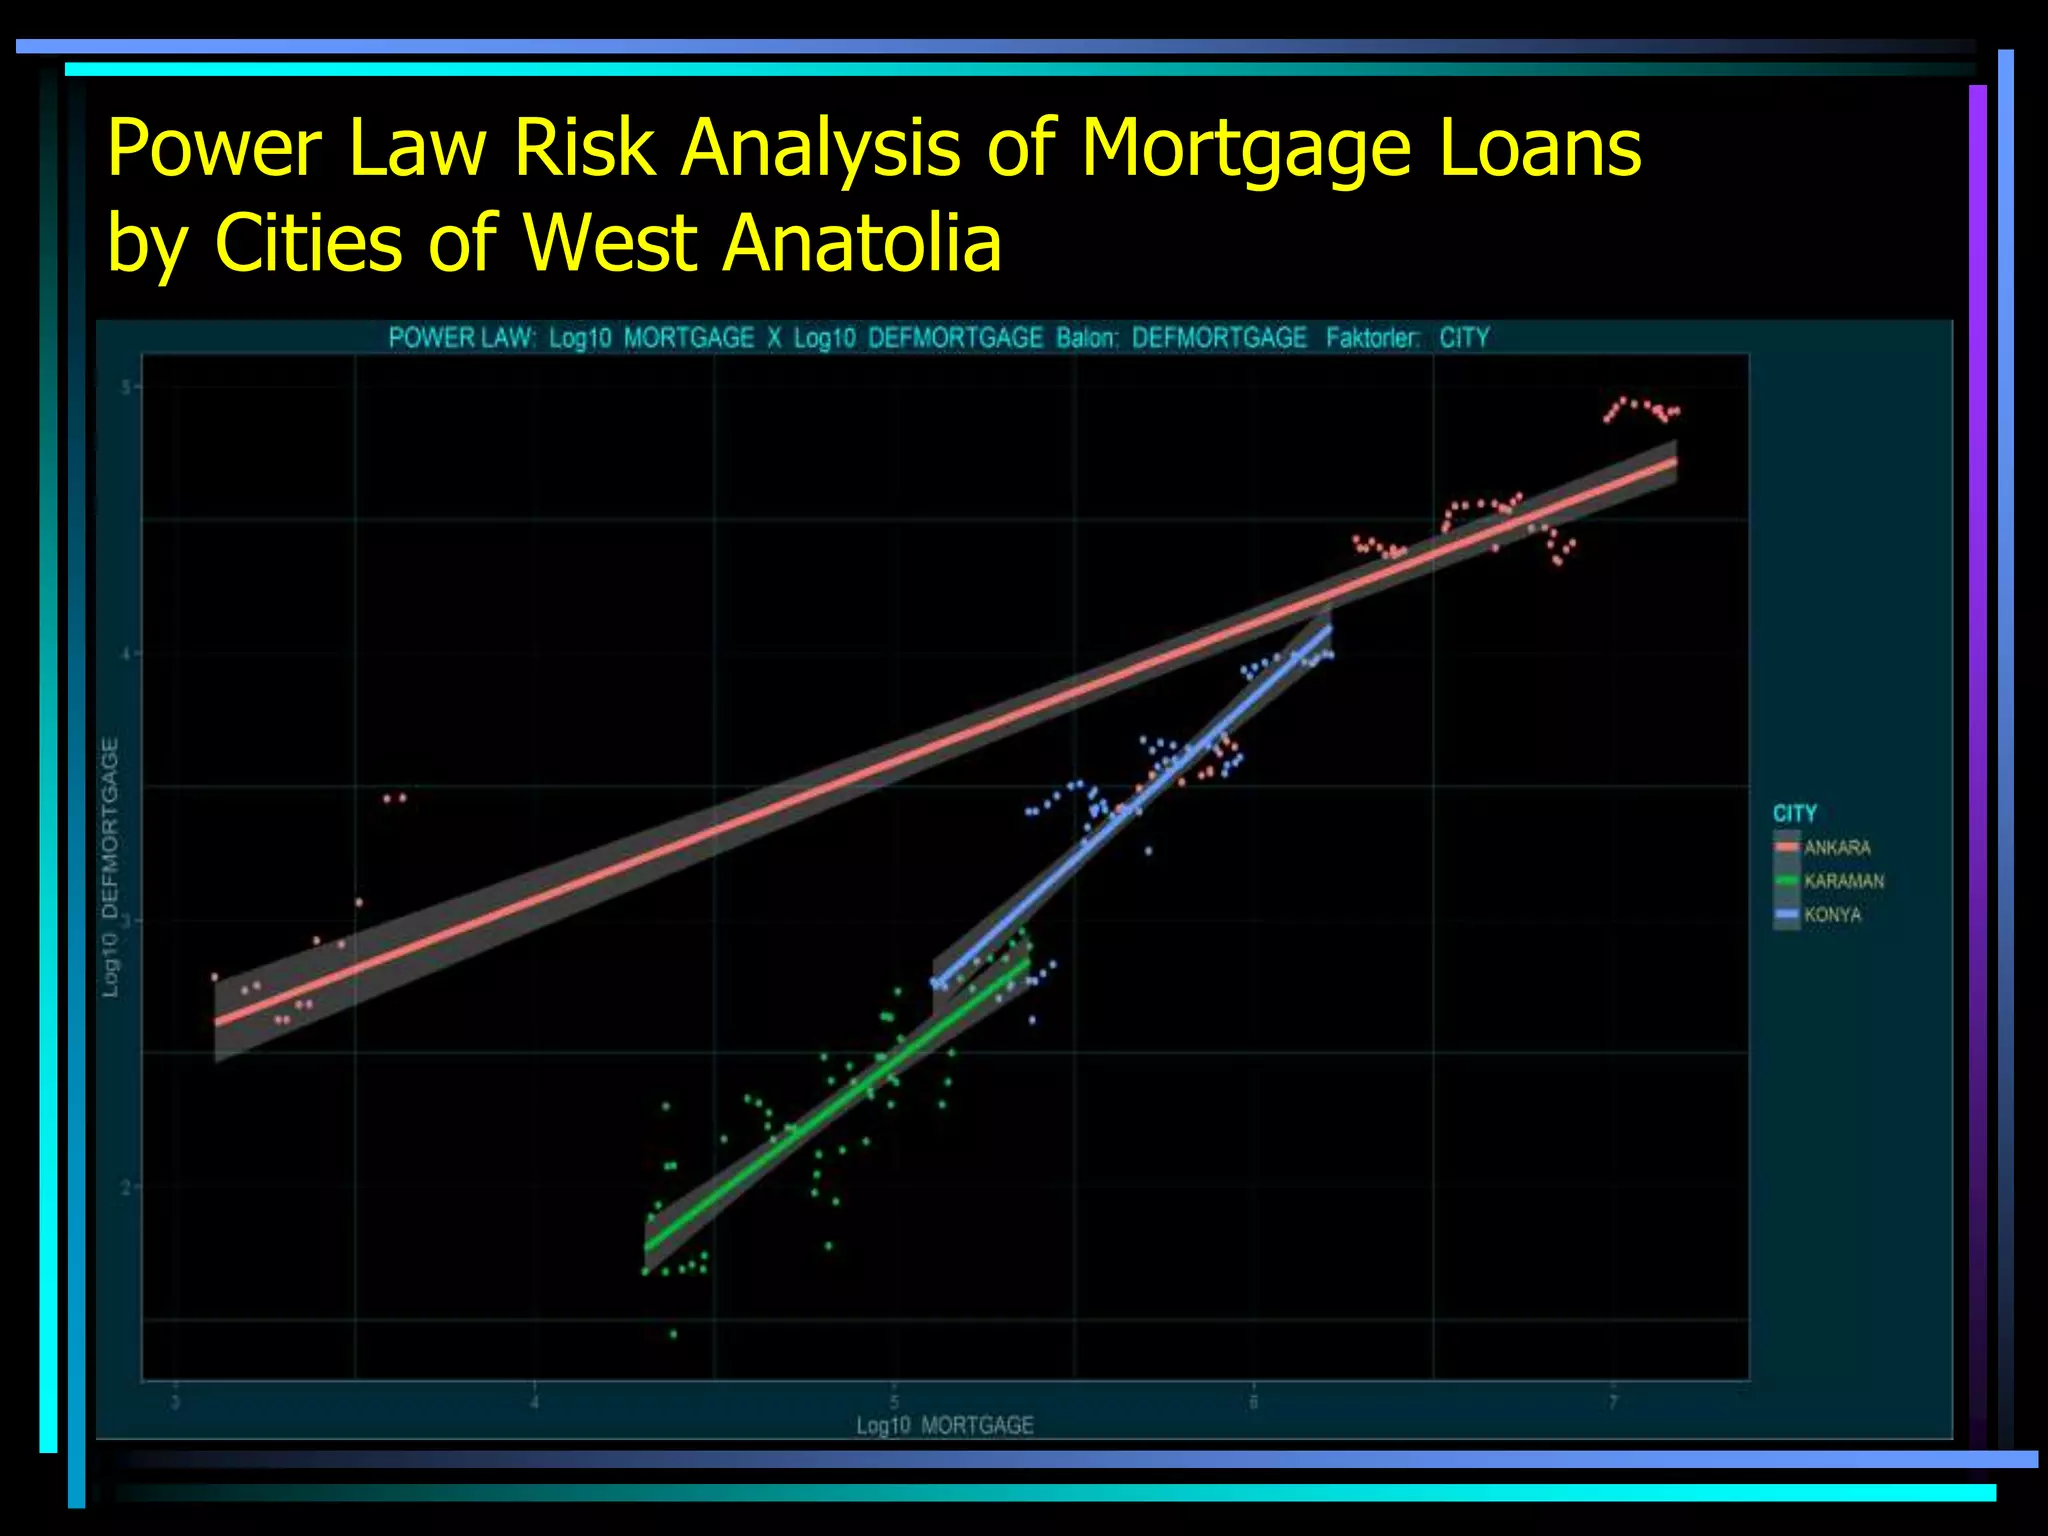
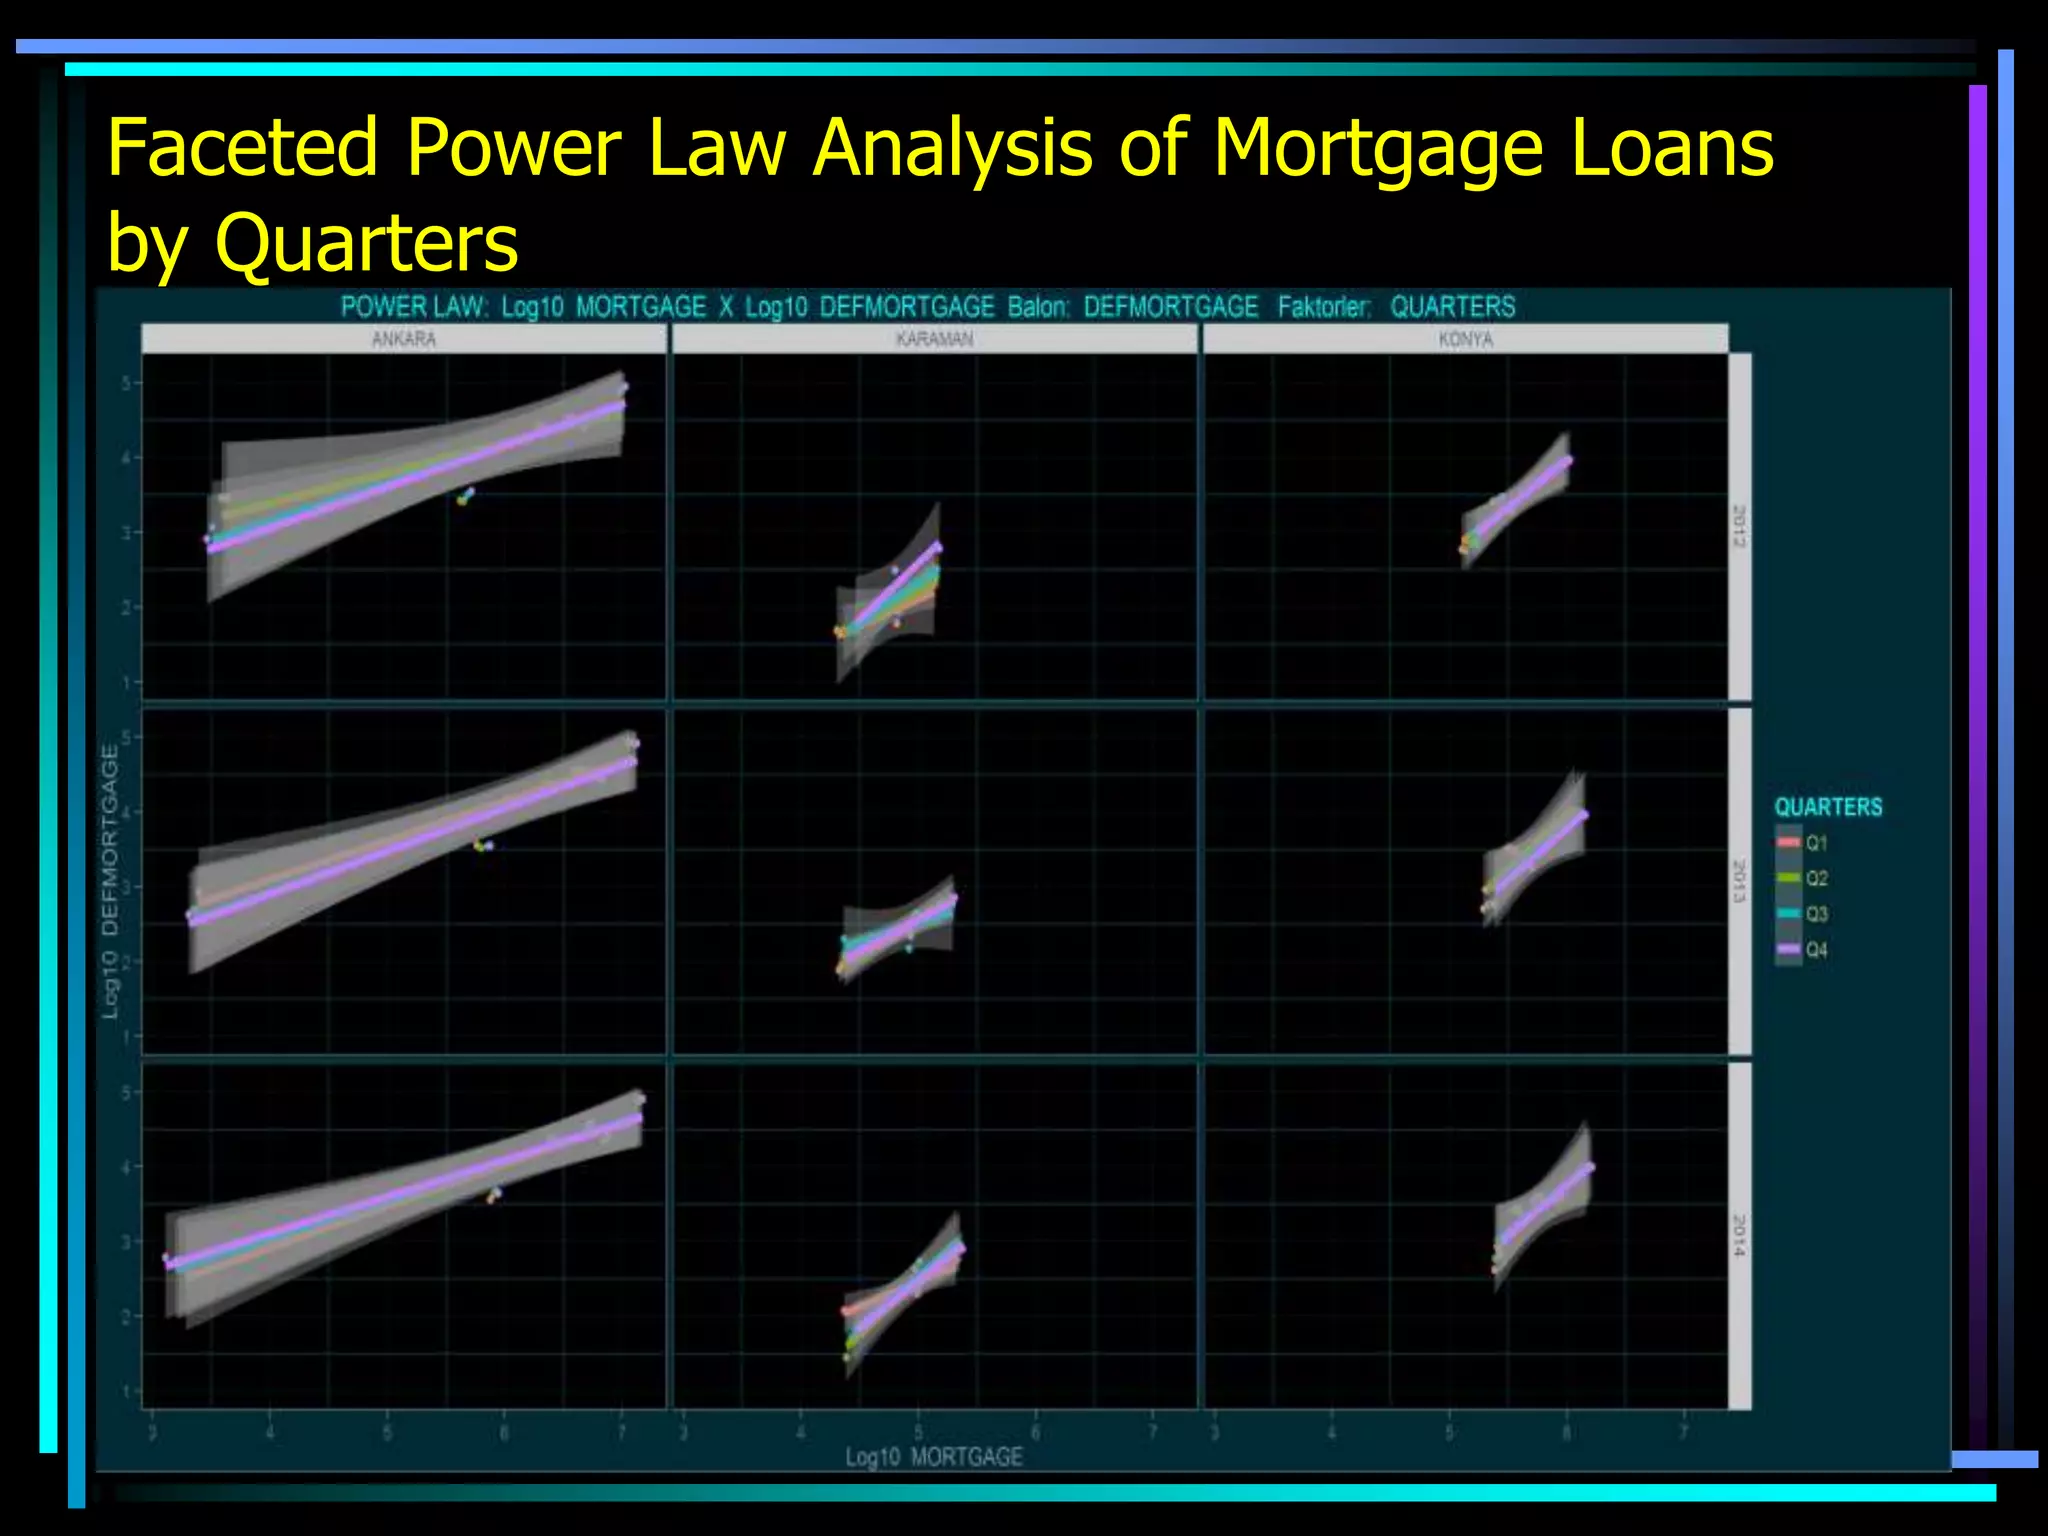
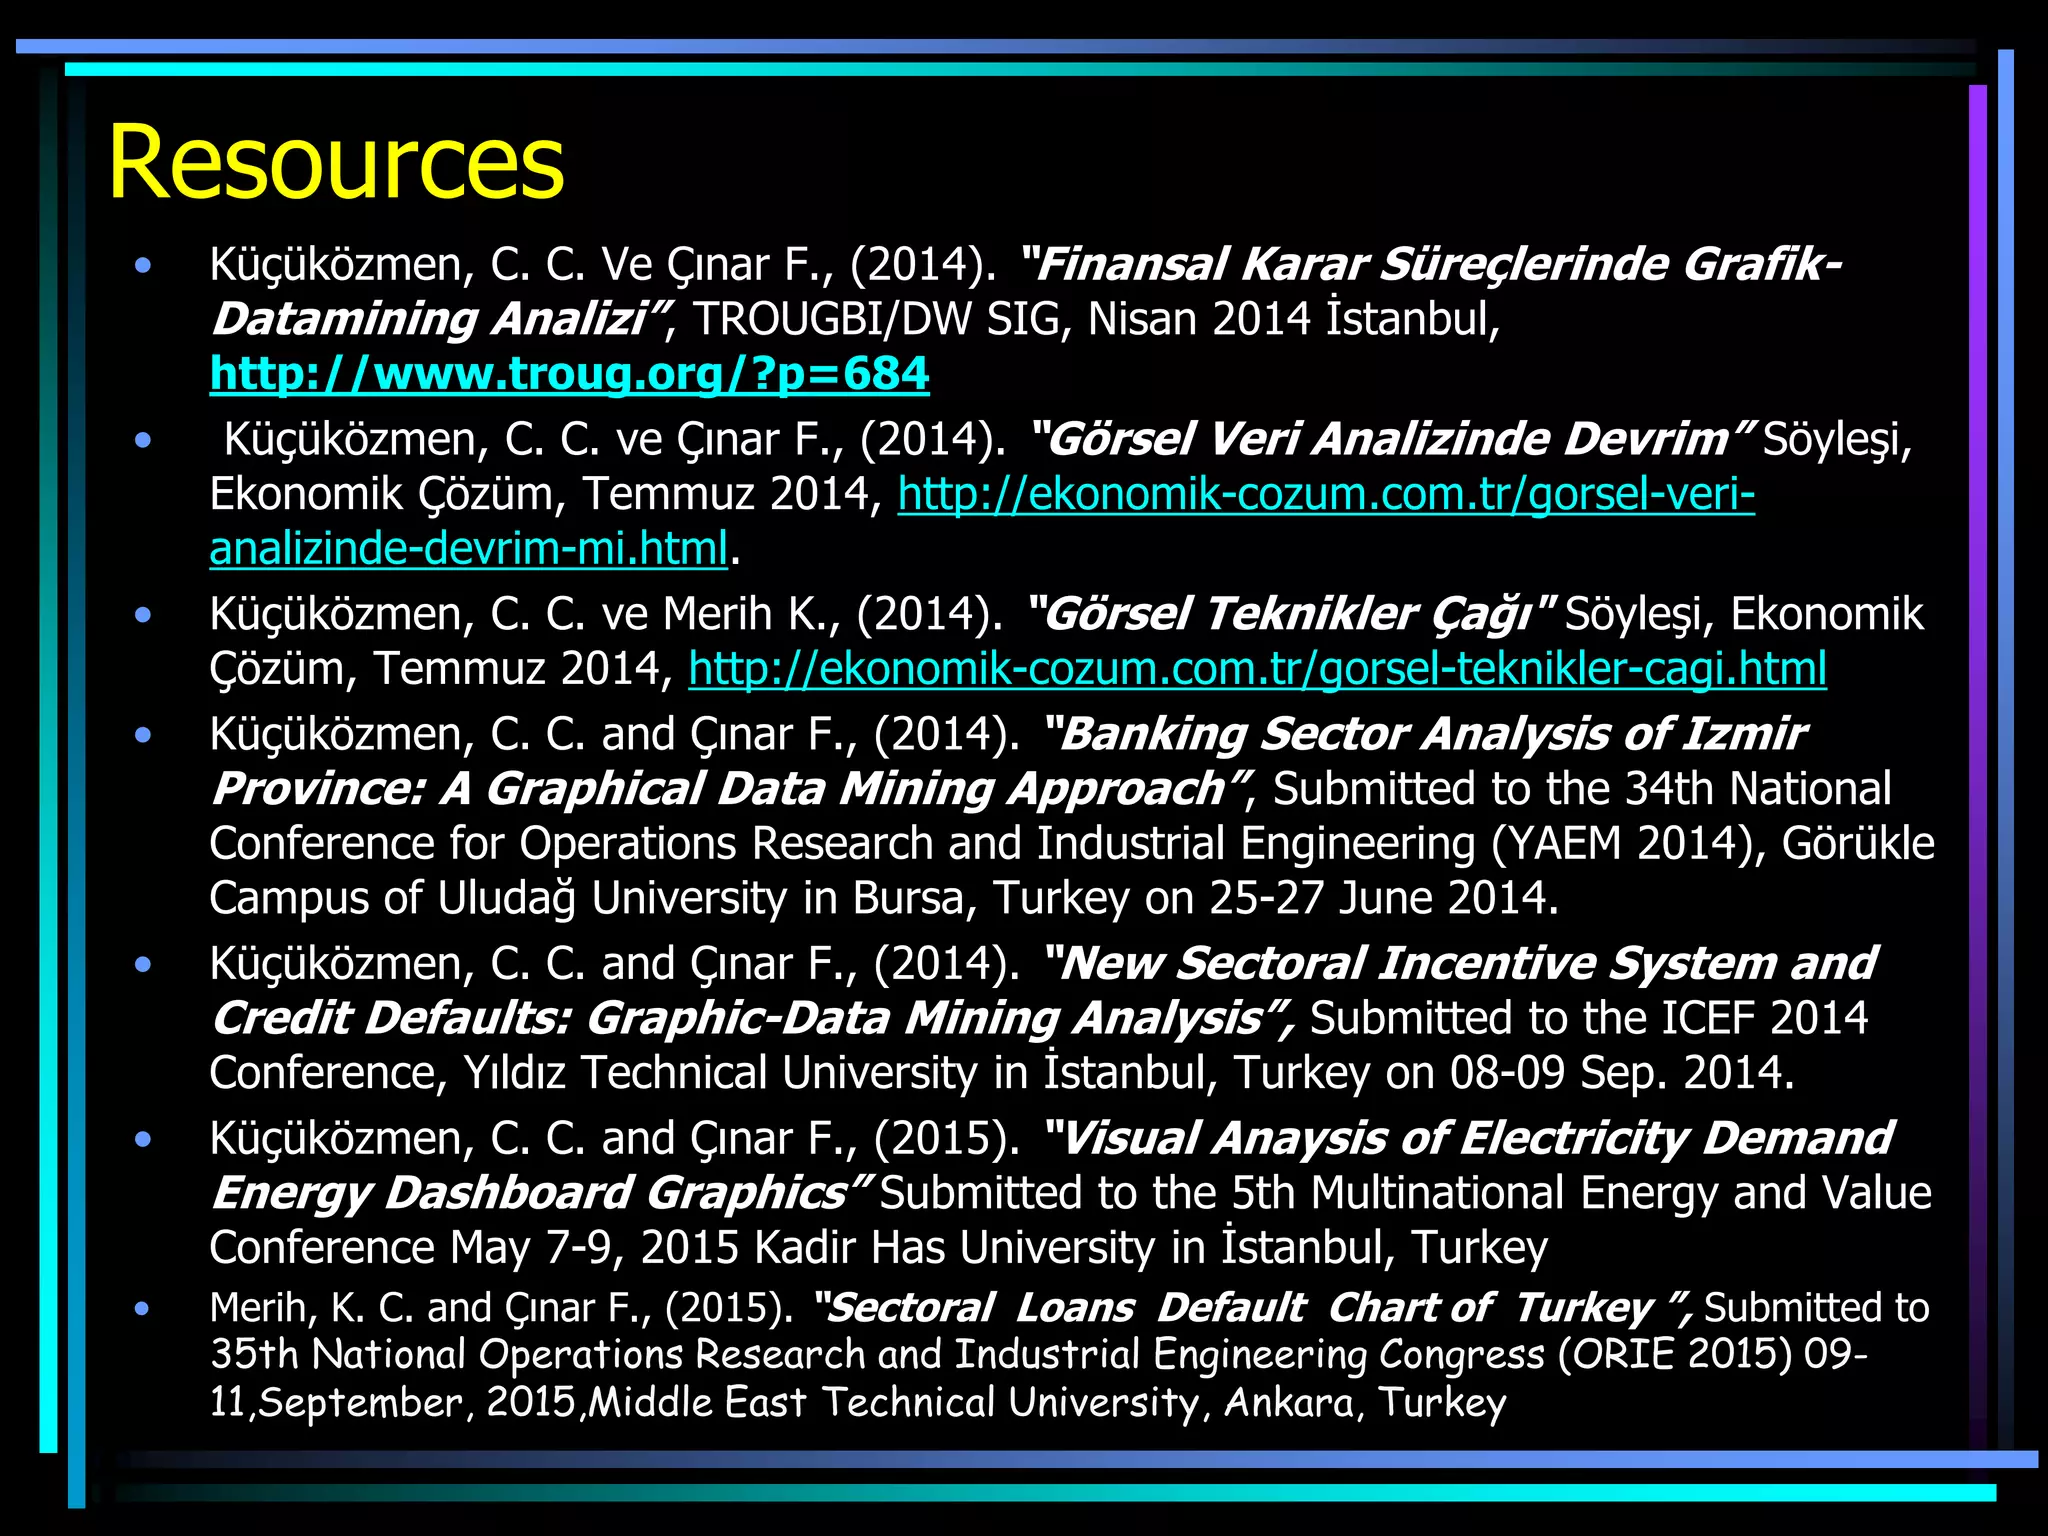

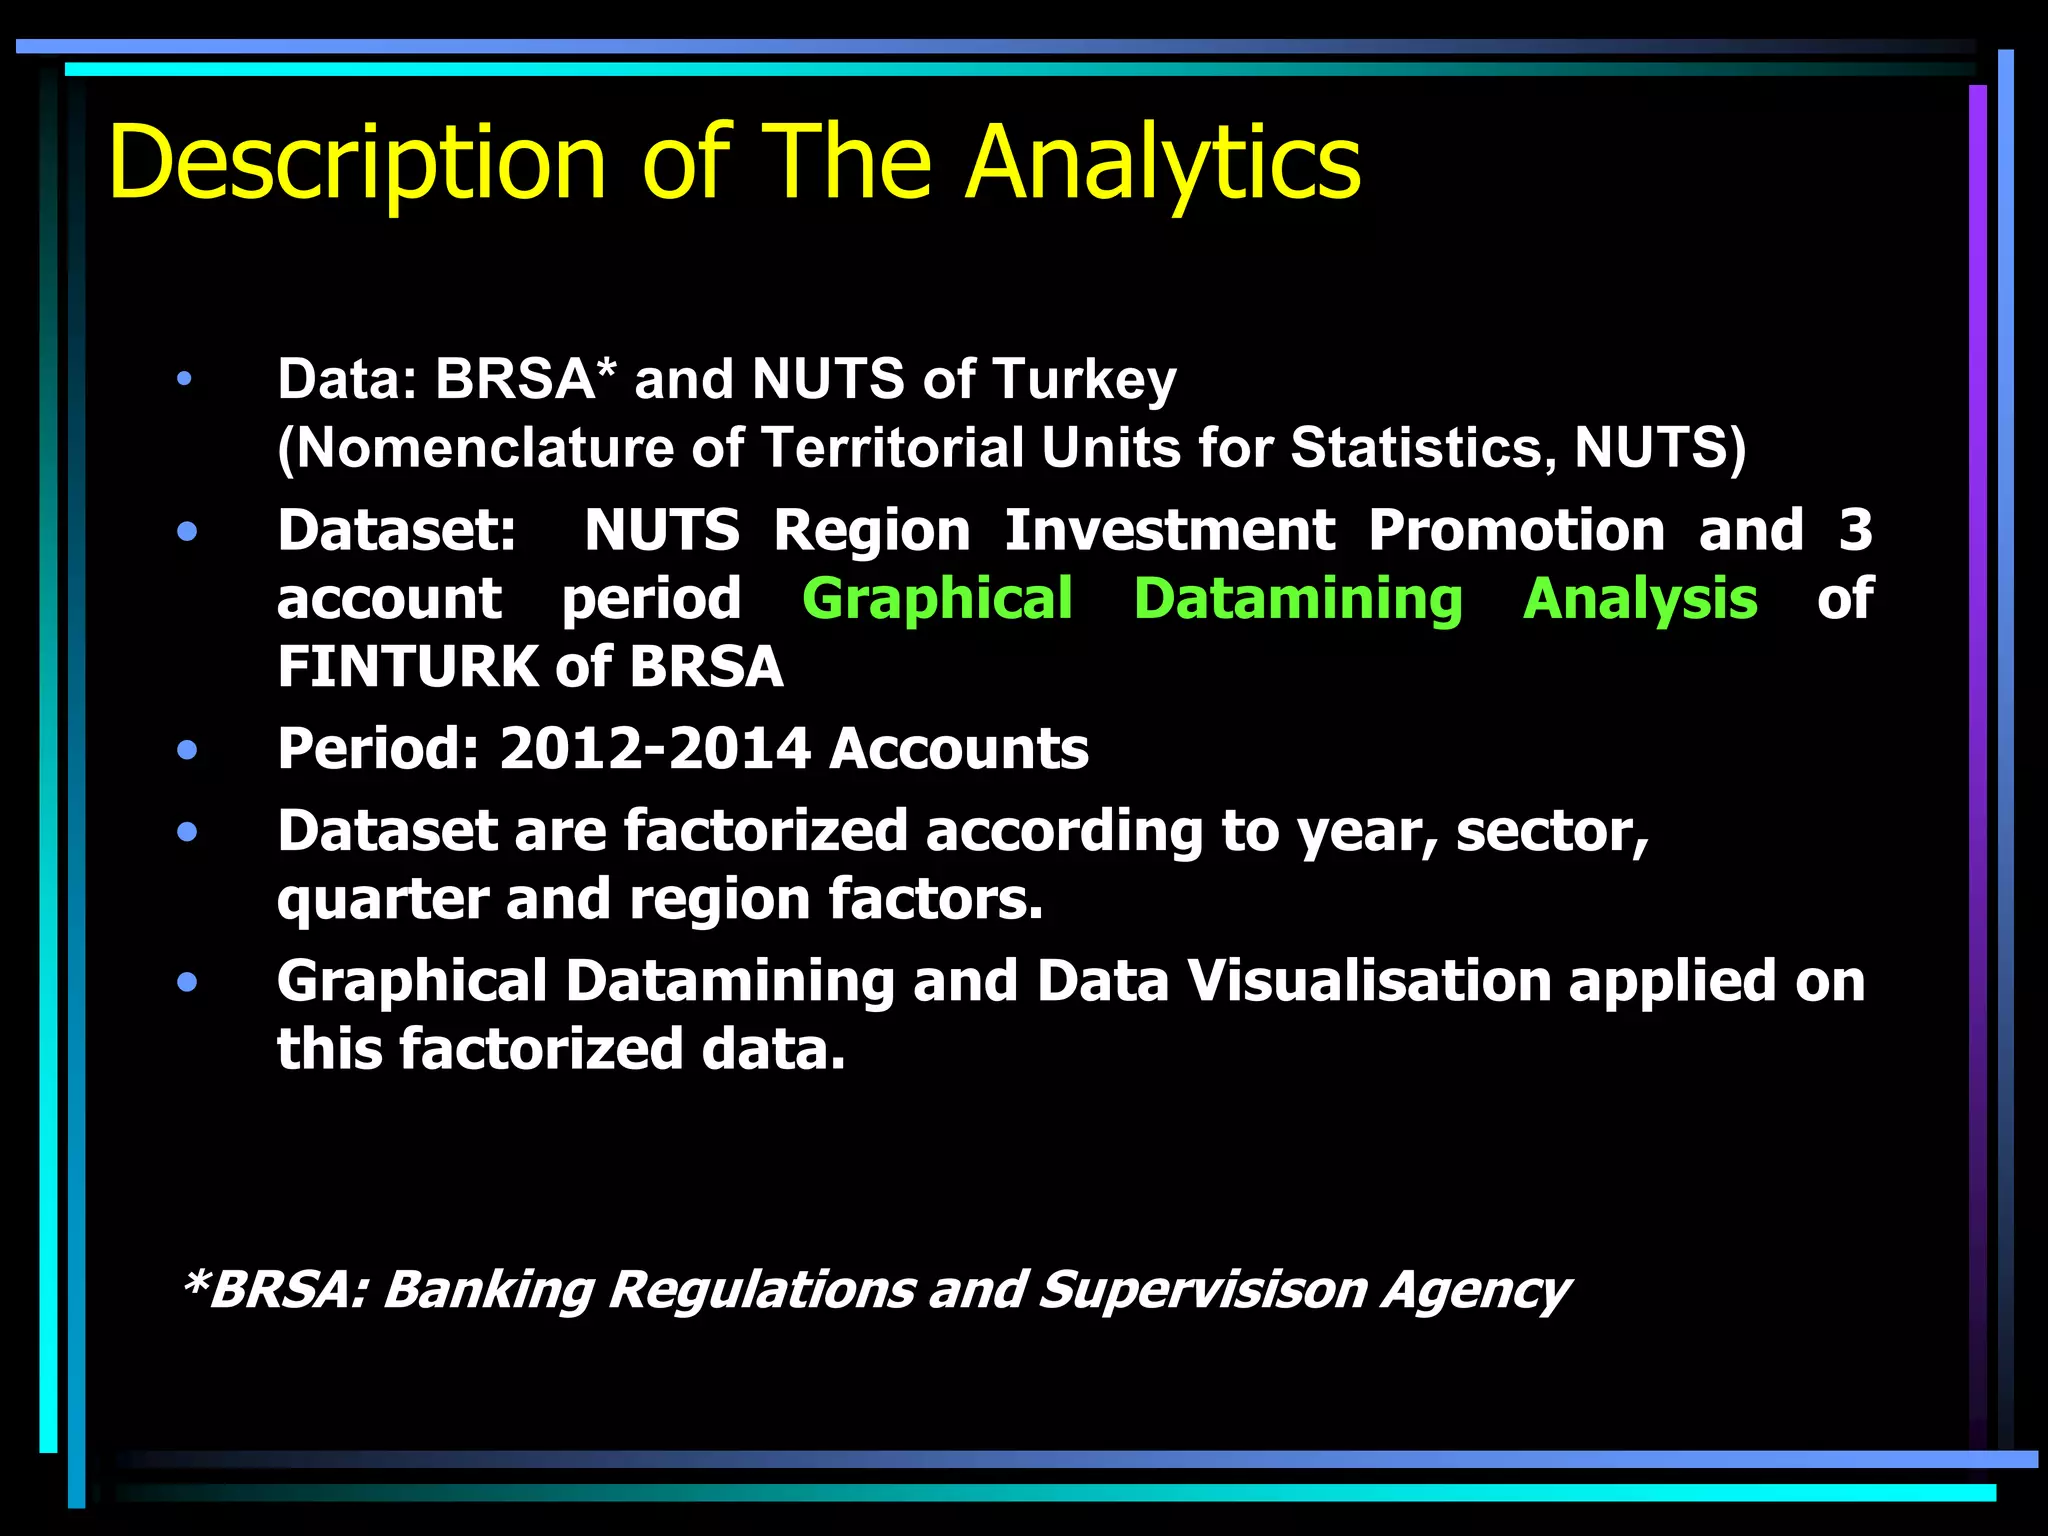
This document provides an abridged sample risk report analyzing defaulted mortgage loans in Turkey from 2012-2014. It uses graphical data mining techniques like density plots, violin plots, and facet plots in R to visualize loan default trends by region, city, sector, and time period. The report aims to identify financial anomalies and risk profiles according to geographic and temporal factors. It finds significant differences in risk profiles affected by these factors. Only summary information from the full report covering all Turkish regions from 2010-2015 is presented.


![[DSC Europe 25] Branko Urosevic -Rethinking Financial Talent: Integrating Cod...](https://cdn.slidesharecdn.com/ss_thumbnails/8jjrus8ttko6qj64f58f-3-251212103250-642c6374-thumbnail.jpg?width=640&height=640&fit=bounds)


![[DSC Europe 25] Dunja Adzic Jovanovic - AI and Cybersecurity: Defending Data ...](https://cdn.slidesharecdn.com/ss_thumbnails/o1zylpbhrtwnixxq2xj8-7-251211083048-185086f6-thumbnail.jpg?width=640&height=640&fit=bounds)


![[DSC Europe 25] Nikolay Burlutskiy - Best Practices for Building Enterprise M...](https://cdn.slidesharecdn.com/ss_thumbnails/uirvaiuvq8y1w8hzd9tx-7-251212103249-2619edb4-thumbnail.jpg?width=640&height=640&fit=bounds)

![[DSC Europe 25] Danica Soc - The Science Behind Marketing: Experimentation me...](https://cdn.slidesharecdn.com/ss_thumbnails/c0nofsggs9gw5ucmallr-3-251216103155-56bd64d1-thumbnail.jpg?width=640&height=640&fit=bounds)
![[DSC Europe 25] Tatevik Maytesyan - How to actually use AI in marketing: gett...](https://cdn.slidesharecdn.com/ss_thumbnails/tjo626lsqdgfntbgl2mw-4-251216103155-e36cd239-thumbnail.jpg?width=640&height=640&fit=bounds)

![[DSC Europe 25] Uros Pesic - The Reality of AI in Marketing.pdf](https://cdn.slidesharecdn.com/ss_thumbnails/rtkodnmtycovsllvzsyn-9-251215095918-b0c6bfe3-thumbnail.jpg?width=640&height=640&fit=bounds)
![[DSC Europe 25] Behzad Hosseini - AI Agents in the Wild: Deploying Models tha...](https://cdn.slidesharecdn.com/ss_thumbnails/3qtejajvsjqrzwfept2c-10-251212103250-7f2b1068-thumbnail.jpg?width=640&height=640&fit=bounds)
![[DSC Europe 25] Branko Dzakula - From Defense to Attack: How AI Redefines Cyb...](https://cdn.slidesharecdn.com/ss_thumbnails/80bdzdxpr3ky2g0qvyk9-8-251211083048-ce5fc1ee-thumbnail.jpg?width=640&height=640&fit=bounds)


