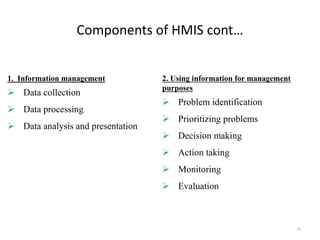
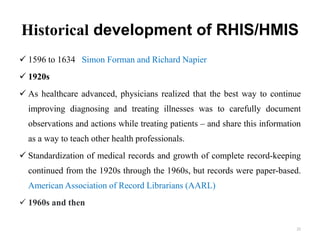
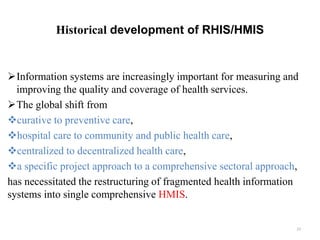
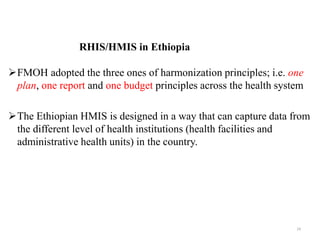
This document provides information about a Routine Health Information Systems course. It includes details about the course name, code, credit hours, target students, and instructor. The course contents cover 8 chapters on topics like health indicators, data sources, disease surveillance, and the District Health Information System (DHIS-2). The document also defines key terms, outlines the components and historical development of health information systems, and discusses the health management information system in Ethiopia.

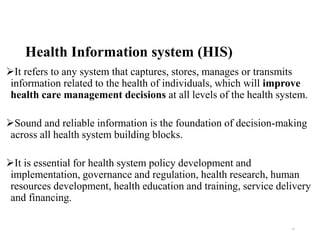


![PERI-PROSTHETIC FRACTURE NAIL-PLATE CONSTRUCT [NPC].pptx](https://cdn.slidesharecdn.com/ss_thumbnails/drarunkumardrmohamedashrafperiprostheticfrasturenail-plateconstructnpc-260209164459-7e9d15a1-thumbnail.jpg?width=640&height=640&fit=bounds)


![ONFH[AVN HIP] -TRIPLE REGIME -A NOVAL SURGICAL CONCEPT .pptx](https://cdn.slidesharecdn.com/ss_thumbnails/onfhavnhip2026koaconcalicutdrgokuldevdrmashraf-260210064517-213ec005-thumbnail.jpg?width=640&height=640&fit=bounds)


