SlideShare a Scribd company logo
1 of 6
Download to read offline
Hotstocked.com Company Research


Regenicin, inc. (RGIN)                                                                                                                                                                                                   Jan 31, 2011


Summary

Share Price Summary                                                              Overview                                                                           Percent Price Change                          RGIN            S&P 500
Close Price on Jan 31, 2011.................................... 0.70             Volume on Jan 31, 2011.................................... 129,050                 Year To Date............................... 16.67.................. -100
Off 52-Week Low................................................... 40%           Avg Vol (3m).................................................... 238,489           One Year........................................ N/A.................. N/A
Over 52-Week High........................................ -271.43%               Market Cap................................................... 51,720,000           Two Years...................................... N/A.................. N/A
52-Week low........................................................... 0.42      TTM Price/Earnings................................................ N/A             Three Years.................................... N/A.................. N/A
52-Week high.......................................................... 2.60      EPS (ttm)................................................................ -0.01    Five Years...................................... N/A.................. N/A


Contact Info

Address:                    10 HIGH COURT LITTLE FALLS NJ 07424 646-403-3581
Web Site:                   www.regenicin.com
Phone:                      973-557-8914
Fax:                        N/A


Table of Contents

Performance Rating...................................................... 2       General Sentiment........................................................ 5
Getting Acquainted....................................................... 3      Description................................................................... 6
Share Liquidity............................................................. 4


Disclaimer

This research report is provided for informational purposes only and on the condition that it will not form the sole basis for any investment decision. Reference to
any company is not a recommendation to buy or sell the shares of such company. The information used for, or presented in, this report has been obtained from
sources believed to be reliable, but Hotstocked makes no representation as to the accuracy or completeness of such information. This report in intended only for
users in the United States. Hotstocked has no obligation to update, modify or amend this report or to otherwise notify a reader thereof in the event that any matter
stated herein becomes inaccurate. Hotstocked and/or its affiliates/investors may hold securities positions in the companies discussed in this report and may
frequently trade in such positions. Such investments may be inconsistent with the quantitative analysis provided in this report.
©Hotstocked 2008. All rights reserved. This report may not be reproduced, modified, distributed or published without the prior written authorization of Hotstocked.
Regenicin, inc. (OTCBB: RGIN)                                                                                     Hotstocked.com Company Research

Performance Rating: Sell
Hotstocked.com Composite Rating                            Component Rating                                       12 month Price Target

Unattractive: Risk Factors greatly outweigh any
merits we have found while conducting our
research on this company. We expect this stock
to decline and our recommendation to investors is
                                                                                                                  12 Month Price Target:               $0.28
to sell any position that they have in this security.
                                                                                                                  Percentage Change:                   60% Loss


                                                                                   "Under" = Underperform

Technical Analysis Component: Sell

Technical analysis is the study and analysis of trading patterns generated by market activity. While Technical Analysis can be useful at making short term
predictions, it ignores fundamental factors that may impact an entities value long term.

While there appears to be a market for RGIN stock it is certainly a very thin one. A small investor making an average sized investment would have the ability to
move this stock. Sometimes in markets such as this one the transaction costs based on the difference between the bid and ask can erode potential gains. RGIN
share prices have been a strong downtrend while selling pressure seems to have slowed, there are no indicators suggesting this stock will go higher. RGIN stock
has just formed a dangerous chart pattern breaking through support levels that can push the stock down further from here.


                                           Very Negative              Negative                   Neutral                   Positive              Very Positive
Liquidity of Stock
Price Trend
Technical Breakout


Valuation Analysis: Sell

Valuation Analysis is a simple comparison of what the current market prices would represent to an acquirer of the company in relation to numerical aspects of their
business. This is useful at determining whether or not the stock is a good value. However stocks that are a good value often have negative operational trends and
good value on its own is not a convincing argument that a stock should be bought. Conversely stocks that are overvalued often have positive operational trends.

RGIN stock is currently priced at a standard market premium in relation to the sales the company generates it does not appear to be over or undervalued. RGIN
market value represents a higher than average premium to the assets in the company. They are a small company competing with larger competitors with greater
resources. Their ability to grow over the long term will be limited unless this situation is corrected.


                                           Very Negative              Negative                   Neutral                   Positive              Very Positive
Price to Sales
Price to Book
Industry Strength


Fundamental Analysis: Strong Sell

This section is an analysis of this company's balance sheet in relation to their spending patterns and immediate and longer term needs

This company appears unable to meet bills that are either past due or will come due over the next 90 days. They are facing an immediate liquidity crisis. Which
can have a substantial adverse impact on share value. They are completely inadequately financed to execute any business plan. And in dire need of additional
funding. Given their weak position, this funding will most likely have a substantially adverse impact on existing shareholders. They are in an industry that is
extremely unpopular with investors right now, obtaining investment money will be quite difficult and it may come on extremely unfavorable terms.


                                           Very Negative              Negative                   Neutral                   Positive              Very Positive
Current Cash Needs
Long Term Cash Needs
Industry Climate for funding


Operational Analysis: Strong Sell

This is an analysis of their business activities over the last 12 months and how this can impact the company and it's share price over the next year

Sales are substantially and rapidly declining. This company is losing money and the losses are getting bigger. They have negative margins meaning they are
selling their goods for a lower cost than that to produce them. This is not factoring in their fixed overhead. This can have an extreme negative impact on their
business and share price.


                                           Very Negative              Negative                   Neutral                   Positive              Very Positive
Sales
Earnings
Margins
Jan 31, 2011                                                                                                                                                 Page 2
Regenicin, inc. (OTCBB: RGIN)                                                                                     Hotstocked.com Company Research


Getting Acquainted
Business Summary

Regenicin, Inc. is a biotechnology company specializing in the development of and commercialization of regenerative cell therapies to
restore the health of damaged tissues and organs.

Financial Trends

in Thousands of Dollars


Fiscal Year Ending                                         09/2008                          09/2009                         09/2010                             TTM
Operating Revenue                                              N/A                              N/A                             N/A                              N/A
Cost of Revenue                                                N/A                              N/A                              251                              251
Gross Operating Profit                                         N/A                              N/A                              251                              251
EBITDA                                                          -44                              -11                            -428                             -428
Total Net Income                                                -44                              -11                            -935                             -935
Diluted EPS from Total Operations                              N/A                              N/A                            -0.01                            -0.01


Key Ratios


Fiscal Year Ending                                         09/2008                          09/2009                         09/2010                             TTM
% Sales Growth                                                 N/A                              N/A                             N/A                              N/A
% EPS Growth                                                   N/A                              N/A                             N/A                                 0
% Gross Margin                                                 N/A                              N/A                             N/A                              N/A
% Return on Assets                                             N/A                              N/A                               0                               8.3
% Return on Equity                                             N/A                              N/A                         -1568.8                              11.4


Peer Comparison

They are a small company competing with larger competitors with greater resources. Their ability to grow over the long term will be limited unless this situation is
corrected.


Jan 31, 2011                                                                                                                                                  Page 3
Regenicin, inc. (OTCBB: RGIN)                                                                                     Hotstocked.com Company Research


Share Liquidity
RGIN stock is illiquid. A small amount of buying or selling can impact the price. Stocks that are this inactive are often the subject of market manipulation
strategies.

1 Year Price Chart


10 Year Price Chart                                                                   5 Year Price Chart


6 Month Price Chart                                                                   1 Month Price Chart


Jan 31, 2011                                                                                                                                                   Page 4
Regenicin, inc. (OTCBB: RGIN)                                                                                  Hotstocked.com Company Research


General Sentiment
RGIN stock has just formed a dangerous chart pattern breaking through support levels that can push the stock down further from here.

52 Week Price History


Price History


Calendar Year                            2001         2002         2003        2004         2005        2006         2007         2008        2009           2010
High Price                                N/A          N/A          N/A         N/A          N/A         N/A          N/A          N/A         N/A            N/A
Low Price                                 N/A          N/A          N/A         N/A          N/A         N/A          N/A          N/A         N/A            N/A
Year End Price                            N/A          N/A          N/A         N/A          N/A         N/A          N/A          N/A         N/A            N/A


Price Performance

RGIN share prices have been a strong downtrend while selling pressure seems to have slowed, there are no indicators suggesting this stock will go higher.


Time Period                                                  Actual Change                           Percent Change                                vs. S&P 500
4 Week - N/A                                                           N/A                                      N/A                                        N/A
13 Week - N/A                                                          N/A                                      N/A                                        N/A
26 Week - N/A                                                          N/A                                      N/A                                        N/A
52 Week - N/A                                                          N/A                                      N/A                                        N/A
Year To Date                                                            0.1                                   16.7%                                      16.7%
Charts


Jan 31, 2011                                                                                                                                                Page 5
Regenicin, inc. (OTCBB: RGIN)                                                                   Hotstocked.com Company Research


Description
Employee Warning! - You are seeing this warning here on the report because our research has determined that this company is probably
understaffed. There are currently only 7 working at this company. This is not sufficient to operate a successful public enterprise and can
hinder the company's development.
Low Priced Stock Warning - As of the last time we checked this stock was under $1.00 adding a high level of additional risk. We
recommend that only experienced investors even consider this stock, and to proceed with extreme caution.

Regenicin, Inc. is a biotechnology company specializing in the development of and commercialization
of regenerative cell therapies to restore the health of damaged tissues and organs. Regenicin, which was
founded in 2010, has assembled a world class team with a proven track record for developing and
bringing innovative medical devices and biotechnology products to market. Regenicin is playing a
critical role in developing an exciting breakthrough technology that uses the patient's own skin cells to
generate living, tissue-engineered skin for the treatment of chronic burns.


Jan 31, 2011                                                                                                                          Page 6

More Related Content

What's hot

Delivering Synergies : A closer look at post merger integration
Delivering Synergies : A closer look at post merger integrationDelivering Synergies : A closer look at post merger integration
Delivering Synergies : A closer look at post merger integrationSanjay Uppal
 
How to Value a Business
How to Value a BusinessHow to Value a Business
How to Value a Businessfitzgeralddon
 
Merger Negotiation
Merger NegotiationMerger Negotiation
Merger Negotiationnicemanin
 
Q317 bmch earnings presentation final
Q317 bmch earnings presentation finalQ317 bmch earnings presentation final
Q317 bmch earnings presentation finalbmcstockholdings
 
Price It Right with Dmitry Shesterin
Price It Right with Dmitry ShesterinPrice It Right with Dmitry Shesterin
Price It Right with Dmitry ShesterinDmitry Shesterin
 
Ford Motors SCQ Analysis
Ford Motors SCQ AnalysisFord Motors SCQ Analysis
Ford Motors SCQ Analysissunilngupta
 
Scotiabank. alicorp _02_jan2013_185807_ids_505
Scotiabank. alicorp _02_jan2013_185807_ids_505Scotiabank. alicorp _02_jan2013_185807_ids_505
Scotiabank. alicorp _02_jan2013_185807_ids_505gro77
 
Airline Volatility Cleared for Takeoff?
Airline Volatility Cleared for Takeoff?Airline Volatility Cleared for Takeoff?
Airline Volatility Cleared for Takeoff?RYAN RENICKER
 
Benchmarking
BenchmarkingBenchmarking
BenchmarkingDomball
 
Accenture hpb consumer_healthcare_po_v_6 june 2012 v3
Accenture hpb consumer_healthcare_po_v_6 june 2012 v3Accenture hpb consumer_healthcare_po_v_6 june 2012 v3
Accenture hpb consumer_healthcare_po_v_6 june 2012 v3claudy604
 
CFO and Art Of Mergers and Acquisitions
CFO and Art Of Mergers and AcquisitionsCFO and Art Of Mergers and Acquisitions
CFO and Art Of Mergers and AcquisitionsSanjay Uppal
 
2009 Pulse Of The Market
2009 Pulse Of The Market2009 Pulse Of The Market
2009 Pulse Of The MarketKbrown3709
 
Noble Group (Iceberg Report Part 2)
Noble Group (Iceberg Report Part 2)Noble Group (Iceberg Report Part 2)
Noble Group (Iceberg Report Part 2)asianextractor
 
Pricing and profitability management pros presentation
Pricing and profitability management   pros presentationPricing and profitability management   pros presentation
Pricing and profitability management pros presentationTheo Slaats
 
Management of Working Capital- Britannia Industries Ltd.
Management of Working Capital- Britannia Industries Ltd.Management of Working Capital- Britannia Industries Ltd.
Management of Working Capital- Britannia Industries Ltd.Nikita Jangid
 
NTN Recovery Scenario from COVID-19
NTN Recovery Scenario from COVID-19NTN Recovery Scenario from COVID-19
NTN Recovery Scenario from COVID-19TETSUYA SOGO
 

What's hot (20)

Delivering Synergies : A closer look at post merger integration
Delivering Synergies : A closer look at post merger integrationDelivering Synergies : A closer look at post merger integration
Delivering Synergies : A closer look at post merger integration
 
How to Value a Business
How to Value a BusinessHow to Value a Business
How to Value a Business
 
Merger Negotiation
Merger NegotiationMerger Negotiation
Merger Negotiation
 
Q317 bmch earnings presentation final
Q317 bmch earnings presentation finalQ317 bmch earnings presentation final
Q317 bmch earnings presentation final
 
Price It Right with Dmitry Shesterin
Price It Right with Dmitry ShesterinPrice It Right with Dmitry Shesterin
Price It Right with Dmitry Shesterin
 
Ford Motors SCQ Analysis
Ford Motors SCQ AnalysisFord Motors SCQ Analysis
Ford Motors SCQ Analysis
 
Pulse Of The Market
Pulse Of The MarketPulse Of The Market
Pulse Of The Market
 
Scotiabank. alicorp _02_jan2013_185807_ids_505
Scotiabank. alicorp _02_jan2013_185807_ids_505Scotiabank. alicorp _02_jan2013_185807_ids_505
Scotiabank. alicorp _02_jan2013_185807_ids_505
 
Airline Volatility Cleared for Takeoff?
Airline Volatility Cleared for Takeoff?Airline Volatility Cleared for Takeoff?
Airline Volatility Cleared for Takeoff?
 
Benchmarking
BenchmarkingBenchmarking
Benchmarking
 
Accenture hpb consumer_healthcare_po_v_6 june 2012 v3
Accenture hpb consumer_healthcare_po_v_6 june 2012 v3Accenture hpb consumer_healthcare_po_v_6 june 2012 v3
Accenture hpb consumer_healthcare_po_v_6 june 2012 v3
 
CFO and Art Of Mergers and Acquisitions
CFO and Art Of Mergers and AcquisitionsCFO and Art Of Mergers and Acquisitions
CFO and Art Of Mergers and Acquisitions
 
2009 Pulse Of The Market
2009 Pulse Of The Market2009 Pulse Of The Market
2009 Pulse Of The Market
 
Noble Group (Iceberg Report Part 2)
Noble Group (Iceberg Report Part 2)Noble Group (Iceberg Report Part 2)
Noble Group (Iceberg Report Part 2)
 
4A’s Transformation 2013 - March 10 - MPF - Deloitte - Scott Lippstreu
4A’s Transformation 2013 - March 10 - MPF - Deloitte - Scott Lippstreu4A’s Transformation 2013 - March 10 - MPF - Deloitte - Scott Lippstreu
4A’s Transformation 2013 - March 10 - MPF - Deloitte - Scott Lippstreu
 
working capital management
 working capital management working capital management
working capital management
 
Pricing and profitability management pros presentation
Pricing and profitability management   pros presentationPricing and profitability management   pros presentation
Pricing and profitability management pros presentation
 
Management of Working Capital- Britannia Industries Ltd.
Management of Working Capital- Britannia Industries Ltd.Management of Working Capital- Britannia Industries Ltd.
Management of Working Capital- Britannia Industries Ltd.
 
Topic 02
Topic 02Topic 02
Topic 02
 
NTN Recovery Scenario from COVID-19
NTN Recovery Scenario from COVID-19NTN Recovery Scenario from COVID-19
NTN Recovery Scenario from COVID-19
 

Similar to RGIN Stock Analysis Shows Strong Sell Rating

Investment/Technical Analyst
Investment/Technical AnalystInvestment/Technical Analyst
Investment/Technical AnalystFinancialBuzzGuru
 
Chapter 05(a) financial analysis-ratio and other analysis
Chapter 05(a) financial analysis-ratio and other analysisChapter 05(a) financial analysis-ratio and other analysis
Chapter 05(a) financial analysis-ratio and other analysisAl Sabbir
 
Growth through metrics and cash - Chris James
Growth through metrics and cash - Chris JamesGrowth through metrics and cash - Chris James
Growth through metrics and cash - Chris JamesB2B CFO
 
General Electric 14General ElectricFinanc.docx
General Electric          14General ElectricFinanc.docxGeneral Electric          14General ElectricFinanc.docx
General Electric 14General ElectricFinanc.docxbudbarber38650
 
Analysis Based on the above factual data collected and complied
 Analysis Based on the above factual data collected and complied Analysis Based on the above factual data collected and complied
Analysis Based on the above factual data collected and compliedMargaritoWhitt221
 
Part 1Halliburton company beta 1.6, Helix energy solutions beta .docx
Part 1Halliburton company beta 1.6, Helix energy solutions beta .docxPart 1Halliburton company beta 1.6, Helix energy solutions beta .docx
Part 1Halliburton company beta 1.6, Helix energy solutions beta .docxsmile790243
 
Jefferies industrials conf. aug 11 small
Jefferies industrials conf. aug 11 smallJefferies industrials conf. aug 11 small
Jefferies industrials conf. aug 11 smalldynamicmaterials
 
Dynamic Materials Investor Presentation
Dynamic Materials Investor PresentationDynamic Materials Investor Presentation
Dynamic Materials Investor PresentationCompany Spotlight
 
Boom March 2011 IR Presentation
Boom March 2011 IR PresentationBoom March 2011 IR Presentation
Boom March 2011 IR Presentationdynamicmaterials
 
Boom may '11 ir presentation
Boom may '11 ir presentationBoom may '11 ir presentation
Boom may '11 ir presentationdynamicmaterials
 
ConAgra%20Foods%20Q1%20FY09%20Q&A
ConAgra%20Foods%20Q1%20FY09%20Q&AConAgra%20Foods%20Q1%20FY09%20Q&A
ConAgra%20Foods%20Q1%20FY09%20Q&Afinance21
 
Sustainable Growth Rate | Finance
Sustainable Growth Rate | FinanceSustainable Growth Rate | Finance
Sustainable Growth Rate | FinanceTransweb Global Inc
 
Financial Accounting
Financial AccountingFinancial Accounting
Financial AccountingNavin Bafna
 
Jp morgan -_032113_presentation_-_final
Jp morgan -_032113_presentation_-_finalJp morgan -_032113_presentation_-_final
Jp morgan -_032113_presentation_-_finalCNOServices
 
Baird September 2012 Facility Services Report
Baird September 2012 Facility Services ReportBaird September 2012 Facility Services Report
Baird September 2012 Facility Services ReportDavid Crace
 
Dynamic matjan13presentation
Dynamic matjan13presentationDynamic matjan13presentation
Dynamic matjan13presentationCompany Spotlight
 
Long-term Corporate Finance Project on GlaxoSmithKline Inc.
Long-term Corporate Finance Project on GlaxoSmithKline Inc.Long-term Corporate Finance Project on GlaxoSmithKline Inc.
Long-term Corporate Finance Project on GlaxoSmithKline Inc.nroopraj24
 

Similar to RGIN Stock Analysis Shows Strong Sell Rating (20)

Investment/Technical Analyst
Investment/Technical AnalystInvestment/Technical Analyst
Investment/Technical Analyst
 
Chapter 05(a) financial analysis-ratio and other analysis
Chapter 05(a) financial analysis-ratio and other analysisChapter 05(a) financial analysis-ratio and other analysis
Chapter 05(a) financial analysis-ratio and other analysis
 
Growth through metrics and cash - Chris James
Growth through metrics and cash - Chris JamesGrowth through metrics and cash - Chris James
Growth through metrics and cash - Chris James
 
General Electric 14General ElectricFinanc.docx
General Electric          14General ElectricFinanc.docxGeneral Electric          14General ElectricFinanc.docx
General Electric 14General ElectricFinanc.docx
 
Analysis Based on the above factual data collected and complied
 Analysis Based on the above factual data collected and complied Analysis Based on the above factual data collected and complied
Analysis Based on the above factual data collected and complied
 
Part 1Halliburton company beta 1.6, Helix energy solutions beta .docx
Part 1Halliburton company beta 1.6, Helix energy solutions beta .docxPart 1Halliburton company beta 1.6, Helix energy solutions beta .docx
Part 1Halliburton company beta 1.6, Helix energy solutions beta .docx
 
Investorpresentation2010
Investorpresentation2010Investorpresentation2010
Investorpresentation2010
 
Jefferies industrials conf. aug 11 small
Jefferies industrials conf. aug 11 smallJefferies industrials conf. aug 11 small
Jefferies industrials conf. aug 11 small
 
DIAS PRESENTATION.pptx
DIAS PRESENTATION.pptxDIAS PRESENTATION.pptx
DIAS PRESENTATION.pptx
 
Dynamic Materials Investor Presentation
Dynamic Materials Investor PresentationDynamic Materials Investor Presentation
Dynamic Materials Investor Presentation
 
Boom March 2011 IR Presentation
Boom March 2011 IR PresentationBoom March 2011 IR Presentation
Boom March 2011 IR Presentation
 
Boom may '11 ir presentation
Boom may '11 ir presentationBoom may '11 ir presentation
Boom may '11 ir presentation
 
ConAgra%20Foods%20Q1%20FY09%20Q&A
ConAgra%20Foods%20Q1%20FY09%20Q&AConAgra%20Foods%20Q1%20FY09%20Q&A
ConAgra%20Foods%20Q1%20FY09%20Q&A
 
Sustainable Growth Rate | Finance
Sustainable Growth Rate | FinanceSustainable Growth Rate | Finance
Sustainable Growth Rate | Finance
 
Financial Accounting
Financial AccountingFinancial Accounting
Financial Accounting
 
Jp morgan -_032113_presentation_-_final
Jp morgan -_032113_presentation_-_finalJp morgan -_032113_presentation_-_final
Jp morgan -_032113_presentation_-_final
 
Baird September 2012 Facility Services Report
Baird September 2012 Facility Services ReportBaird September 2012 Facility Services Report
Baird September 2012 Facility Services Report
 
Boom 3 12 final small
Boom 3 12 final smallBoom 3 12 final small
Boom 3 12 final small
 
Dynamic matjan13presentation
Dynamic matjan13presentationDynamic matjan13presentation
Dynamic matjan13presentation
 
Long-term Corporate Finance Project on GlaxoSmithKline Inc.
Long-term Corporate Finance Project on GlaxoSmithKline Inc.Long-term Corporate Finance Project on GlaxoSmithKline Inc.
Long-term Corporate Finance Project on GlaxoSmithKline Inc.
 

RGIN Stock Analysis Shows Strong Sell Rating

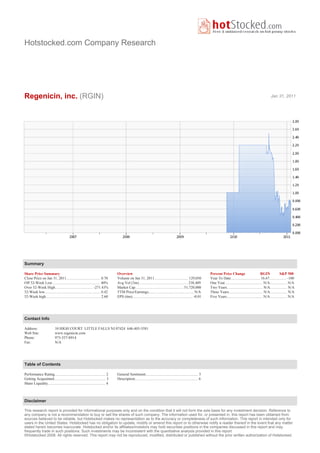
  • 1. Hotstocked.com Company Research Regenicin, inc. (RGIN) Jan 31, 2011 Summary Share Price Summary Overview Percent Price Change RGIN S&P 500 Close Price on Jan 31, 2011.................................... 0.70 Volume on Jan 31, 2011.................................... 129,050 Year To Date............................... 16.67.................. -100 Off 52-Week Low................................................... 40% Avg Vol (3m).................................................... 238,489 One Year........................................ N/A.................. N/A Over 52-Week High........................................ -271.43% Market Cap................................................... 51,720,000 Two Years...................................... N/A.................. N/A 52-Week low........................................................... 0.42 TTM Price/Earnings................................................ N/A Three Years.................................... N/A.................. N/A 52-Week high.......................................................... 2.60 EPS (ttm)................................................................ -0.01 Five Years...................................... N/A.................. N/A Contact Info Address: 10 HIGH COURT LITTLE FALLS NJ 07424 646-403-3581 Web Site: www.regenicin.com Phone: 973-557-8914 Fax: N/A Table of Contents Performance Rating...................................................... 2 General Sentiment........................................................ 5 Getting Acquainted....................................................... 3 Description................................................................... 6 Share Liquidity............................................................. 4 Disclaimer This research report is provided for informational purposes only and on the condition that it will not form the sole basis for any investment decision. Reference to any company is not a recommendation to buy or sell the shares of such company. The information used for, or presented in, this report has been obtained from sources believed to be reliable, but Hotstocked makes no representation as to the accuracy or completeness of such information. This report in intended only for users in the United States. Hotstocked has no obligation to update, modify or amend this report or to otherwise notify a reader thereof in the event that any matter stated herein becomes inaccurate. Hotstocked and/or its affiliates/investors may hold securities positions in the companies discussed in this report and may frequently trade in such positions. Such investments may be inconsistent with the quantitative analysis provided in this report. ©Hotstocked 2008. All rights reserved. This report may not be reproduced, modified, distributed or published without the prior written authorization of Hotstocked.
  • 2. Regenicin, inc. (OTCBB: RGIN) Hotstocked.com Company Research Performance Rating: Sell Hotstocked.com Composite Rating Component Rating 12 month Price Target Unattractive: Risk Factors greatly outweigh any merits we have found while conducting our research on this company. We expect this stock to decline and our recommendation to investors is 12 Month Price Target: $0.28 to sell any position that they have in this security. Percentage Change: 60% Loss "Under" = Underperform Technical Analysis Component: Sell Technical analysis is the study and analysis of trading patterns generated by market activity. While Technical Analysis can be useful at making short term predictions, it ignores fundamental factors that may impact an entities value long term. While there appears to be a market for RGIN stock it is certainly a very thin one. A small investor making an average sized investment would have the ability to move this stock. Sometimes in markets such as this one the transaction costs based on the difference between the bid and ask can erode potential gains. RGIN share prices have been a strong downtrend while selling pressure seems to have slowed, there are no indicators suggesting this stock will go higher. RGIN stock has just formed a dangerous chart pattern breaking through support levels that can push the stock down further from here. Very Negative Negative Neutral Positive Very Positive Liquidity of Stock Price Trend Technical Breakout Valuation Analysis: Sell Valuation Analysis is a simple comparison of what the current market prices would represent to an acquirer of the company in relation to numerical aspects of their business. This is useful at determining whether or not the stock is a good value. However stocks that are a good value often have negative operational trends and good value on its own is not a convincing argument that a stock should be bought. Conversely stocks that are overvalued often have positive operational trends. RGIN stock is currently priced at a standard market premium in relation to the sales the company generates it does not appear to be over or undervalued. RGIN market value represents a higher than average premium to the assets in the company. They are a small company competing with larger competitors with greater resources. Their ability to grow over the long term will be limited unless this situation is corrected. Very Negative Negative Neutral Positive Very Positive Price to Sales Price to Book Industry Strength Fundamental Analysis: Strong Sell This section is an analysis of this company's balance sheet in relation to their spending patterns and immediate and longer term needs This company appears unable to meet bills that are either past due or will come due over the next 90 days. They are facing an immediate liquidity crisis. Which can have a substantial adverse impact on share value. They are completely inadequately financed to execute any business plan. And in dire need of additional funding. Given their weak position, this funding will most likely have a substantially adverse impact on existing shareholders. They are in an industry that is extremely unpopular with investors right now, obtaining investment money will be quite difficult and it may come on extremely unfavorable terms. Very Negative Negative Neutral Positive Very Positive Current Cash Needs Long Term Cash Needs Industry Climate for funding Operational Analysis: Strong Sell This is an analysis of their business activities over the last 12 months and how this can impact the company and it's share price over the next year Sales are substantially and rapidly declining. This company is losing money and the losses are getting bigger. They have negative margins meaning they are selling their goods for a lower cost than that to produce them. This is not factoring in their fixed overhead. This can have an extreme negative impact on their business and share price. Very Negative Negative Neutral Positive Very Positive Sales Earnings Margins Jan 31, 2011 Page 2
  • 3. Regenicin, inc. (OTCBB: RGIN) Hotstocked.com Company Research Getting Acquainted Business Summary Regenicin, Inc. is a biotechnology company specializing in the development of and commercialization of regenerative cell therapies to restore the health of damaged tissues and organs. Financial Trends in Thousands of Dollars Fiscal Year Ending 09/2008 09/2009 09/2010 TTM Operating Revenue N/A N/A N/A N/A Cost of Revenue N/A N/A 251 251 Gross Operating Profit N/A N/A 251 251 EBITDA -44 -11 -428 -428 Total Net Income -44 -11 -935 -935 Diluted EPS from Total Operations N/A N/A -0.01 -0.01 Key Ratios Fiscal Year Ending 09/2008 09/2009 09/2010 TTM % Sales Growth N/A N/A N/A N/A % EPS Growth N/A N/A N/A 0 % Gross Margin N/A N/A N/A N/A % Return on Assets N/A N/A 0 8.3 % Return on Equity N/A N/A -1568.8 11.4 Peer Comparison They are a small company competing with larger competitors with greater resources. Their ability to grow over the long term will be limited unless this situation is corrected. Jan 31, 2011 Page 3
  • 4. Regenicin, inc. (OTCBB: RGIN) Hotstocked.com Company Research Share Liquidity RGIN stock is illiquid. A small amount of buying or selling can impact the price. Stocks that are this inactive are often the subject of market manipulation strategies. 1 Year Price Chart 10 Year Price Chart 5 Year Price Chart 6 Month Price Chart 1 Month Price Chart Jan 31, 2011 Page 4
  • 5. Regenicin, inc. (OTCBB: RGIN) Hotstocked.com Company Research General Sentiment RGIN stock has just formed a dangerous chart pattern breaking through support levels that can push the stock down further from here. 52 Week Price History Price History Calendar Year 2001 2002 2003 2004 2005 2006 2007 2008 2009 2010 High Price N/A N/A N/A N/A N/A N/A N/A N/A N/A N/A Low Price N/A N/A N/A N/A N/A N/A N/A N/A N/A N/A Year End Price N/A N/A N/A N/A N/A N/A N/A N/A N/A N/A Price Performance RGIN share prices have been a strong downtrend while selling pressure seems to have slowed, there are no indicators suggesting this stock will go higher. Time Period Actual Change Percent Change vs. S&P 500 4 Week - N/A N/A N/A N/A 13 Week - N/A N/A N/A N/A 26 Week - N/A N/A N/A N/A 52 Week - N/A N/A N/A N/A Year To Date 0.1 16.7% 16.7% Charts Jan 31, 2011 Page 5
  • 6. Regenicin, inc. (OTCBB: RGIN) Hotstocked.com Company Research Description Employee Warning! - You are seeing this warning here on the report because our research has determined that this company is probably understaffed. There are currently only 7 working at this company. This is not sufficient to operate a successful public enterprise and can hinder the company's development. Low Priced Stock Warning - As of the last time we checked this stock was under $1.00 adding a high level of additional risk. We recommend that only experienced investors even consider this stock, and to proceed with extreme caution. Regenicin, Inc. is a biotechnology company specializing in the development of and commercialization of regenerative cell therapies to restore the health of damaged tissues and organs. Regenicin, which was founded in 2010, has assembled a world class team with a proven track record for developing and bringing innovative medical devices and biotechnology products to market. Regenicin is playing a critical role in developing an exciting breakthrough technology that uses the patient's own skin cells to generate living, tissue-engineered skin for the treatment of chronic burns. Jan 31, 2011 Page 6