Reversal Levels Outlook for Week of April 15, 2024
•
0 likes•213 views

Free weekly newsletter with outlook and brief comments for world stock markets. Weekly reversal levels for stocks, gold, crypto currencies and forex. Try our method, which was designed to keep us on the right side of the market most of the time, letting the winners run while keeping losses small.

Recommended
Recommended
More Related Content
More from LunaticTrader
More from LunaticTrader (17)
Recently uploaded
Recently uploaded (20)
Reversal Levels Outlook for Week of April 15, 2024
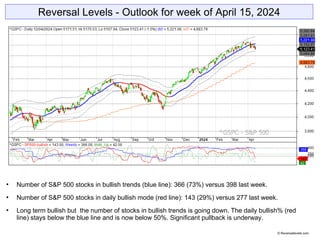
- 1. Reversal Levels - Outlook for week of April 15, 2024 Number of S&P 500 stocks in bullish trends (blue line): 366 (73%) versus 398 last week. Number of S&P 500 stocks in daily bullish mode (red line): 143 (29%) versus 277 last week. Long term bullish but the number of stocks in bullish trends is going down. The daily bullish% (red line) stays below the blue line and is now below 50%. Significant pullback is underway. © Reversallevels.com
- 2. ELC: up | BMO: down | Blue snake: up | Repellor: up Market dropped below the middle of the weekly Snake for the first time this year. Increasingly bearish picture. © Reversallevels.com S&P 500 Weekly chart
- 3. SwX turns yellow - neutral. Weekly MoM goes down from a very high +8 peak. Rally may have peaked, as we pointed out in recent weeks already. © Reversallevels.com S&P 500 - Weekly
- 4. SwX stays green - bullish. Weekly MoM goes up and enters the +8 peak zone. Gold stays strong as expected and the rally could go much higher. © Reversallevels.com Gold - Weekly
- 5. SwX is green - bullish. Weekly MoM is at the maximum +10. Stays near its recent record levels. © Reversallevels.com Bitcoin - Weekly
- 6. Partial profits signal for Italy MIB and Netherlands AEX. World markets © Reversallevels.com
- 7. Sell signal for AUDUSD and GBPUSD Partial profits signal for USDTRY. Note for daytraders or swing traders: if you do your trading in the direction of the weekly trend you are likely to do well in the long run. So, try to buy the pullbacks in currencies pairs that are in bullish trends and sell the rallies during bearish trends. Forex & Crypto © Reversallevels.com
- 8. Twitter: https://twitter.com/lunatictrader1 Stocktwits: https://stocktwits.com/LunaticTrader Blog 1: Reversallevels.com Blog 2: LunaticTrader.com Follow us on social media: © Reversallevels.com Disclaimer Investing in stocks, forex or commodities is risky. No guarantee can be given that the opinions or predictions given in this presentation will be correct. Reversallevels.com cannot in any way be responsible for eventual losses you may incur if you trade based on the given information. Simulated trading programs in general are designed with the benefit of hindsight. No representation is being made that any account will or is likely to achieve profits or losses similar to those shown. Trade at your own risk and responsibility. Join our subscription service Buy and sell signals for over 3000 stocks, indexes, forex, crypto and ETFs. Access to our unique strategies for short term trading and longer term investing. Example trades to demonstrate the various strategies in real time. Daily "market read" with charts and comments for the S&P 500, based on our unique proprietary indicators. This is an honest and realistic method with limited risk, not a get rich quick formula. Sign up here: 1 Month ($22) 6 Months ($110) 1 Year ($199)