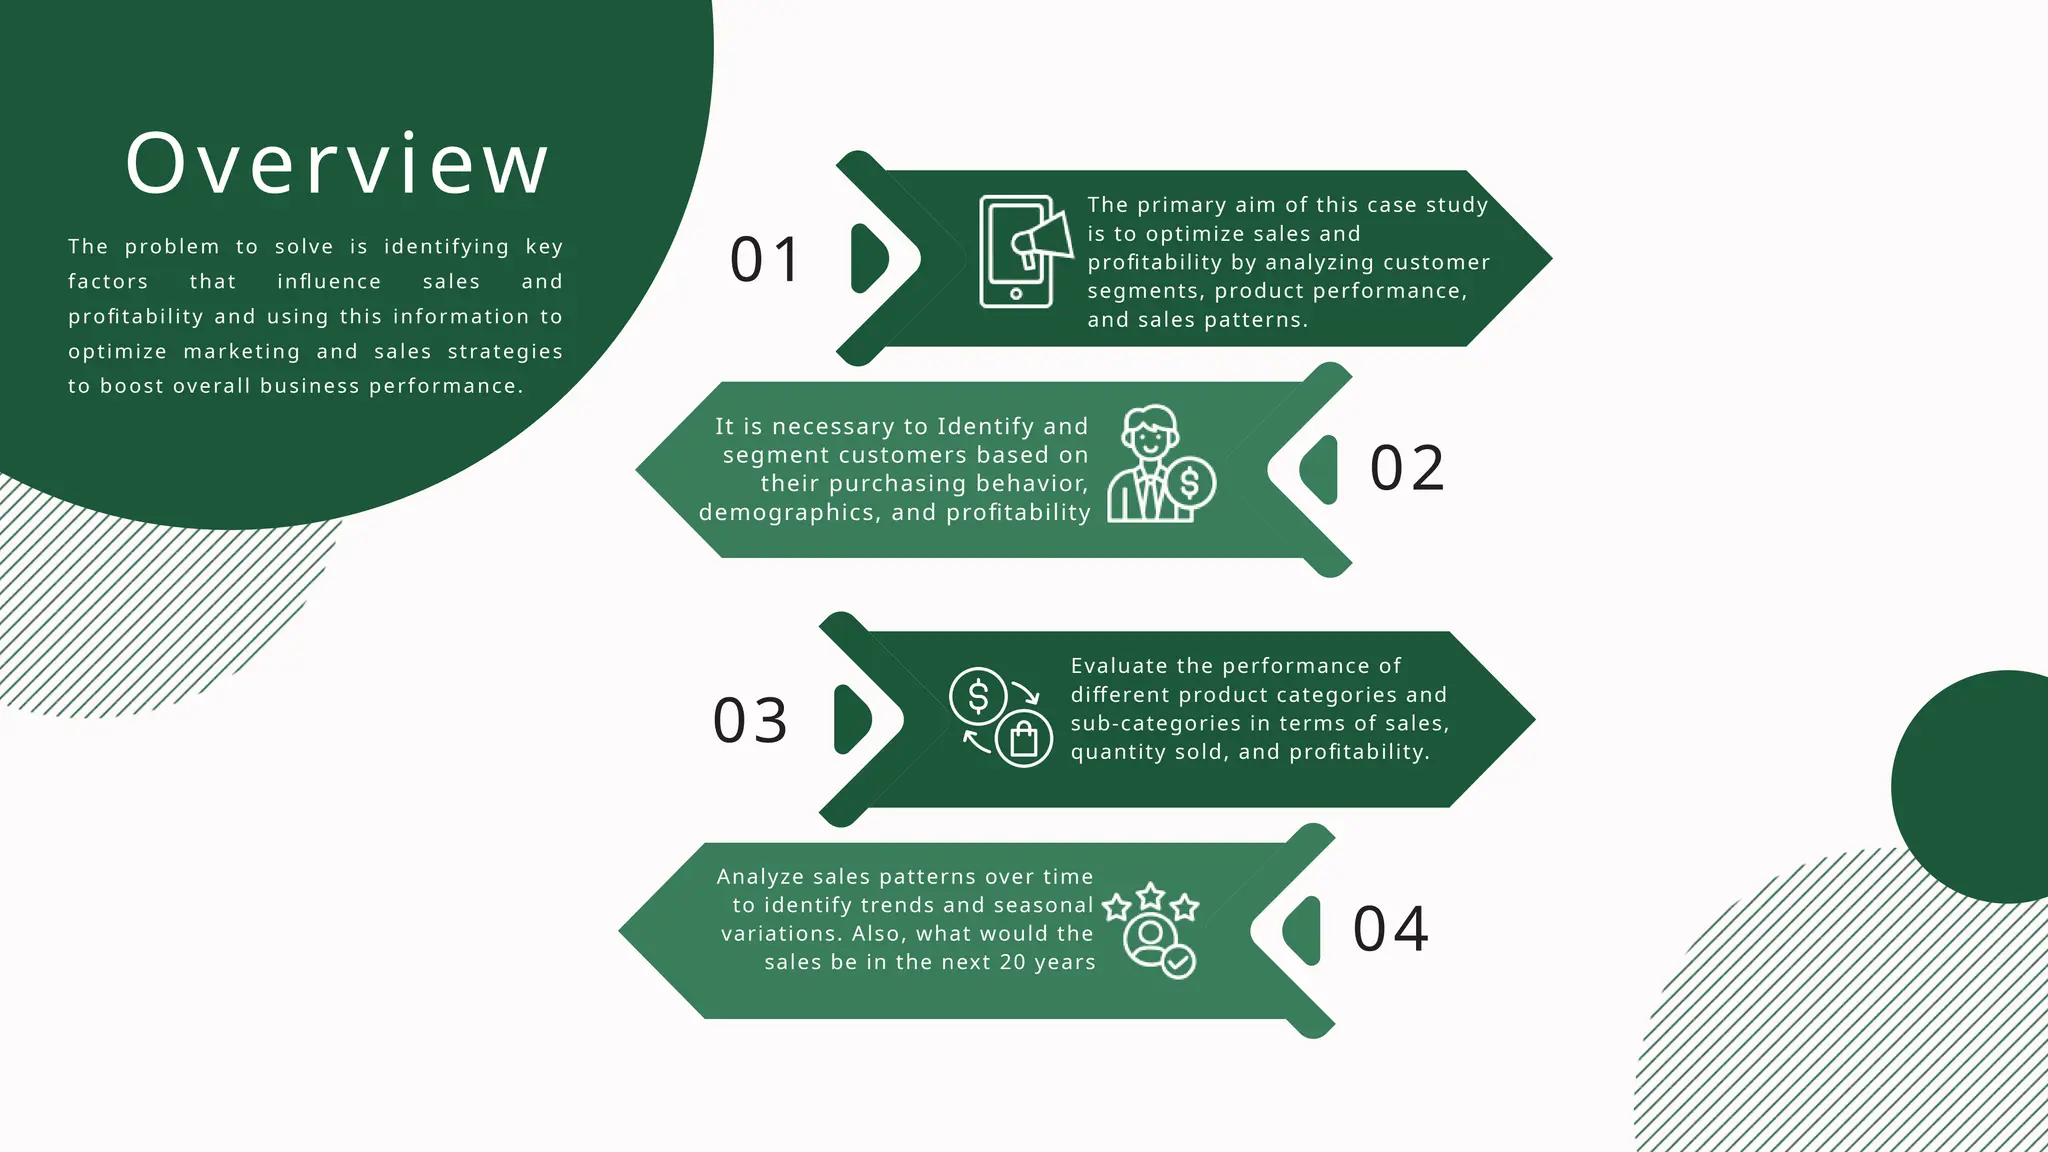
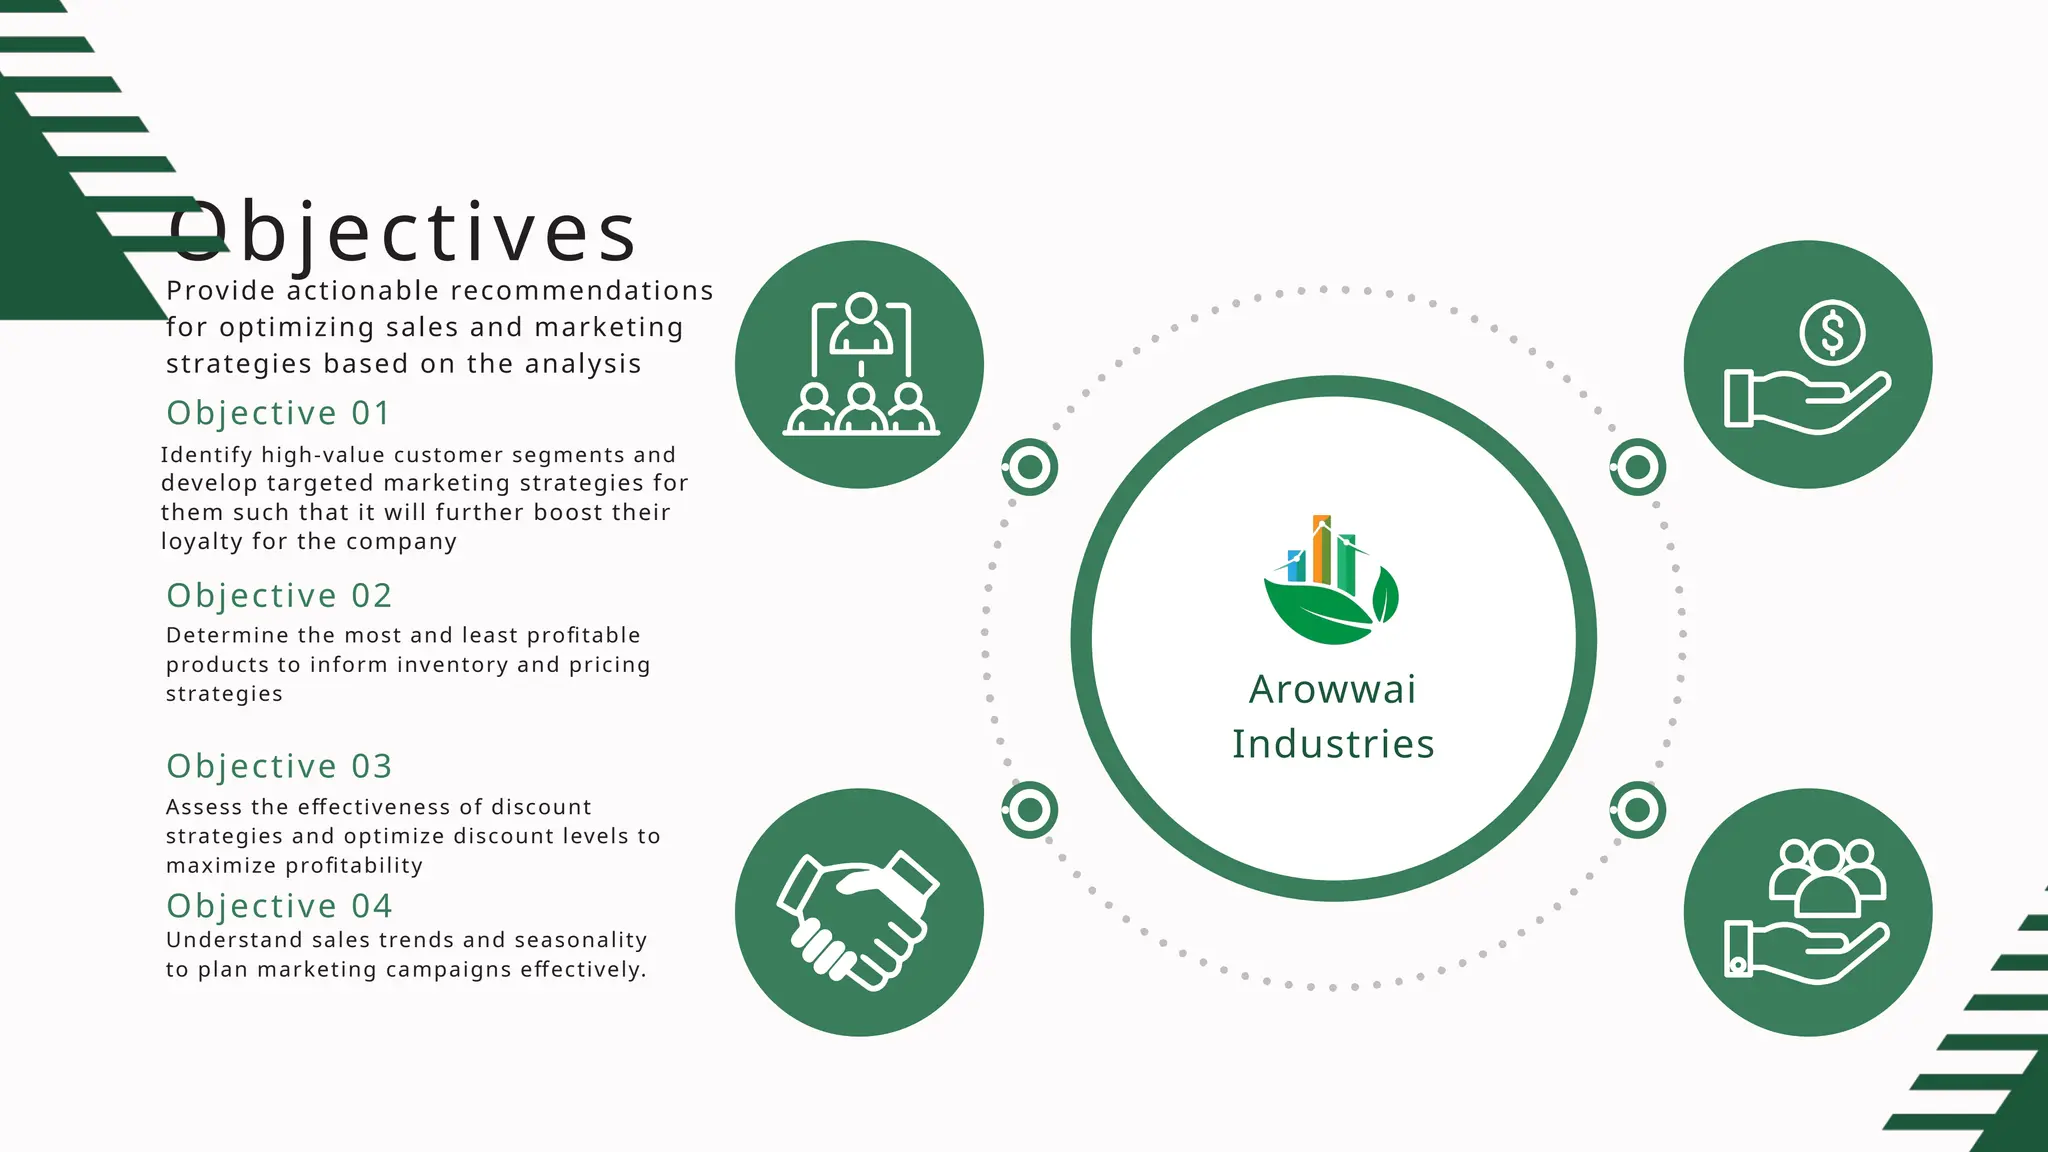
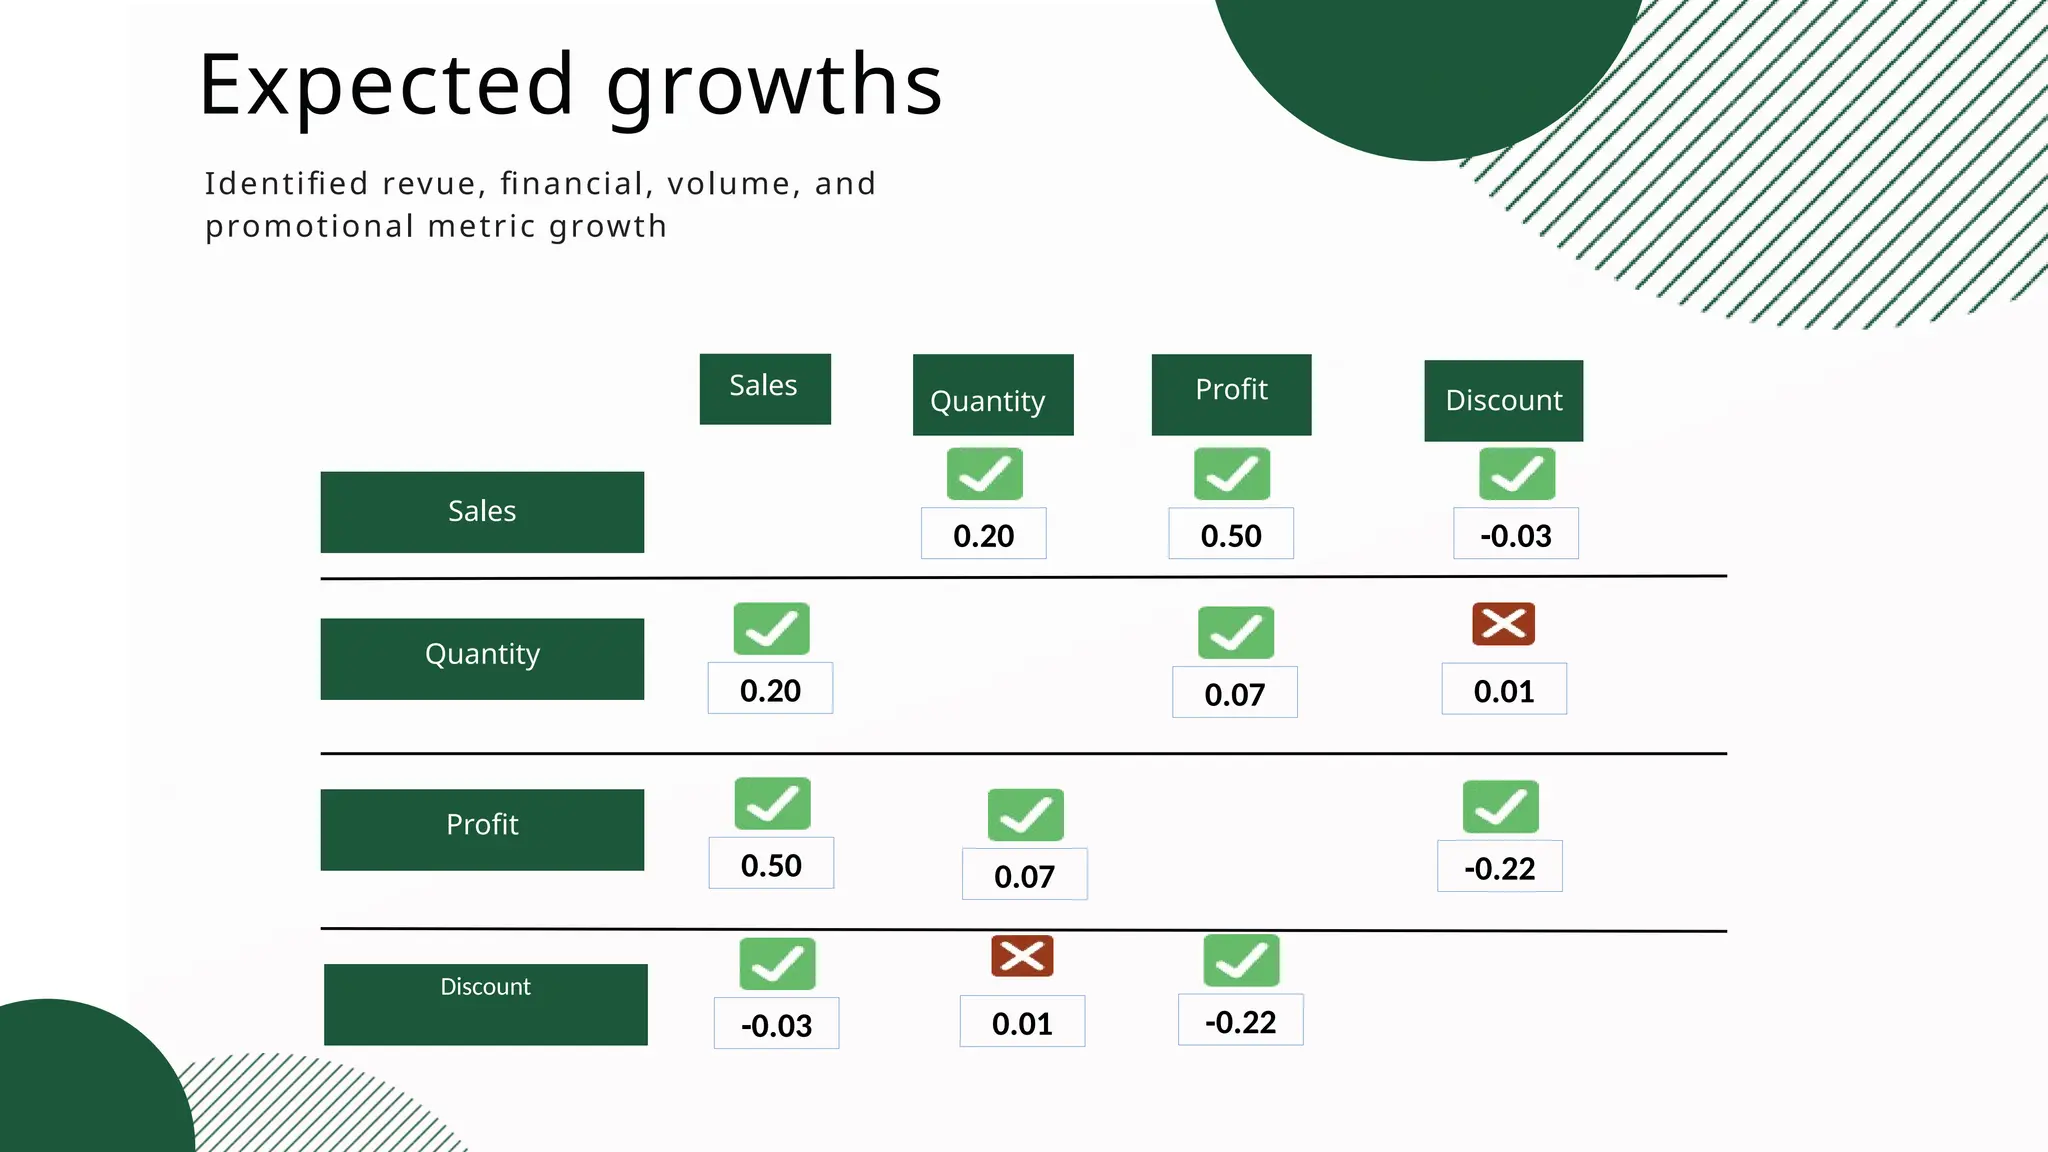
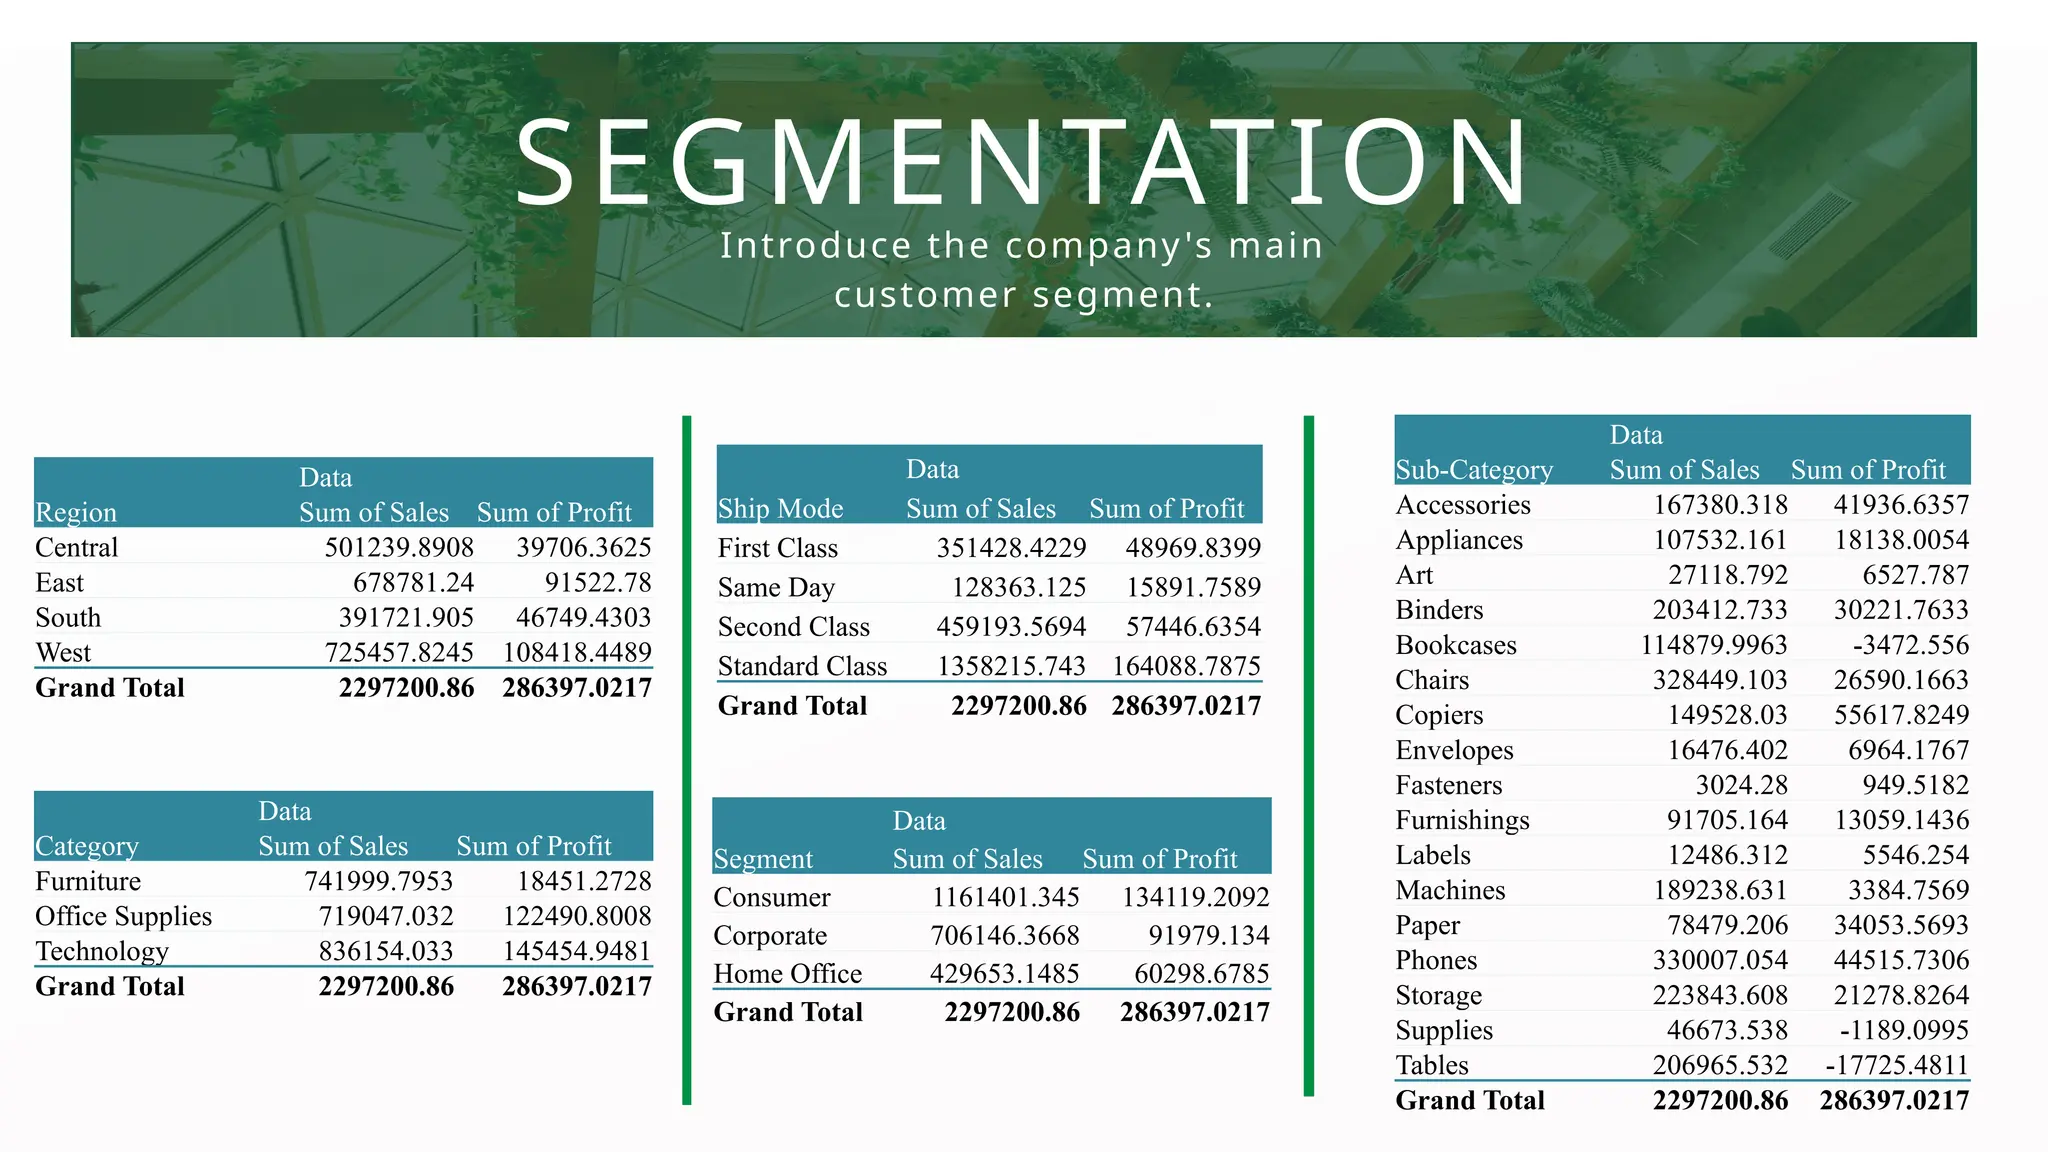
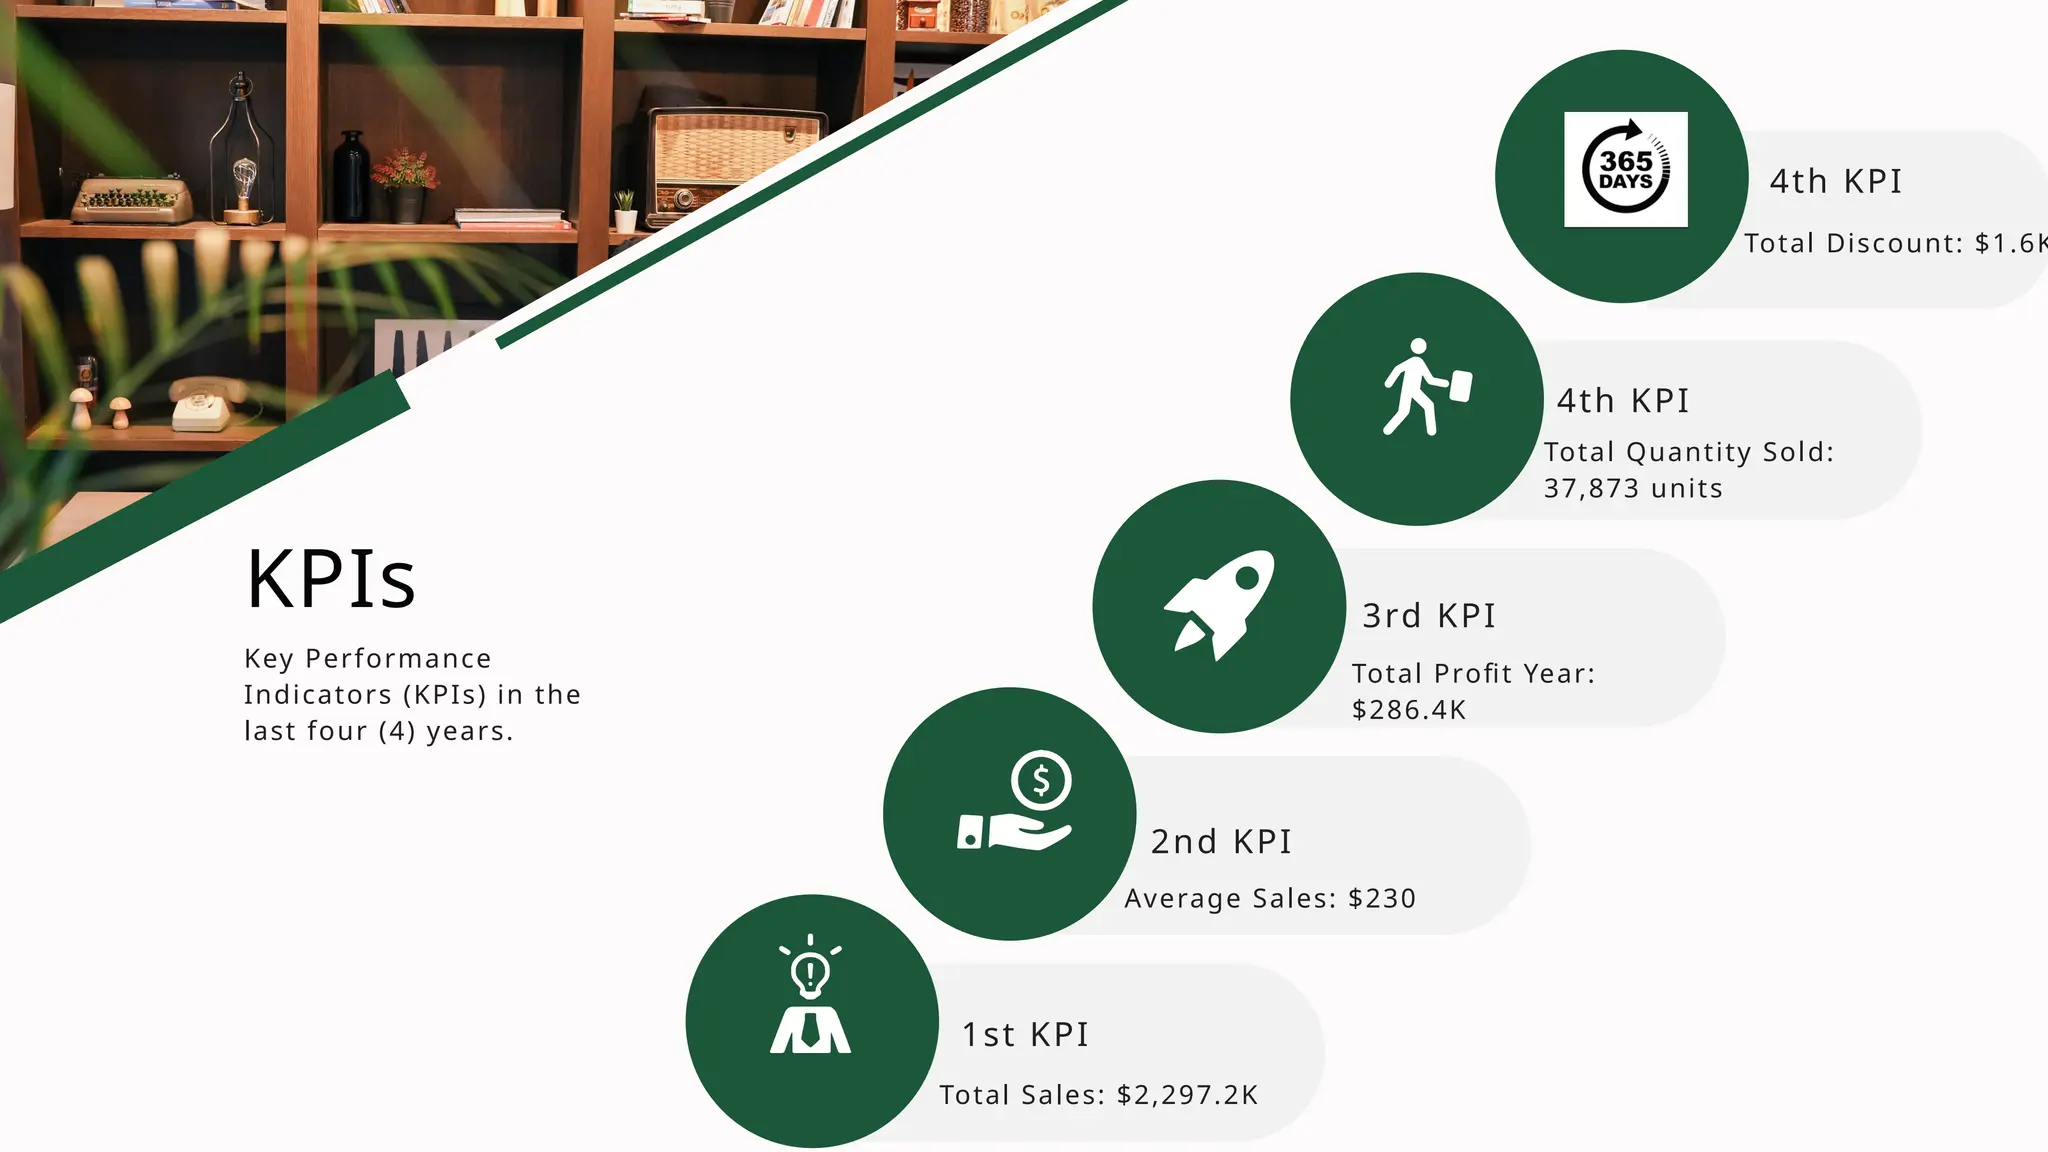
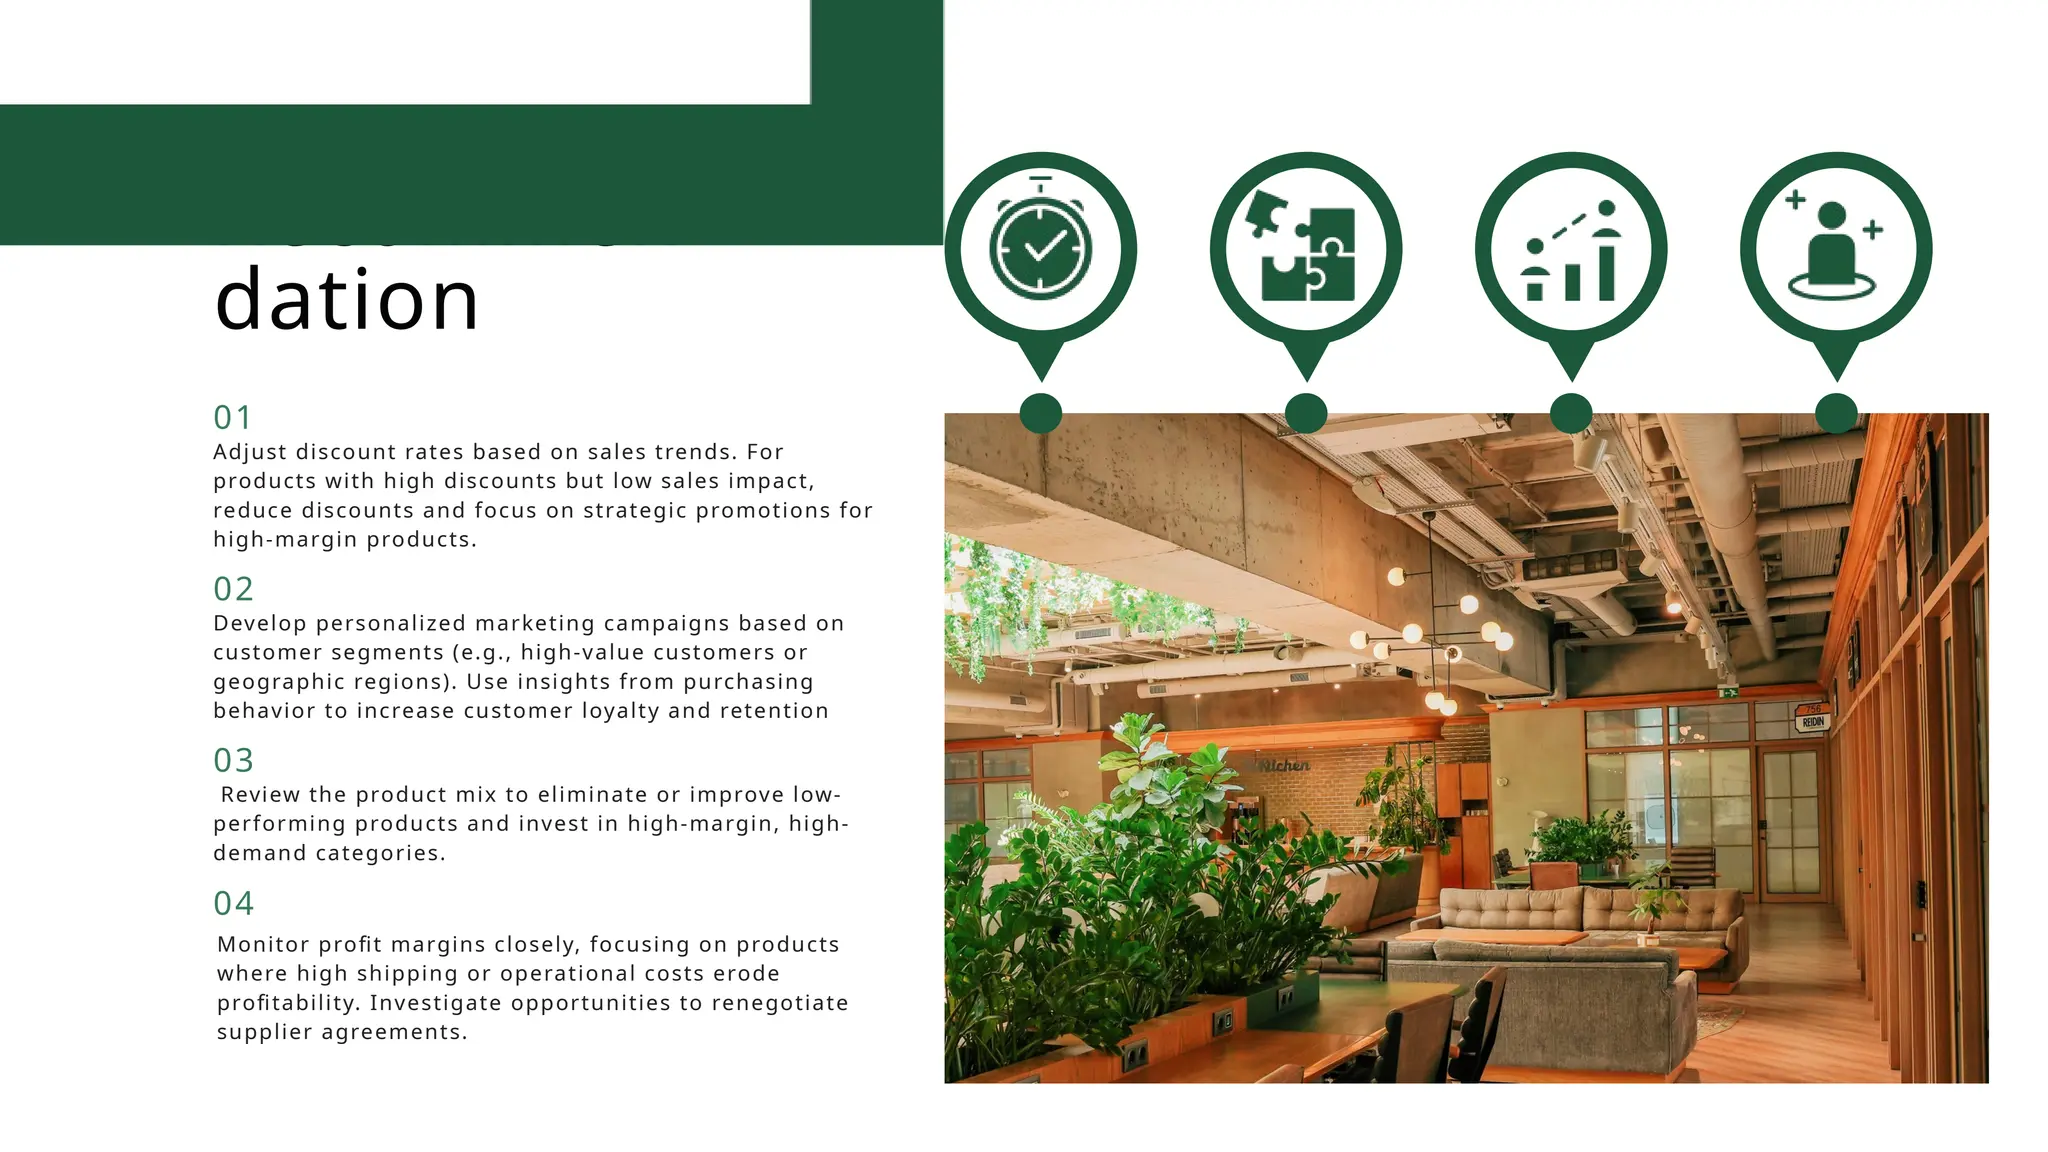
Presentation 2024
Marketing Analysis
Retail Sales Analytic
Business
Analysis
Content
01
02
03
04
05
06
Introduction
Overview
Methodology
Key Insights and Findings
Recommendations and
Implementation
Conclusion
Overview The primary aim of this case study
is to optimize sales and
profitability by analyzing customer
segments, product performance,
and sales patterns.
01
02
Evaluate the performance of
different product categories and
sub-categories in terms of sales,
quantity sold, and profitability.
03
04
It is necessary to Identify and
segment customers based on
their purchasing behavior,
demographics, and profitability
Analyze sales patterns over time
to identify trends and seasonal
variations. Also, what would the
sales be in the next 20 years
The problem to solve is identifying key
factors that influence sales and
profitability and using this information to
optimize marketing and sales strategies
to boost overall business performance.
Objectives
Arowwai
Industries
Identify high-value customer segments and
develop targeted marketing strategies for
them such that it will further boost their
loyalty for the company
Objective 01
Determine the most and least profitable
products to inform inventory and pricing
strategies
Objective 02
Assess the effectiveness of discount
strategies and optimize discount levels to
maximize profitability
Objective 03
Understand sales trends and seasonality
to plan marketing campaigns effectively.
Objective 04
Provide actionable recommendations
for optimizing sales and marketing
strategies based on the analysis
Data Collection
Methodology
The Superstore dataset is a popular dataset
used for retail and business analytics,
containing transactional data from a fictional
store.
Data Analysis
The summary status such as the average,
percentage, frequency were used. Also, text
analysis was used for the thematic analysis
part.
Data Analysis Tools
Excel was used for the data entry in
conjunction with Powerbi used for the
visualization purposes , and R was used to
handled the advance part of the analysis
Sale
pattern
There was a balanced trend in the
number of times the sales increase and
decrease. The sales fluctuate for the 4yrs
01
Sum of Percent for Decrease (54.23%
increase) trended up while Increase
(77.56% decrease) trended down between
Friday, January 3, 2014 and Friday,
December 29, 2017.
02
The most recent Sum of Percent anomaly
was on Tuesday, December 5, 2017, when
Increase had a high of 13,506.14.
03
Sum of Percent for Increase started
trending up on Friday, December 11,
2015, rising by 972.29% (95.32) in 6 days.
04
Sale
pattern
Sum of Percent for Increase and Decrease
diverged the most when the Day was Tue,
when Increase were 71,379.25 higher
than Decrease
01
Sum of Percent for Increase and Decrease
diverged the most when the Month was
Dec, when Increase were 130,105.37
higher than Decrease.
02
There was uptrends and downtrend in the
patterns for each year. Dec in Label
Increase made up 34.90% of Sum of
Percent.
03
Quantity Profit
Sales
Expected growths
Identified revue, financial, volume, and
promotional metric growth
Sales
Quantity
Profit
Discount
Discount
0.20
-0.03
0.50
0.20 0.07 0.01
0.50 -0.22
0.07
-0.03
0.01 -0.22
95%
Customer’s
experience
Good experience
The customer’s experience was
measured based on the number
of times they bought goods
from the company. It was
believed that any customer that
bought something (any product)
from the company more than
one time has shared a good
experience with the company
service, and always want to
come back.
SEGMENTATION
Introduce the company's main
customer segment.
Data
Region Sum of Sales Sum of Profit
Central 501239.8908 39706.3625
East 678781.24 91522.78
South 391721.905 46749.4303
West 725457.8245 108418.4489
Grand Total 2297200.86 286397.0217
Data
Ship Mode Sum of Sales Sum of Profit
First Class 351428.4229 48969.8399
Same Day 128363.125 15891.7589
Second Class 459193.5694 57446.6354
Standard Class 1358215.743 164088.7875
Grand Total 2297200.86 286397.0217
Data
Segment Sum of Sales Sum of Profit
Consumer 1161401.345 134119.2092
Corporate 706146.3668 91979.134
Home Office 429653.1485 60298.6785
Grand Total 2297200.86 286397.0217
Data
Category Sum of Sales Sum of Profit
Furniture 741999.7953 18451.2728
Office Supplies 719047.032 122490.8008
Technology 836154.033 145454.9481
Grand Total 2297200.86 286397.0217
Data
Sub-Category Sum of Sales Sum of Profit
Accessories 167380.318 41936.6357
Appliances 107532.161 18138.0054
Art 27118.792 6527.787
Binders 203412.733 30221.7633
Bookcases 114879.9963 -3472.556
Chairs 328449.103 26590.1663
Copiers 149528.03 55617.8249
Envelopes 16476.402 6964.1767
Fasteners 3024.28 949.5182
Furnishings 91705.164 13059.1436
Labels 12486.312 5546.254
Machines 189238.631 3384.7569
Paper 78479.206 34053.5693
Phones 330007.054 44515.7306
Storage 223843.608 21278.8264
Supplies 46673.538 -1189.0995
Tables 206965.532 -17725.4811
Grand Total 2297200.86 286397.0217
Customer’s experience
Sales
Customer’s purchasing experience Customer’s purchasing experience Customer’s purchasing experience
Customer’s purchasing experience
1st KPI
2nd KPI
3rd KPI
4th KPI
KPIs
Key Performance
Indicators (KPIs) in the
last four (4) years.
Total Sales: $2,297.2K
Average Sales: $230
Total Profit Year:
$286.4K
Total Quantity Sold:
37,873 units
4th KPI
Total Discount: $1.6K
Recommen
dation
Adjust discount rates based on sales trends. For
products with high discounts but low sales impact,
reduce discounts and focus on strategic promotions for
high-margin products.
01
Develop personalized marketing campaigns based on
customer segments (e.g., high-value customers or
geographic regions). Use insights from purchasing
behavior to increase customer loyalty and retention
02
Review the product mix to eliminate or improve low-
performing products and invest in high-margin, high-
demand categories.
03
Monitor profit margins closely, focusing on products
where high shipping or operational costs erode
profitability. Investigate opportunities to renegotiate
supplier agreements.
04
THANK
YOU
Superstore Data
https://josephdamilare01.github.io
johdam01@gmail.com
+123-8147 -003647
Joseph ADEKUNLE

Retail Sales Analytic on Superstore Dataset

  • 1.
    Presentation 2024 Marketing Analysis RetailSales Analytic Business Analysis
  • 2.
    Content 01 02 03 04 05 06 Introduction Overview Methodology Key Insights andFindings Recommendations and Implementation Conclusion
  • 3.
    Overview The primaryaim of this case study is to optimize sales and profitability by analyzing customer segments, product performance, and sales patterns. 01 02 Evaluate the performance of different product categories and sub-categories in terms of sales, quantity sold, and profitability. 03 04 It is necessary to Identify and segment customers based on their purchasing behavior, demographics, and profitability Analyze sales patterns over time to identify trends and seasonal variations. Also, what would the sales be in the next 20 years The problem to solve is identifying key factors that influence sales and profitability and using this information to optimize marketing and sales strategies to boost overall business performance.
  • 4.
    Objectives Arowwai Industries Identify high-value customersegments and develop targeted marketing strategies for them such that it will further boost their loyalty for the company Objective 01 Determine the most and least profitable products to inform inventory and pricing strategies Objective 02 Assess the effectiveness of discount strategies and optimize discount levels to maximize profitability Objective 03 Understand sales trends and seasonality to plan marketing campaigns effectively. Objective 04 Provide actionable recommendations for optimizing sales and marketing strategies based on the analysis
  • 5.
    Data Collection Methodology The Superstoredataset is a popular dataset used for retail and business analytics, containing transactional data from a fictional store. Data Analysis The summary status such as the average, percentage, frequency were used. Also, text analysis was used for the thematic analysis part. Data Analysis Tools Excel was used for the data entry in conjunction with Powerbi used for the visualization purposes , and R was used to handled the advance part of the analysis
  • 6.
    Sale pattern There was abalanced trend in the number of times the sales increase and decrease. The sales fluctuate for the 4yrs 01 Sum of Percent for Decrease (54.23% increase) trended up while Increase (77.56% decrease) trended down between Friday, January 3, 2014 and Friday, December 29, 2017. 02 The most recent Sum of Percent anomaly was on Tuesday, December 5, 2017, when Increase had a high of 13,506.14. 03 Sum of Percent for Increase started trending up on Friday, December 11, 2015, rising by 972.29% (95.32) in 6 days. 04
  • 7.
    Sale pattern Sum of Percentfor Increase and Decrease diverged the most when the Day was Tue, when Increase were 71,379.25 higher than Decrease 01 Sum of Percent for Increase and Decrease diverged the most when the Month was Dec, when Increase were 130,105.37 higher than Decrease. 02 There was uptrends and downtrend in the patterns for each year. Dec in Label Increase made up 34.90% of Sum of Percent. 03
  • 8.
    Quantity Profit Sales Expected growths Identifiedrevue, financial, volume, and promotional metric growth Sales Quantity Profit Discount Discount 0.20 -0.03 0.50 0.20 0.07 0.01 0.50 -0.22 0.07 -0.03 0.01 -0.22
  • 9.
    95% Customer’s experience Good experience The customer’sexperience was measured based on the number of times they bought goods from the company. It was believed that any customer that bought something (any product) from the company more than one time has shared a good experience with the company service, and always want to come back.
  • 10.
    SEGMENTATION Introduce the company'smain customer segment. Data Region Sum of Sales Sum of Profit Central 501239.8908 39706.3625 East 678781.24 91522.78 South 391721.905 46749.4303 West 725457.8245 108418.4489 Grand Total 2297200.86 286397.0217 Data Ship Mode Sum of Sales Sum of Profit First Class 351428.4229 48969.8399 Same Day 128363.125 15891.7589 Second Class 459193.5694 57446.6354 Standard Class 1358215.743 164088.7875 Grand Total 2297200.86 286397.0217 Data Segment Sum of Sales Sum of Profit Consumer 1161401.345 134119.2092 Corporate 706146.3668 91979.134 Home Office 429653.1485 60298.6785 Grand Total 2297200.86 286397.0217 Data Category Sum of Sales Sum of Profit Furniture 741999.7953 18451.2728 Office Supplies 719047.032 122490.8008 Technology 836154.033 145454.9481 Grand Total 2297200.86 286397.0217 Data Sub-Category Sum of Sales Sum of Profit Accessories 167380.318 41936.6357 Appliances 107532.161 18138.0054 Art 27118.792 6527.787 Binders 203412.733 30221.7633 Bookcases 114879.9963 -3472.556 Chairs 328449.103 26590.1663 Copiers 149528.03 55617.8249 Envelopes 16476.402 6964.1767 Fasteners 3024.28 949.5182 Furnishings 91705.164 13059.1436 Labels 12486.312 5546.254 Machines 189238.631 3384.7569 Paper 78479.206 34053.5693 Phones 330007.054 44515.7306 Storage 223843.608 21278.8264 Supplies 46673.538 -1189.0995 Tables 206965.532 -17725.4811 Grand Total 2297200.86 286397.0217
  • 11.
    Customer’s experience Sales Customer’s purchasingexperience Customer’s purchasing experience Customer’s purchasing experience Customer’s purchasing experience
  • 12.
    1st KPI 2nd KPI 3rdKPI 4th KPI KPIs Key Performance Indicators (KPIs) in the last four (4) years. Total Sales: $2,297.2K Average Sales: $230 Total Profit Year: $286.4K Total Quantity Sold: 37,873 units 4th KPI Total Discount: $1.6K
  • 13.
    Recommen dation Adjust discount ratesbased on sales trends. For products with high discounts but low sales impact, reduce discounts and focus on strategic promotions for high-margin products. 01 Develop personalized marketing campaigns based on customer segments (e.g., high-value customers or geographic regions). Use insights from purchasing behavior to increase customer loyalty and retention 02 Review the product mix to eliminate or improve low- performing products and invest in high-margin, high- demand categories. 03 Monitor profit margins closely, focusing on products where high shipping or operational costs erode profitability. Investigate opportunities to renegotiate supplier agreements. 04
  • 14.