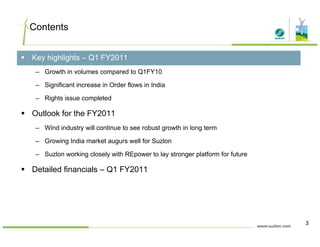
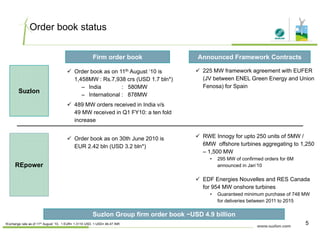
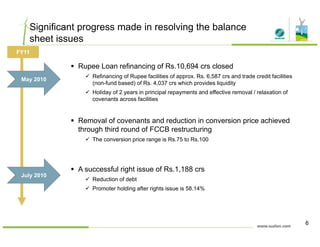
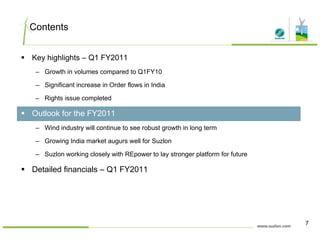
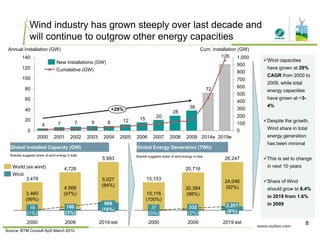
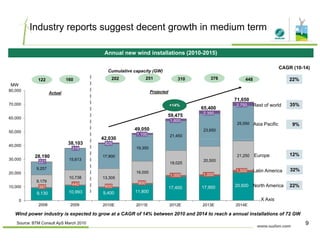
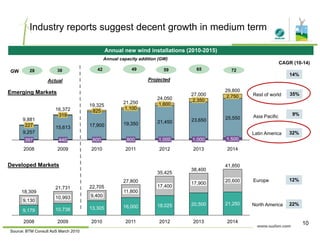
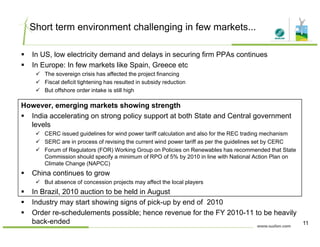
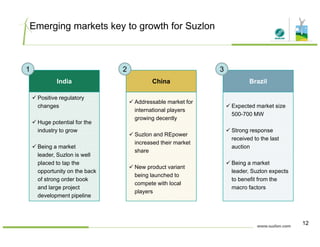
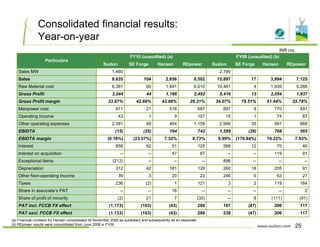
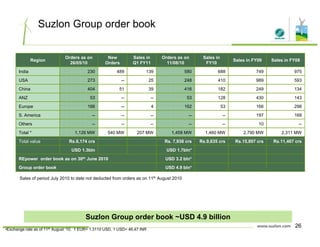
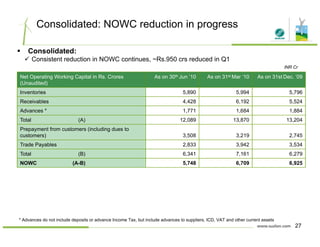
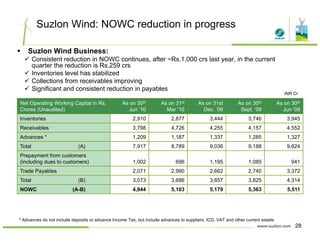
The document is Suzlon Energy Limited's presentation of its Q1 FY2011 results. Some key highlights include growth in Suzlon's wind turbine volume compared to Q1 FY2010, a significant increase in order flows in India, and the successful completion of a rights issue. The outlook suggests the wind industry will continue robust long-term growth, with the growing Indian market benefiting Suzlon. Suzlon is also working closely with REpower to strengthen their future platform.
Suzlon - Q1 FY 12 Earnings PresentationSuzlon Group
This document is an earnings presentation by Suzlon Energy Limited for Q1 of fiscal year 2012. It includes the following key points:
- Revenues grew 80% year-over-year in Q1 FY12 and performance is on track to meet full-year guidance.
- The order book stands at $6.6 billion, 35% higher than the previous year.
- A "squeeze out" process is underway to acquire remaining shares of REpower for €142.77 per share.
- A sale of the Hansen stake is expected to generate Rs. 828 crores and help reduce debt levels.
- Global fleet availability remains over 97% due to ongoing optimization programs.
-
This presentation provides an overview of Suzlon Energy's financial performance in FY15 and strategic initiatives to improve its financial position. Key points include:
- Volume and revenues declined in FY15 due to liquidity constraints but EBITDA losses narrowed compared to prior years.
- Strategic transactions completed in Q1 FY16 including the Senvion sale and preferential allotment from DSA that raised ~Rs. 8,800 crores to reduce debt and boost liquidity for growth.
- Order backlog of 1,123 MW as of March 2015 with additional potential orders of 450 MW from a wind farm JV with DSA positioning Suzlon for volume growth.
On 16 March 2012, the Honorable Finance Minister of India presented in the Parliament the country's Finance Bill for 2012-13, containing proposals on direct and indirect taxes, and key policy initiatives.
In this regard, with pleasure we are presenting our annual India Budget publication. The publication summarizes the key changes announced by the Finance Minister in his speech.
Most direct tax proposals in the Finance Bill 2012 are proposed to be effective from the financial year commencing on 1 April 2012 unless specified otherwise and indirect tax proposals are effective immediately, unless specified otherwise
We hope you find it an interesting and informative read.
Team SPN
TVS Motor Q1FY15: Business outlook strong; New launch impacts marginsIndiaNotes.com
TVS Motor’s 1QFY15 performance was below estimate, with EBITDA margin at 5.7% (v/s est. of 6.8%), resulting in PAT growth of 39% YoY to INR723m (est. INR953m). Motilal Oswal maintain FY16E estimates, buy.
SMS CO., LTD. FY03-17 Presentation material for IRsmsir
This is the presentation material for IR of SMS CO., LTD.(Securities Code:2175 / TSE1)
Financial Results Summary for the Fiscal Year Ending March 31, 2017 (the 14th Fiscal Year)
Q3FY15: Buy PTC India for upside 22%, target price 109IndiaNotes.com
PTC India reported lower than estimated quarterly revenues and profits. Revenues were INR28.2 billion, lower than the estimate of INR33 billion due to lower trading volumes and realization. Reported profit was INR66 million versus the estimate of INR364 million. However, adjusted profit of INR391 million was boosted by rebate and surcharge income. Trading margins of Ps4.7/unit were better than estimated but tolling margins and volumes were lower. Grid constraints impacted overall volumes. The company maintains a buy rating with a target price of INR109 per share based on a sum-of-the-parts valuation.
See the Chart of Indian IIP Trend in Narnolia Securities Limited Market Diary 14.02.2014
http://www.narnolia.com/index.php/category/archieve/market-diary/
Kengen is a Kenyan power company that aims to generate 3,000MW of power by 2018 (Horizon II of its "Good to Great" plan). As of 2015, installed capacity was 1,537MW, making the Horizon II target unlikely. Kengen plans to raise capital through a rights issue and debt conversion to equity to fund projects that could add 1,000MW by 2018. However, the company has high capital expenditures, accounting policies that boost profits, and is expected to have slowing growth. The analyst recommends selling the stock, as its ambitious expansion plans threaten cash flows and it is unlikely to deliver long-term value.
The document is a daily equity report published by CapitalStars Financial Research Pvt. Ltd. that provides information on the performance of the Indian equity market and key stocks. It summarizes that the Indian equity market rose to a new record high supported by reforms increasing FDI limits. It also reports financial results from companies such as Glenmark Pharma, Wipro, and Century Textiles showing increased profits. The report provides closing numbers and trends for various indices as well as notable gainers and losers among stocks.
SMS CO., LTD. FY03-18 Q1 Presentation material for IRsmsir
This is the presentation material for IR of SMS CO., LTD.(Securities Code:2175 / TSE1)
Financial Results Summary for the First Quarter of
the Fiscal Year Ending March 31, 2018 (the 15th Fiscal Year)
Alt R - ACPL - Initiating Coverage - 15th Sept 2016Ali Shah Jumani
We initiate the coverage of Attock Cement Pakistan Limited (ACPL) with the “BUY” recommendation and the target price for Jun’17 of PKR 322/share providing total upside of 32.29%, including capital gain accounting for 28.29% at the current price of 251 and dividend yield of 4% on target price.
SMS CO., LTD. FY03-17 1H Presentation material for IRsmsir
This document provides an earnings summary and forecasts for SMS CO., LTD. for the first half of the fiscal year ending March 31, 2017:
- Net sales and income increased significantly compared to the same period the previous year and exceeded initial forecasts. The nursing care and career segments in particular saw substantial growth.
- Full-year forecasts for fiscal year ending March 31, 2017 have been revised upward based on strong first half performance. The company plans to reinvest part of the surplus into new initiatives to support further growth.
- Key businesses and segments like Kaipoke nursing care management support and the MIMS overseas healthcare information group performed well and contributed to revenue increases. The company aims to further develop businesses in growing fields
This report analyzes the Pakistan cement sector. Key points:
- Cement demand grew 9.81% in FY16 due to projects like CPEC and housing developments, but exports declined 18.38% due to issues like anti-dumping duties.
- Domestic demand is expected to continue growing robustly due to factors like CPEC and increased public spending, but many new expansion projects could lower capacity utilization to 70% by FY19 and possibly spark a price war.
- The cement/GDP multiplier was historically 2.6x but fell recently; it may rebound to 2.6x by FY21 given large infrastructure projects, supporting demand growth to 57 million
SMS CO., LTD. FY03-17 1Q Presentation material for IRsmsir
This is the presentation material for IR of SMS CO., LTD.(Securities Code:2175 / TSE1)
Financial Results Summary for the First Quarter of the Fiscal Year Ended March 31, 2017 (the 14th Fiscal Year)
SMS CO., LTD. FY03-16 Presentation material for IR smsir
Launch new services
- Strengthen partnerships
- Expand services
- Expand to new countries
- Develop new services
- Launch new services in key countries
- Expand to other countries
- Strengthen partnerships
- Develop new services
- Promote online systemization
- Expand to other countries
- Strengthen partnerships
- Develop new services
- Expand to other countries
- Develop new services
- Strengthen partnerships
- Develop new services
- Expand to other countries
- Develop new services
- Strengthen partnerships
- Develop new services
SMS CO., LTD. FY03-18 1H Presentation material for IRsmsir
The document is a presentation material for investors from SMS CO., LTD providing a financial results summary for the first half of the fiscal year ending March 31, 2018. It discusses higher than expected net sales but lower than expected incomes due to additional investments in the high-performing Elderly Care Career Segment. While incomes are below forecasts, the company expects to achieve its full-year forecasts. The summary also highlights steady growth in the Elderly Care and Medical Care Career and Elderly Care Operators segments.
SMS CO., LTD. FY03-16 2Q Presentation material for IRsmsir
1) SMS reported financial results for the first half of FY03/16 ending March 31, 2016, with net sales and incomes increasing significantly year-over-year. Both net sales and incomes were in line with forecasts.
2) Key drivers of growth included a significant increase in sales from Kaipoke management support services, and steady increases across most career-related and other services. Cost controls also contributed to incomes exceeding forecasts.
3) Memberships for Kaipoke increased steadily in the first half as planned, through expanded sales activities and new service offerings.
The document summarizes details of the IRCTC IPO, including:
- IRCTC is issuing shares worth Rs.645 crore with a price band of Rs.315-320 per share.
- Half of shares are reserved for QIBs, 35% for retail investors, and 15% for HNIs.
- IRCTC's revenue and profits have grown at a CAGR of 10-9% in recent years, with net profit margins of 14% in FY2019.
- Based on valuation analyses, the IPO appears underpriced by 77-116% compared to the company's estimated future cash flows and growth potential.
The document contains summaries of various news articles:
1. The Finance Ministry has revised caps on foreign investment in government securities and corporate bonds, raising the limits to $10 billion and $20 billion respectively.
2. RIL has disclosed annual reports for most but not all of its subsidiaries, remaining silent on details for some including two exploration subsidiaries and a joint venture.
3. Bank deposits saw their highest rise this year in September, with total deposits increasing Rs. 33,581 crores and credit growing 19% year-over-year, partly due to increased deposit rates.
ICICI Prudential Growth Fund - Series 2 (Presentation)iciciprumf
This document summarizes an investment product called the ICICI Prudential Growth Fund - Series 2. The following points are highlighted:
1. It is a 3.5 year close-ended diversified equity fund that aims to provide capital appreciation by investing in 40-60 stocks across market caps with a focus on mid and small caps.
2. The fund maturity is set to end 1 year before the elected government's term to potentially benefit from large deliveries in the last 1-2 years of their term when market valuations may reflect government efforts.
3. A high conviction portfolio will be created using screens for data integrity, company characteristics like competitive edge and financial strength. Valuations will also be
The daily equity report summarizes the performance of the Indian and global stock markets. In India, key indices ended flat amid profit taking in Infosys and selling by foreign investors, while inflation fell to a four-month low. Globally, Asian and European markets gained while US futures pointed higher. The report also provides analysis of top gaining and losing stocks in India and recommendations on market trends.
SMS CO., LTD. FY03-16 3Q Presentation material for IR smsir
SMS CO., LTD. presented materials summarizing its financial results for the third quarter of the fiscal year ending March 31, 2016. Net sales and incomes increased year-over-year, driven by strong growth in Kaipoke membership management support services and other businesses. While recruiting agent services fell short of initial forecasts, expenses were lower than planned, allowing net income to meet full-year targets despite revenue shortfalls in some areas.
SMS CO., LTD. FY03-17 3Q Presentation material for IRsmsir
This is the presentation material for IR of SMS CO., LTD.(Securities Code:2175 / TSE1)
Financial Results Summary for the Third Quarter of the Fiscal Year Ending March 31, 2017 (the 14th Fiscal Year)
The Indian equity market rose over 1% snapping a four-day losing streak, led by gains in realty, oil and gas, power, capital goods and banking stocks. Asian stock markets edged higher but gains were limited as investors monitored developments in Iraq. European stocks edged higher as well while US stock futures pointed to a lower open as investors eyed upcoming US economic data. Key indices closed higher with the Sensex up 1.3% and Nifty up 1.2%.
- Total energy sales for the Group increased 4.7% in 3Q13 compared to 3Q12. Energy sales in the concession area increased 4.3% driven by growth in residential, commercial, and industrial segments.
- EBITDA increased 13.6% to R$1,012 million in 3Q13 compared to R$891 million in 3Q12, driven by lower sector charges and higher energy sales, partially offset by higher energy costs.
- Net income was R$282 million in 3Q13 compared to R$356 million in 3Q12, impacted by higher financial expenses and update of discos' financial assets.
The document summarizes Arif Mustafa's winter internship report at the Financial Reporting department. As part of a group project, Arif and his teammates presented on the circular debt in Pakistan's energy sector. They collected data from various sources to understand the dynamics of circular debt and its impact. Circular debt occurs when entities are both creditors and debtors to each other, and the debt continues growing as payments are not made. In Pakistan's energy sector, cash flow issues due to circular debt have reduced efficiency. This contributed to economic losses. The project helped Arif learn about Pakistan's energy sector, key players, and how circular debt affected the performance of entities like PSO. He projected that circular debt resolution and stabilized oil
Suzlon Energy Ltd is an Indian wind turbine manufacturer that has vertically integrated its supply chain. It designs, manufactures, and installs wind turbines as well as provides operation and maintenance services. Suzlon has manufacturing plants and R&D centers across several countries and acquired other wind energy companies to expand its product portfolio and global reach. Vertical integration allows Suzlon to have control over its supply chain and offer turnkey solutions while facing challenges from declining sales, new competitors, and needing to reduce costs.
Suzlon is an Indian wind turbine manufacturer founded in 1995 and headquartered in Pune, India. It has manufacturing plants across India with a total annual capacity of over 12,000 MW. Suzlon offers wind turbines from 600 kW to 2.1 MW and provides full wind power solutions from assembly to installation. While Suzlon was once a leader in the wind energy sector, it has struggled financially in recent years due to high debt, slow sales growth, and increased competition. To address its weaknesses, Suzlon is focusing on offshore markets, cost reductions, debt repayment, and diversifying into other renewable energy sources like solar.
Suzlon began in 1995 in India as the country's first wind energy company. Starting with just 20 employees and a 3 MW wind farm, Suzlon has grown significantly to become the 5th largest wind turbine manufacturer globally with over 13,000 employees worldwide. Suzlon aims to be among the top 3 wind energy companies through technological leadership and innovation. The company focuses on research and development, manufacturing, and global expansion strategies like entering new markets to continue its strong growth.
Suzlon Energy is a global wind turbine supplier headquartered in India. It has over 14,000 employees and manufacturing units in India, Europe, and China. Suzlon has a global market share of 9.8% and leads the Indian market with approximately 50% share. It has a presence in over 30 countries across 5 continents. Suzlon offers onshore and offshore wind turbines through its Suzlon and REpower brands. The company focuses on R&D to develop new wind turbine models and remains focused on growing its global presence. However, Suzlon also faces challenges like high debt levels, competition from other major wind turbine suppliers, and risks from changes in government policies.
Vestas, the world leader in wind energy, partnered with LinkedIn and Vertic to launch an awareness campaign targeting decision makers at Fortune 1000 companies. The campaign delivered dynamically customized banner ads and messages to over 419,000 employees and 300 executives. It also directed users to company-specific microsites containing insights about renewable energy and Vestas. The campaign achieved over 11 million impressions with high click-through rates. It drove over 10,000 visitors who spent an average of 7 minutes on the personalized microsites. The campaign successfully expanded Vestas' reach and positioned them as a preferred partner among corporate stakeholders.
The document discusses the global wind turbine market and Suzlon Energy Ltd.'s position within it. It analyzes factors like the financial crisis, growth opportunities in different regions, competitors, Porter's five forces, and Suzlon's business strategies, global expansion, challenges, and recommendations to address issues like transitioning to a global supplier and managing working capital.
Suzlon Energy was founded in 1995 and is now the world's fifth largest wind turbine supplier. It has operations in 33 countries and over 13,000 employees. The global wind energy market is growing rapidly, with average annual growth of 8% predicted over the next five years. Suzlon is working to make its buildings and operations carbon neutral through renewable energy sources like solar, wind, and biomass. Its Suzlon One Earth project integrates these technologies to reduce energy consumption and emissions. Renewable energy will continue growing in importance to meet energy needs in a sustainable way.
Suzlon One Earth is the global headquarters of Suzlon Group located in Pune, India. It is one of the world's greenest campuses, receiving the highest ratings for both LEED and GRIHA green building standards. The campus runs entirely on renewable energy and incorporates various environmental and green practices such as water management, waste management, and nature-inspired design. Suzlon One Earth serves as a symbol for the coexistence of people and nature through sustainable practices.
Suzlon One Earth is a renewable energy campus that generates 7% of its energy needs on-site through wind turbines, solar panels, and photovoltaic cells, with the remaining 93% coming from off-site wind turbines. The building incorporates 154.83kW of renewable energy and uses an innovative HVAC system combining various efficient components to minimize energy consumption. Solar panels on the learning center atrium roof generate green power, while the orientation of blocks and use of daylighting and task lighting help control glare and energy use. Rainwater is harvested and greywater recycled on-site for flushing, cooling, and landscaping.
Suzlon aims to create market-defining products, enter new markets with new applications, implement robust back-end processes, and leverage its workforce competency. Known as One Earth, Suzlon has 15 manufacturing facilities across 4 countries and makes all key wind turbine components. With a global presence and focus on best practices, Suzlon combines global experience with local expertise. It has a culture based on commitment, sustainable development, and global assimilation. Suzlon is the 5th largest wind power group and has installed over 2,000 megawatts worldwide.
Suzlon Energy is the world's fifth largest wind turbine supplier with over 13,000 employees across 32 countries. Trinity Structural Towers, a subsidiary of Trinity Industries, filed a $500 million lawsuit against Suzlon for breach of contract. Suzlon had agreed to purchase $500 million worth of wind towers from Trinity between 2008-2013 but failed to fulfill its 2010-2011 purchase obligations. Trinity is seeking damages for the remaining $412 million in unfulfilled purchase commitments from Suzlon.
Suzlon One Earth Case Study by Ameya GumasteTechGigDotCom
This document provides a case study on the construction of Suzlon One Earth, a LEED Platinum and GRIHA Five Star certified campus in Pune, India that serves as the global headquarters for Suzlon Energy Ltd. and its group companies. It discusses Synefra's role in conceiving, developing, and managing the project to create one of the world's greenest campuses. The document outlines the project's goals of sustainability and creating an inspiring workplace, and summarizes Synefra's approaches to design management, construction management, and ensuring the project achieved its social and environmental objectives.
LEED India + Case Study : CII Sohrabji Godrej, ITC Green Centerbaburajiv2007
This document provides an overview of the Leadership in Energy and Environmental Design (LEED) rating system in India. It describes LEED India as an adaptation of the international LEED green building rating system administered locally by the Indian Green Building Council. The document outlines the main environmental categories of LEED certification including sustainable site selection, water efficiency, energy use, materials selection, and indoor environmental quality. It provides examples of LEED certified projects in India and describes various credits within each category that projects can pursue for certification.
Suzlon - Q2 FY 2010-11 Earnings PresentationSuzlon Group
Suzlon Energy Limited presented its Q2 FY 2010-11 earnings. Key highlights included growth in wind turbine installation volume, continued momentum in order inflow, and efforts to reduce debt and consolidate its holding in SE Forge. The outlook for H2 FY2011 was for robust long-term growth expectations in emerging markets, while developed markets are expected to remain stagnant. Detailed financial results for Q2 FY2011 showed revenues of INR 3,772 crores and positive earnings before interest and taxes of INR 11 crores.
Suzlon - Q4 FY 2010-11 Earnings PresentationSuzlon Group
Suzlon Energy Limited presented its Q4 FY 2010-11 earnings. Key highlights included:
- Volumes and EBIT continued to improve quarter-over-quarter.
- Suzlon had a strong order book of 4,639 MW backed by high order intake in India.
- Turbine availability was consistently above 97%.
- Outlook was positive with industry estimates projecting 15%+ annual growth in wind installations globally through 2015.
Suzlon - Q3 FY 2010‐11 Earnings PresentationSuzlon Group
Suzlon Energy Limited presented its Q3 FY 2010-11 earnings. Key highlights included volumes continuing to grow sequentially and year-over-year, a strong order book providing improved visibility for FY2012, and robust turbine fleet performance globally with availability over 97%. The outlook discussed improving regulatory environments and growth momentum continuing in developed and emerging markets as well as offshore wind.
Suzlon - H1 FY 12 Earnings PresentationSuzlon Group
This document is an earnings presentation by Suzlon Energy Limited for the first half of fiscal year 2012. It provides the following key information:
- Revenues grew 52% year-over-year for the first half, and the company is on track to meet full-year guidance.
- The order backlog stands at approximately $6.5 billion, 20% higher than the previous year.
- The sale of the company's stake in Hansen Transmissions generated $187 million in proceeds.
- REpower's order backlog is approximately $4.1 billion, with a balanced portfolio across strong markets and large utility customers.
Suzlon - Q4 FY16 Earnings Presentation Suzlon Group
This document is an earnings presentation by Suzlon Energy Limited for FY16. It begins with disclaimers noting that the presentation is for informational purposes only and does not constitute an offer or recommendation to purchase securities. It also disclaims liability for any inaccuracies or omissions.
The presentation then summarizes Suzlon's FY16 financial performance, highlighting increased volume, revenues, cash profits, debt reduction, and EBITDA compared to the previous year. It provides details on order book, working capital management, the service business, global installations, warranty provisions, and the company's entry into solar energy as a turnkey solutions provider.
This document is an earnings presentation by Suzlon Energy Limited for the first half of fiscal year 2016 (H1 FY16). The summary highlights key performance metrics for H1 FY16 including 431 MW in sales volume, Rs. 1,467 crore in gross profit, and Rs. 530 crore in EBITDA. It also provides an overview of Suzlon's order book, debt position, and the reinstatement of its investment grade credit rating, signaling a turnaround in its financial and operating performance.
Suzlon - Q3 9M FY 2015-2016 Earnings PresentationSuzlon Group
This document is Suzlon Energy Limited's 9M FY16 earnings presentation dated January 29, 2016. The presentation contains key highlights from Suzlon's financial performance in the first 9 months of FY16, including a 75% year-over-year increase in volume to 688 MW and a 14.3 times increase in normalized EBITDA to Rs. 846 crores. It also provides details on Suzlon's order book, debt and working capital position, and strategic focus on both wind and solar projects. The document is intended for information purposes only and contains various disclaimers around the accuracy of the information and risk factors involved.
1. Suzlon Energy presented its Q1 FY23-24 investor presentation which outlined India's growing renewable energy sector, Suzlon's strengths, and financial performance.
2. India aims to have 500 GW of non-fossil fuel capacity by 2030 to meet climate targets, driving significant growth in wind and solar. Suzlon is well-positioned to capture opportunities from the energy transition.
3. Suzlon has a global installed base of over 20 GW, a third of India's cumulative wind market share, and vertically integrated manufacturing across India with an annual capacity of over 3 GW.
Bharti Airtel merged with its wholly owned subsidiary Wireless Business Services Private Limited (WBSPL) in October 2013 by acquiring a 100% stake. The merger was aimed to expand Airtel's services and market share by gaining access to WBSPL's spectrum. Projected financial statements for WBSPL after the merger show a positive profit after tax starting in 2015. Key assumptions for the financial forecasts include 10% annual revenue growth and 5% annual cost of goods sold growth based on expected economic conditions. The total projected value of WBSPL after 5 years as a result of the merger is Rs. 9,182.38 crore.
The document is a presentation by Suzlon Energy Limited on its FY14 results. It discusses how the company has turned positive after 7 quarters with an EBITDA of Rs. 328 crores and EBIT of Rs. 116 crores in Q4 FY14, compared to losses in the previous year, driven by ramping up volumes, improved margins, and reduced costs. Key highlights included concluding FCCB negotiations, asset sales of over Rs. 700 crores, and completing its project transformation program, while its subsidiary Senvion continued its strong performance.
Broadwind Energy presented an investor presentation covering their industry and financial performance. Key highlights included a strong backlog of $228M at Q3 2014 with 2015 tower production capacity nearly sold out. Broadwind has diversified into industrial markets representing half of sales in 3-5 years. Challenges in Q3 2014 from a new tower design were addressed and financial results are expected to improve in 2014 over 2013, supported by solid order backlogs.
Suzlon Energy Q1 Financial year 2014-15 (FY15) resultsSuzlon Group
Suzlon Group, the world’s fifth largest* wind turbine maker, on Friday 25th July 2014, announced its results for the First Quarter of financial year 2014-15 (FY15). In Q1 FY15. Suzlon posted its 2nd Consecutive quarter of positive EBIDTA at consolidated level reaffirming its improved performance.
BKT - Investor Presentation - February 2021 (1).pdfSa4kEfx
- Balkrishna Industries Ltd presented an investor presentation for Q3 FY2021.
- Revenue for Q3 FY2021 was Rs. 1,497 Cr, up 27% YoY. EBITDA was Rs. 477 Cr with a margin of 31.9%. PAT for the quarter was Rs. 322 Cr, up 46% YoY.
- For 9M FY2021, sales volume was 159,130 MT, up 11% YoY. The company increased its FY2021 volume guidance to 215,000-220,000 MT.
- The Board approved a new capex plan of Rs. 1,900 Cr to expand tire capacity, increase carbon black capacity, and
- The document analyzes the power sectors in Kenya and Uganda, projecting strong growth in electricity demand driven by economic growth targets.
- Peak electricity demand in Kenya is projected to grow at an 11.3% CAGR to 3,163MW by 2020, while Uganda's is projected to grow 8.75% to 948MW.
- Significant potential exists for power sector companies as infrastructure developments, private sector participation, and a shift to renewable energy are expected to reduce costs and improve reliability of electricity supply.
The document provides information on rescuing Suzlon Energy Limited, an Indian wind turbine manufacturer that was facing financial distress. Key points:
1) Suzlon accumulated large amounts of high-cost debt for acquisitions that did not generate expected returns, and faced issues like customer payment defaults and supply chain problems that impacted cash flow.
2) A Corporate Debt Restructuring plan was approved involving debt reduction, interest rate cuts, additional working capital, and equity infusion to improve Suzlon's financial stability.
3) Recent positive developments in the wind energy industry, along with Suzlon's restructuring measures like cost cuts, asset sales, and subsidiaries reorganization, are expected to help the company achieve a
Suzlon Energy Limited is a leading global renewable energy solutions company headquartered in India. It has over 14,000 employees operating across 21 countries. Suzlon manufactures wind turbines and has manufacturing facilities across three continents. It is the third largest wind turbine manufacturer in the world and the market leader in Asia. Suzlon has seen strong revenue growth over the past few years but profitability has declined due to increased investment in expanding operations globally. The company is focused on reducing debt levels through liability management exercises.
- Jaguar Land Rover reported results for the second quarter of fiscal year 2024, with revenue of £6.9 billion, a pre-tax profit of £442 million, and wholesale volumes of 96,800 units.
- Key metrics like revenue, pre-tax profit and wholesale volumes saw significant year-over-year increases compared to the prior year period. Net debt was reduced to £2.249 billion.
- Profitability improved with EBIT margin reaching 7.3% due to higher wholesale volumes, better product mix and cost control measures, though production was impacted by planned shutdowns.
- The key Indian stock market indices (Sensex and Nifty) declined slightly by around 0.4% on weak global cues and selling pressure in metal, banking and oil & gas stocks.
- Some major companies like NTPC, Sterlite, UltraTech, JSW Steel and Bosch reported their quarterly earnings, with most meeting or beating estimates. However, UltraTech's profits declined significantly year-over-year due to higher costs.
- OVL, along with OIL and IOC, are expected to soon sign a contract to develop an offshore gas field in Iran valued at over $5 billion. The deal offers limited profit potential given it is a service contract.
Suzlon Energy Limited presented its Q1 FY16 earnings. Key highlights included:
- Highest quarterly sales volume of 205MW in India in last 3 years
- Normalized EBITDA margin of 15.3%, the highest in last 3 years
- Consolidated net debt reduced to Rs. 7,010 crs from Rs. 14,821 crs last quarter
The presentation discusses Suzlon's strategic focus on high growth, high volume and better margins in the Indian market. It also provides an overview of Suzlon's products, technology upgrades, order book status and the positive industry opportunities in the growing Indian renewable energy market.
Similar to Suzlon - Result Presentation – Q1 FY11 (20)
1. Rs. 1,800 crs Equity Infusion to accelerate growth
2. Suzlon delivers positive EBITDA for the 4th consecutive quarter
3. EBITDA Margin increases to 6.0% from (2.7%) YoY, on flat revenues of Rs. 4,954 crs
4. EBITDA increases to Rs. 295 crs from Rs. (137) crs YoY
5. Mr Tulsi Tanti, Chairman – Suzlon Group, said: “All the strategic initiatives are extremely crucial and will pave the way for our growth. These bold steps will strengthen our capital structure permanently, enabling significant deleveraging and liquidity to ramp up volumes rapidly. With our market leadership, technology strength, successful project execution and best in class service, Suzlon is best placed to capitalize on the opportunities offered by the renewable sector. We are convinced that the support from Dilipbhai Shanghvi and Family will help in creating a long term sustainable value for our stakeholders.
Suzlon posts positive EBITDA for 3rd consecutive quarterSuzlon Group
Suzlon Group, the world’s fifth largest* wind turbine manufacturer on Friday 31st
October 2014, announced its results for the Q2 FY15. Suzlon posted its 3rd consecutive quarter
of positive EBIDTA at consolidated level reaffirming its improved performance.
Tulsi Tanti's Speech at The BRICS 2014 Summit - Full SpeechSuzlon Group
The Complete Speech Presented by Mr. Tulsi Tanti, Suzlon Group on 'Economic Integration-Challenges for Sustainable Growth' at BRICS Business Forum July 14, 2014
Mr.Tulsi Tanti's speech at the BRICS 2014 Summit on ‘Economic Integration-Cha...Suzlon Group
Summary of the Speech Presented by Mr. Tulsi Tanti, Suzlon Group on ‘Economic Integration-Challenges for Sustainable Growth’ at BRICS Business Forum July 14, 2014
Full Press Release - Suzlon Bondholders Approve RestructuringSuzlon Group
Suzlon bondholders across all four series approve #FCCB restructuring proposal. Full press release.
Preview: Suzlon Group, the world’s fifth largest* wind turbine maker, today
announced that the holders of each series of its Existing Bonds (due in October 2012, July 2014
and April 2016) have approved the proposed restructuring of the Existing Bonds including the
terms and conditions of the new foreign currency convertible bonds. The company had earlier
announced receipt of approval from the Corporate Debt Restructuring Empowered Group and the
Reserve Bank of India for the restructuring.
Mr. Kirti Vagadia, Group Head Finance, Suzlon Group - Interview with ET Now, ...Suzlon Group
Suzlon reported strong financial results in the fourth quarter with its highest quarterly revenue in eight quarters and positive EBITDA and EBIT after seven quarters. Revenue for FY14 grew 8% to Rs. 20,000 crore. Suzlon plans to optimize its capital structure in FY15 by potentially listing and rebalancing debt through non-core asset sales and restructuring foreign currency convertible bonds. With a robust order backlog of Rs. 46,000 crore and expectations for the wind sector to grow 40% globally and locally, Suzlon is well positioned for continued growth.
UnityNet World Environment Day Abraham Project 2024 Press ReleaseLHelferty
June 12, 2024 UnityNet International (#UNI) World Environment Day Abraham Project 2024 Press Release from Markham / Mississauga, Ontario in the, Greater Tkaronto Bioregion, Canada in the North American Great Lakes Watersheds of North America (Turtle Island).
Bienestar Financiero al servicio de su jubilación anticipada
Pago de su 🏡
Estudio de sus hijos
Directamente a tu cuenta bancaria
Con Tesorería Auditoria Jurídica comercial
Administración de carteras
Apalancamiento Financiero
Desarrollo de tu marca personal
Acceso a Desarrollo de varias industrias
Cuentas bancarias
Estructuras Físicas en USA y en América Central
Avalado por Bolcomer
Puesto de Bolsa Comercial
Turismo
Y mucho más
Link de registro
https://business.myinfinity.global/maurod8/
https://therusnetwork.com/
Contacto:
https://goo.su/pzm1fja
2. Disclaimer
• This presentation and the accompanying slides (the “Presentation”), which have been prepared by Suzlon Energy Limited
(the “Company”), have been prepared solely for information purposes and do not constitute any offer, recommendation or
invitation to purchase or subscribe for any securities, and shall not form the basis or be relied on in connection with any
contract or binding commitment whatsoever. No offering of securities of the Company will be made except by means of a
statutory offering document containing detailed information about the Company.
• This Presentation has been prepared by the Company based on information and data which the Company considers reliable,
but the Company makes no representation or warranty, express or implied, whatsoever, and no reliance shall be placed on,
the truth, accuracy, completeness, fairness and reasonableness of the contents of this Presentation. This Presentation may
not be all inclusive and may not contain all of the information that you may consider material. Any liability in respect of the
contents of, or any omission from, this Presentation is expressly excluded.
• Certain matters discussed in this Presentation may contain statements regarding the Company’s market opportunity andy g g p y pp y
business prospects that are individually and collectively forward-looking statements. Such forward-looking statements are
not guarantees of future performance and are subject to known and unknown risks, uncertainties and assumptions that are
difficult to predict. These risks and uncertainties include, but are not limited to, the performance of the Indian economy and of
the economies of various international markets, the performance of the wind power industry in India and world-wide,
competition, the company’s ability to successfully implement its strategy, the Company’s future levels of growth and
expansion, technological implementation, changes and advancements, changes in revenue, income or cash flows, theexpansion, technological implementation, changes and advancements, changes in revenue, income or cash flows, the
Company’s market preferences and its exposure to market risks, as well as other risks. The Company’s actual results, levels
of activity, performance or achievements could differ materially and adversely from results expressed in or implied by this
Presentation. The Company assumes no obligation to update any forward-looking information contained in this Presentation.
Any forward-looking statements and projections made by third parties included in this Presentation are not adopted by the
Company and the Company is not responsible for such third party statements and projections.
• No offering of the Company’s securities will be registered under the U S Securities Act of 1933 as amended (the “Securities• No offering of the Company s securities will be registered under the U.S. Securities Act of 1933, as amended (the Securities
Act”). Accordingly, unless an exemption from registration under the Securities Act is available, the Company’s securities
may not be offered, sold, resold, delivered or distributed, directly or indirectly, into the United States or to, or for the account
or benefit of, any U.S. Person (as defined in regulation S under the Securities Act).
• The distribution of this document in certain jurisdictions may be restricted by law and persons into whose possession this
presentation comes should inform themselves about and observe any such restrictions.
2
3. Contents
Key highlights – Q1 FY2011
– Growth in volumes compared to Q1FY10
– Significant increase in Order flows in India
– Rights issue completed
Outlook for the FY2011
– Wind industry will continue to see robust growth in long term
G i I di k t ll f S l– Growing India market augurs well for Suzlon
– Suzlon working closely with REpower to lay stronger platform for future
Detailed financials – Q1 FY2011Detailed financials – Q1 FY2011
3
4. Financial Performance snapshot
Particulars Q1 FY2010-11
Unaudited
Q1 FY2009-10
Unaudited
FY2009-10
Audited (a)
FY2008-09
Audited
MW Volume (Suzlon Wind) 207 123 1,460 2,790
INR Cr.
( ) , ,
Suzlon Wind Business Revenue 1,441 1,164 9,635 15,897
REpower revenue 949 2,066 8,502 7,125
Consolidated Revenue 2,399 4,153 20,620 26,082
Consolidated EBITDA (546) 12 943 2,816
Consolidated PAT / (Loss) Pre
FX loss (666) (584) (983) 236FX loss (666) (584) (983) 236
Consolidated PAT / (Loss)
Post FX loss (912) (453) (983) 236
Suzlon Wind business: Performance highlightsg g
Sales of 207MW in Q1 FY11, higher by 68% over corresponding period of last year
Cost cutting initiatives and optimising the organisational structure to improve efficiencies
REpower: Performance highlights
Total operating performance of EUR 204 million for Q1 FY11, lower by 29% over Q1FY10
Orderbook of EUR 2.42 billion at end Q1 FY11, higher by 15% over last quarter
(a) Financial numbers for Hansen consolidated till November 2009 as subsidiary and subsequently as an associate
4
5. Order book status
Firm order book Announced Framework Contracts
Order book as on 11th August ‘10 is 225 MW framework agreement with EUFER
(JV b t ENEL G E d U i
Suzlon
1,458MW : Rs.7,938 crs (USD 1.7 bln*)
– India : 580MW
– International : 878MW
489 MW orders received in India v/s
(JV between ENEL Green Energy and Union
Fenosa) for Spain
49 MW received in Q1 FY10: a ten fold
increase
Order book as on 30th June 2010 is RWE Innogy for upto 250 units of 5MW /
REpower
Order book as on 30th June 2010 is
EUR 2.42 bln (USD 3.2 bln*)
gy p
6MW offshore turbines aggregating to 1,250
– 1,500 MW
• 295 MW of confirmed orders for 6M
announced in Jan’10
EDF Energies Nouvelles and RES Canada
for 954 MW onshore turbines
• Guaranteed minimum purchase of 748 MW
for deliveries between 2011 to 2015
5
for deliveries between 2011 to 2015
•Exchange rate as of 11th August ’10, 1 EUR= 1.3110 USD, 1 USD= 46.47 INR
Suzlon Group firm order book ~USD 4.9 billion
6. Significant progress made in resolving the balance
sheet issues
Rupee Loan refinancing of Rs.10,694 crs closed
Refinancing of Rupee facilities of approx Rs 6 587 crs and trade credit facilities
FY11
May 2010
Refinancing of Rupee facilities of approx. Rs. 6,587 crs and trade credit facilities
(non-fund based) of Rs. 4,037 crs which provides liquidity
Holiday of 2 years in principal repayments and effective removal / relaxation of
covenants across facilities
Removal of covenants and reduction in conversion price achieved
through third round of FCCB restructuring
The conversion price range is Rs 75 to Rs 100The conversion price range is Rs.75 to Rs.100
A successful right issue of Rs 1 188 crs
July 2010
A successful right issue of Rs.1,188 crs
Reduction of debt
Promoter holding after rights issue is 58.14%
6
7. Contents
Key highlights – Q1 FY2011
– Growth in volumes compared to Q1FY10
– Significant increase in Order flows in India
– Rights issue completed
Outlook for the FY2011
– Wind industry will continue to see robust growth in long term
G i I di k t ll f S l– Growing India market augurs well for Suzlon
– Suzlon working closely with REpower to lay stronger platform for future
Detailed financials – Q1 FY2011Detailed financials – Q1 FY2011
7
8. Wind industry has grown steeply over last decade and
will continue to outgrow other energy capacities
Cumalative (GW)
New Installations (GW)
126
100
120
140
800
900
1,000
Annual Installation (GW) Cum. Installation (GW)
Wind capacities
have grown at 29%
CAGR from 2000 to
38
72
60
80
100
300
400
500
600
700
29%
CAGR from 2000 to
2009, while total
energy capacities
have grown at ~3-
4%38
28
20
151289774
0
20
40
0
100
200
300+29%
2019e2014e2009200820072006200520042003200220012000
Despite the growth,
Wind share in total
energy generation
5,993
4,728
Bracket suggests share of wind energy in total
Global Installed Capacity (GW)Global Installed Capacity (GW) Global Energy Generation (TWh)Global Energy Generation (TWh)
Bracket suggests share of wind energy in total
World (ex wind)
26,247
20,716
has been minimal
This is set to change
in next 10 years
5,027
(84%)
4,728
4,568
(97%)
3,478
3,460
(99%)
Wind
24,046
(92%)
20,716
20,384
(98%)
15,153
15,116
(100%)
Share of Wind
should grow to 8.4%
in 2019 from 1.6%
2019 est
966
(16%)
2009
160
(3%)
2000
18
(1%)
( )
2019 est
2,201
(8%)
2009
332
(2%)
2000
37
(0%)
( )
in 2009
8
Source: BTM Consult ApS March 2010
9. Industry reports suggest decent growth in medium term
CAGR (10-14)CAGR (10-14)
Annual new wind installations (2010-2015)
Cumulative capacity (GW)
376251
70,000
80,000
+14% Rest of world
71,650
2,750
65 400
MW
35%
310 376 448202 251 22%
Actual Projected
160122
21,450
23,650
25,550
50,000
60,000
Asia Pacific
65,400
2,350
59,475
1,600
49,050
1,100
42 030
9%
18,025
20,500
21,250
9,257
15,613
17,900
19,350
30,000
40,000
Latin America
Europe
1 500
42,030
82538,103
28,190
227
319
12%
32%
9,179
10,738 13,305
16,000
,
0
10,000
20,000
X Axis
North America
Latin America
20,600
1,500
17,900
1,000
17,400
1,000
11,800
800
9,40010,993
440 600
9,130
397
32%
22%
Source: BTM Consult ApS March 2010
0
2014E2013E2012E2011E2010E
Wind power industry is expected to grow at a CAGR of 14% between 2010 and 2014 to reach a annual installations of 72 GW
2008 2009
9
10. Industry reports suggest decent growth in medium term
CAGR (10-14)CAGR (10-14)
GW
Annual new wind installations (2010-2015)
Annual capacity addition (GW)
59 65 7242 49
14%
3828
Rest of world 35%
Actual Projected
16 372
19,325
21,250
24,050
27,000
29,800
1 100
1,600
2,350
2,750
Emerging Markets
Latin America
Asia Pacific 9%
32%
25,55023,65021,45019,35017,90015,613
9,257
16,372
9,881
319
227
825
1,100
397 440 600 800 1 000 1 000 1 500
201320122011201020092008 2014
397 440 600 800 1,000 1,000 1,500
38 400
41,850Developed Markets
Europe 12%
17,400
17,90027,800 20,600
38,400
35,425
11,800
22,705
9,400
21,731
10,993
18,309
9 130
Source: BTM Consult ApS March 2010
North America 22%
10
20,500
2011
21,250
2012
18,025
2013 2014
16,000
2010
13,305
2009
10,738
2008
9,179
9,130
11. Short term environment challenging in few markets...
In US, low electricity demand and delays in securing firm PPAs continues
In Europe: In few markets like Spain, Greece etc
The sovereign crisis has affected the project financingg p j g
Fiscal deficit tightening has resulted in subsidy reduction
But offshore order intake is still high
However, emerging markets showing strengtho e e , e e g g a ets s o g st e gt
India accelerating on strong policy support at both State and Central government
levels
CERC issued guidelines for wind power tariff calculation and also for the REC trading mechanism
SERC are in process of revising the current wind power tariff as per the guidelines set by CERC
Forum of Regulators (FOR) Working Group on Policies on Renewables has recommended that State
Commission should specify a minimum of RPO of 5% by 2010 in line with National Action Plan on
Climate Change (NAPCC)
China continues to grow
But absence of concession projects may affect the local players
In Brazil, 2010 auction to be held in August
Industry may start showing signs of pick up by end of 2010
11
Industry may start showing signs of pick-up by end of 2010
Order re-schedulements possible; hence revenue for the FY 2010-11 to be heavily
back-ended
12. Emerging markets key to growth for Suzlon
1 32
India
Positive regulatory
changes
Brazil
Expected market size
China
Addressable market for
c a ges
Huge potential for the
industry to grow
pected a et s e
500-700 MW
Strong response
received to the last
international players
growing decently
Suzlon and REpower
Being a market
leader, Suzlon is well
placed to tap the
opportunity on the back
received to the last
auction
Being a market
leader Suzlon expects
increased their market
share
New product variant
opportunity on the back
of strong order book
and large project
development pipeline
leader, Suzlon expects
to benefit from the
macro factors
being launched to
compete with local
players
12
13. India: Swiftly evolving regulatory scenario fuels strong growth
1 June 2008 – National Action Plan on Climate Change
Suggests RPO at 5% in year 2010, increasing 1% every year for 10 years
( ) f f O
September 2009 - CERC guidelines on preferential tariff for renewable sector2
CERC announced new guidelines to provide uniformity in setting up pref tariffs across states
Penalties may be levied (as stated in EA 2003), if utilities are still falling short in RPOs
CERC announced new guidelines to provide uniformity in setting up pref. tariffs across states
CERC has fixed the Return on Equity for the RE projects:
Pre-tax 19% for first 10 years, Pre-tax 24% from 11th year onwards
CERC tariffs range from Rs.5.07 per KWh to Rs.3.38 per KWh
3 November 2009 – GBI guidelines
GBI incentive of Rs0.50 for per unit of renewable generation over and above PPA rates
Promoting investments by IPPs as it is an alternative to accelerated depreciationg y p
4 January 2010 – REC framework
Separating the renewable attribute from generation
Will open up merchant market/ trading and subsequent upsides to renewable sector
To remove geographic constraints and ensure development at large scale
4
13
14. Industry experts suggest a spurt in the installations…
Analysts expect the market to grow to 2000-2,200 MW this
year and to 2 600-3 000 MW next year underpinned byActual Projected
ObservationsWind installations in India
2100
2600
year and to 2,600 3,000 MW next year underpinned by
conducive regulatory environment and general buoyancy
in the Indian economy
Substantial renewable energy obligations coupled with
Actual j
1585
1848
1565
2100 Substantial renewable energy obligations coupled with
revised tariffs, a new REC framework and generation
based incentives to encourage new installations & better
wind utilization
Generation Based Incentives will help level playing field forGeneration Based Incentives will help level playing field for
IPPs in India
National RPO will drive renewable energy demand in all
Indian states
New CERC tariff regulations and REC framework will enable
FY08 FY09 FY10 FY11 FY12
New CERC tariff regulations and REC framework will enable
wind rich states to aid in supplying RPOs of resource
challenged states
REC mechanism (floor price Rs 1.5/Kwh and cap price Rs
3.9/Kwh
FY08 FY09 FY10 FY11 FY12
14
There is a general shift in the market from investments led
by retail segment to investment led by IPPsSource: Windpower India website
15. Exuberance in India reflects in our order book as well
580
India Order book trend at end of Q1 Generally, first quarter in India remains
weak, however, we have seen strong
interest in India in Q1 of current
267
66
interest in India in Q1 of current
year, indicating a stronger full year ahead
Suzlon is well placed to cater to the
growing market due to its66
Q1 FY 09 Q1 FY 10 Q1 FY 11
unique business model of concept to
commissioning,
strong EPC execution capabilities and
Breakup of sale volumes of Suzlon
access to large wind sites
Booked 489MW in Q1 FY11 in India
Recent orders from some reputed clients
like Baidyanath Group Poonawalla
73%
53%
Breakup of sale volumes of Suzlon
58%
like Baidyanath Group, Poonawalla
Group, Malpani Group
Contribution of domestic volumes in total
volumes likely to further go up in current
42%
27%
47%
FY08 FY09 FY10
year, which augurs well for the margins
15
FY08 FY09 FY10
International Domestic
16. Other emerging markets: China
Removes local content requirement for WTG
manufactures
Amends RE law
1.8
13.8
China Market size (GW)
International Cos
Amends RE law
Enables more central government supervision of grid
companies to purchase renewable power and
imposes fines on grid companies for non-compliance
Local Cos
A target of 15% of its electricity from renewable
energy by year 2020
China to tackle the oversupply issue in the wind
equipment manufacturing industry by setting higher
6.2
12 0equipment manufacturing industry by setting higher
barriers for any entrants
Removal of import duties and VAT on wind and
hydro equipments
3.3
12.0
1.4
hydro equipments
Suzlon is offering a price competitive product on
S88 platform to compete with local players
1.4 4.8
1.8
16
20082007 2009
Source: Industry reports
17. Other emerging markets: Brazil
Market leader in Brazil
50% of the country’s wind installations
The market is expected to grow from ~700 MW to
6GW of cumulative installations by 2019
Favorable industry dynamics What it means for Suzlon
supplied by Suzlon
300MW – 400MW expected from 2009
auctions
E t t b fit f th iti
6GW of cumulative installations by 2019
Currently, half of the installations in Brazil are supplied by
Suzlon
Brazil signed the Copenhagen Accord and passed
Expects to benefit from the positive macro
factors
Strong order pipeline
legislation in January 2010 to reduce carbon emissions
by 39 % by 2020
First auction results for 1.8GW delivered in Dec. 2009
Wi d I t ll ti 30 J 2010Over 11GW of wind power projects submitted applications
71 wind power projects received 20 year power purchase
contracts with an avg price of R$148 per MWh with a
contract value of ~ R$19.6bn
Wind Installations as on 30 June 2010
Suzlon WTGs
382
Two more wind tenders expected to be announced in
August 2010, resulting in an additional 3 GW of
capacity by September 2013
Financing available for wind power plants at s b idi d
51% 49%Others
398
Financing available for wind power plants at subsidized
interest rates from local banks
17Source: MAKE Consulting report
18. Several efforts underway to further strengthen market
position of the Group
SuzlonSuzlon REpowerREpower
Expand market footprint into emerging
markets backed by a large scale sales and
Reduce COGS by addressing a combination
of cost levers
service organisation
Develop new product to increase the size of
addressable market
Leverage growth in offshore and 3MW
space, while building on the strength of 2MW
fleet
Improve quality and availability of existing
products
Expand market footprint globally leveraging
upon Suzlon’s capabilities
Create a win-win situation for the Group
19. Group new product / variants
Low wind speed (IEC Class-III) sites presents significant opportunity
New offerings from Suzlon Group are designed with large rotor
diameters, increased hub heights, improved aerodynamic efficiency, and grid-
friendly characteristics for delivering higher project performance:
Suzlon S97: The S97 – 2.1 MW platform, with a 97 meter rotor diameter, is
specially designed for lower wind speed (Class-III) sites
REpower 3.XM: REpower launched product variants to its 3.XM platform – thep p p p
3.2M with a 114 meter rotor diameter for Class-III wind sites, and the 3.4M with a
104 meter rotor diameter for Class-II wind sites
19
20. Suzlon Group has all the relevant competencies
Suzlon strengths REpower strengths Group Positioning
Asia, US, ANZ, Global player
Market coverage
Customer
Geographic
Brazil
Developing markets
Strong customer
centric approach
Europe, US, Canada
Developed markets
Present across
geographies, with flexible
business model
Strong Customer Focus
Product footprint Onshore <2.5MW
Onshore 2MW+
Offshore
Comprehensive product
coverage
Product
competitiveness
Cost competitive
Strong service
focus
High energy yield
Reliability
Reliable product
Competitive price
Strong Service
Global
Supply chain
Global, Low cost
Vertical integration
Focus on vendor
quality management
Global
Cost Leadership
European Quality at Asian
price
Along with REpower, Suzlon has presence across all geographies and product
range, with a potential to improve margins
20
21. Contents
Key highlights – Q1 FY2011
– Growth in volumes compared to Q1FY10
– Significant increase in Order flows in India
– Rights issue completed
Outlook for the FY2011
– Wind industry will continue to see robust growth in long term
G i I di k t ll f S l– Growing India market augurs well for Suzlon
– Suzlon working closely with REpower to lay stronger platform for future
Detailed financials – Q1 FY2011Detailed financials – Q1 FY2011
21
22. Consolidated financial results
(Suzlon Wind + SE Forge + Hansen + REpower*)
Particulars Q1 FY11 Unaudited Q1 FY10 Unaudited FY10 Audited (a)
Sales 2,399 4,153 20,620
R M t i l t 1 777 2 911 13 628
INR crs.
Raw Material cost 1,777 2,911 13,628
Gross Profit 622 1,242 6,992
Gross Profit margin 26% 30% 34%
Manpower cost 398 592 2,145
Operating Income 6 19 160
Other operating expenses 630 787 4,106
Forex loss / (Gain) 146 (132) (43)
EBITDA (546) 12 943
EBITDA margin (23%) 0% 4.57%
Interest 237 273 1,081
Interest on acquisition loans 24 40 114
Exceptional Items 37 18 (212)
Depreciation 126 163 663
Other Non-operating Income 24 21 69
Taxes (24) 3 356
Share in associate’s PAT (7) 0 16
Share of profit of minority 18 10 (9)
PAT incl. FX effect (912) (453) (983)
(a) Financial numbers for Hansen consolidated till November 2009 as subsidiary and subsequently as an associate
22
25. Consolidated financial results:
Year-on-year
Particulars
FY10 (unaudited) (a) FY09 (unaudited) (b)
Suzlon SE Forge Hansen REpower Suzlon SE Forge Hansen REpower
Sales MW 1,460 2,790
INR crs.
Sales 9,635 104 2,656 8,502 15,897 17 3,994 7,125
Raw Material cost 6,391 60 1,491 6,010 10,481 4 1,939 5,288
Gross Profit 3,244 44 1,166 2,492 5,416 13 2,054 1,837
Gross Profit margin 33.67% 42.66% 43.88% 29.31% 34.07% 79.51% 51.44% 25.78%
M t 911 21 516 697 897 8 770 491Manpower cost 911 21 516 697 897 8 770 491
Operating Income 43 1 9 107 15 1 74 87
Other operating expenses 2,391 49 464 1,159 2,946 35 591 868
EBIDTA (15) (25) 194 742 1,589 (29) 768 565
EBIDTA margin (0 16%) (23 57%) 7 32% 8 73% 9 99% (170 84%) 19 22% 7 93%EBIDTA margin (0.16%) (23.57%) 7.32% 8.73% 9.99% (170.84%) 19.22% 7.93%
Interest 858 62 51 125 568 12 70 40
Interest on acquisition -- -- 47 67 -- -- 119 91
Exceptional Items (212) -- -- -- 896 -- -- --
Depreciation 312 42 181 128 260 18 205 91p
Other Non-operating Income 39 3 20 23 246 6 63 27
Taxes 236 (2) 1 121 3 2 119 164
Share in associate’s PAT -- -- 16 -- -- -- -- 2
Share of profit of minority (2) 21 7 (35) -- 8 (111) (91)
PAT incl. FCCB FX effect (1,173) (103) (43) 289 107 (47) 206 117
PAT excl. FCCB FX effect (1,133) (103) (43) 289 239 (47) 206 117
(a) Financial numbers for Hansen consolidated till November 2009 as subsidiary and subsequently as an associate
(b) REpower results were consolidated from June 2008 in FY09
25
26. Suzlon Group order book
Region
Orders as on
26/05/10
New
Orders
Sales in
Q1 FY11
Orders as on
11/08/10
Sales in
FY10
Sales in FY09 Sales in FY08
India 230 489 139 580 688 749 975
USA 273 -- 25 248 410 989 593
China 404 51 39 416 182 249 134
ANZ 53 -- -- 53 128 430 143
Europe 166 -- 4 162 53 166 298Europe 166 4 162 53 166 298
S. America -- -- -- -- -- 197 168
Others -- -- -- -- -- 10 --
Total * 1,126 MW 540 MW 207 MW 1,458 MW 1,460 MW 2,790 MW 2,311 MW
Total value Rs.6,174 crs Rs. 7,938 crs Rs.9,635 crs Rs.15,897 crs Rs.11,467 crs
USD 1.3bln USD 1.7bln*
REpower order book as on 30th June 2010 USD 3.2 bln*
Group order book USD 4.9 bln*
Sales of period July 2010 to date not deducted from orders as on 11th August 2010
Suzlon Group order book ~USD 4.9 billion
26
•Exchange rate as of 11th August ’10, 1 EUR= 1.3110 USD, 1 USD= 46.47 INR
27. Consolidated: NOWC reduction in progress
Net Operating Working Capital in Rs Crores As on 30th Jun ’10 As on 31st Mar ‘10 As on 31st Dec ’09
INR Cr
Consolidated:
Consistent reduction in NOWC continues, ~Rs.950 crs reduced in Q1
Net Operating Working Capital in Rs. Crores
(Unaudited)
As on 30th Jun 10 As on 31st Mar 10 As on 31st Dec. 09
Inventories 5,890 5,994 5,796
Receivables 4,428 6,192 5,524
Advances * 1,771 1,684 1,884
Total (A) 12,089 13,870 13,204
Prepayment from customers (including dues to
customers) 3,508 3,219 2,745
Trade Payables 2,833 3,942 3,534
Total (B) 6,341 7,161 6,279
NOWC (A-B) 5,748 6,709 6,925
* Advances do not include deposits or advance Income Tax, but include advances to suppliers, ICD, VAT and other current assets
27
28. Suzlon Wind: NOWC reduction in progress
Suzlon Wind Business:
Consistent reduction in NOWC continues, after ~Rs.1,000 crs last year, in the current
quarter the reduction is Rs.259 crs
Inventories level has stabilized
Collections from receivables improving
Significant and consistent reduction in payables
Net Operating Working Capital in Rs.
C (U dit d)
As on 30th
J ’10
As on 31st
M ‘10
As on 31st
D ’09
As on 30th
S t ‘09
As on 30th
J ‘09
INR Cr
Crores (Unaudited) Jun ’10 Mar ‘10 Dec. ’09 Sept. ‘09 Jun ‘09
Inventories 2,910 2,877 3,444 3,746 3,945
Receivables 3,798 4,726 4,255 4,157 4,552
Advances * 1,209 1,187 1,337 1,285 1,327, , , , ,
Total (A) 7,917 8,789 9,036 9,188 9,824
Prepayment from customers
(including dues to customers) 1,002 696 1,195 1,085 941
Trade Payables 2 071 2 990 2 662 2 740 3 372Trade Payables 2,071 2,990 2,662 2,740 3,372
Total (B) 3,073 3,686 3,857 3,825 4,314
NOWC (A-B) 4,844 5,103 5,179 5,363 5,511
* Advances do not include deposits or advance Income Tax, but include advances to suppliers, ICD, VAT and other current assets
28
30. Group Financial Leverage
Particulars As at 30th June 2009 As at 31st March
2010
As at 31st Dec. 2009 As at 30th Sept.
2009
As at 30th June 2009
INR crs.
SEL
Wind (a)
Consol.
Group (a)
SEL
Wind (a)
Consol.
Group (a)
SEL
Wind (a)
Consol.
Group (a)
SEL
Wind (a)
Consol.
Group (a)
SEL
Wind (a)
Consol.
Group (a)
Gross External Debt (A) 10,853 11,812 10,519 11,493 10,474 11,413 12,302 15,366 12,523 15,425
Loans from Promoters (B) 1,175 1,175 1,175 1,175 1,175 1,175 1,175 1,175 562 562
Cash (C) 1,258 2,866 1,541 2,904 1,041 2,100 952 2,780 862 2,157
Net Debt (A+B-C) 10,770 10,121 10,153 9,764 10,608 10,488 12,525 13,762 12,223 13,830
Net External Debt (A-C) 9,595 8,946 8,978 8,589 9,433 9,313 11,350 12,586 11,661 13,268
30
(a) Unaudited
31. Suzlon Wind: Financial leverage (a)
Debt type Balance as on
30th June 2010
Balance as on
31st March 2010
Balance as on
31st Dec. 2009
Balance as on
30th Sept. 2009
Balance as on
30th June 2009
Acquisition loans 2 155 2 083 2 159 3 097 3 253
INR Cr.
Acquisition loans 2,155 2,083 2,159 3,097 3,253
FCCBs 2,225 2,151 2,229 2,304 1,864
W.Cap, Capex and other loans 6,473 6,284 6,085 6,901 7,405
Gross external debt (A) 10,853 10,519 10,474 12,302 12,523
Loans from promoter group (B) 1,175* 1,175 1,175 1,175 562
Cash (C) 1,258 1,541 1,041 952 862
Net Debt (A+B-C) 10,770 10,153 10,608 12,525 12,223
Net external debt (A-C) 9,595 8,978 9,433 11,350 11,661Net external debt (A C) 9,595 8,978 9,433 11,350 11,661
* - Post completion of Rights Issue promoter loans have been converted into equity
31
(a) Unaudited
32. FCCBs: Post restructuring
Key Terms:
FCCBs
Outstanding amount
(USD mln)
Conversion
price (Rs.)
Maturity date Coupon rate
Redemption
Premium
June 2012 - Old 211.3 97.26 June 2012 0% 145.23%
October 2012 - Old 121.4 97.26 October 2012 0% 144.88%
June 2012 - Exchange 35.6 76.68 June 2012 7.5% 150.24%
October 2012 – Exchange 20 8 76 68 October 2012 7 5% 157 72%
Total number of shares to be issued on conversion: 237 152 577
October 2012 Exchange 20.8 76.68 October 2012 7.5% 157.72%
July 2014 – New Issuance 90.0 90.38 July 2014 0% 134.20%
Total number of shares to be issued on conversion: 237,152,577
No financial covenants till maturity
32
33. REpower Net Profit Reconciliation
Particulars EURO m INR crs
Profit / (loss) as per REpower books 1.8 10
Less: Policy alignment impact 5.0 29
Profit / (loss) before translation loss (3.2) (19)
Less: FX loss on translation of COGS 17.2 100
Profit / (loss) as per Suzlon Books (20.4) (119)
33
(a) Unaudited