The document outlines the research process, including types of research (qualitative and quantitative) and the steps involved in designing and conducting research. It discusses criteria for selecting research topics, prioritization of research proposals, and various study designs, emphasizing the importance of operational definitions and sample selection. Additionally, it highlights different sampling methods and their advantages and disadvantages, along with the significance of differentiating between dependent and independent variables in health research.


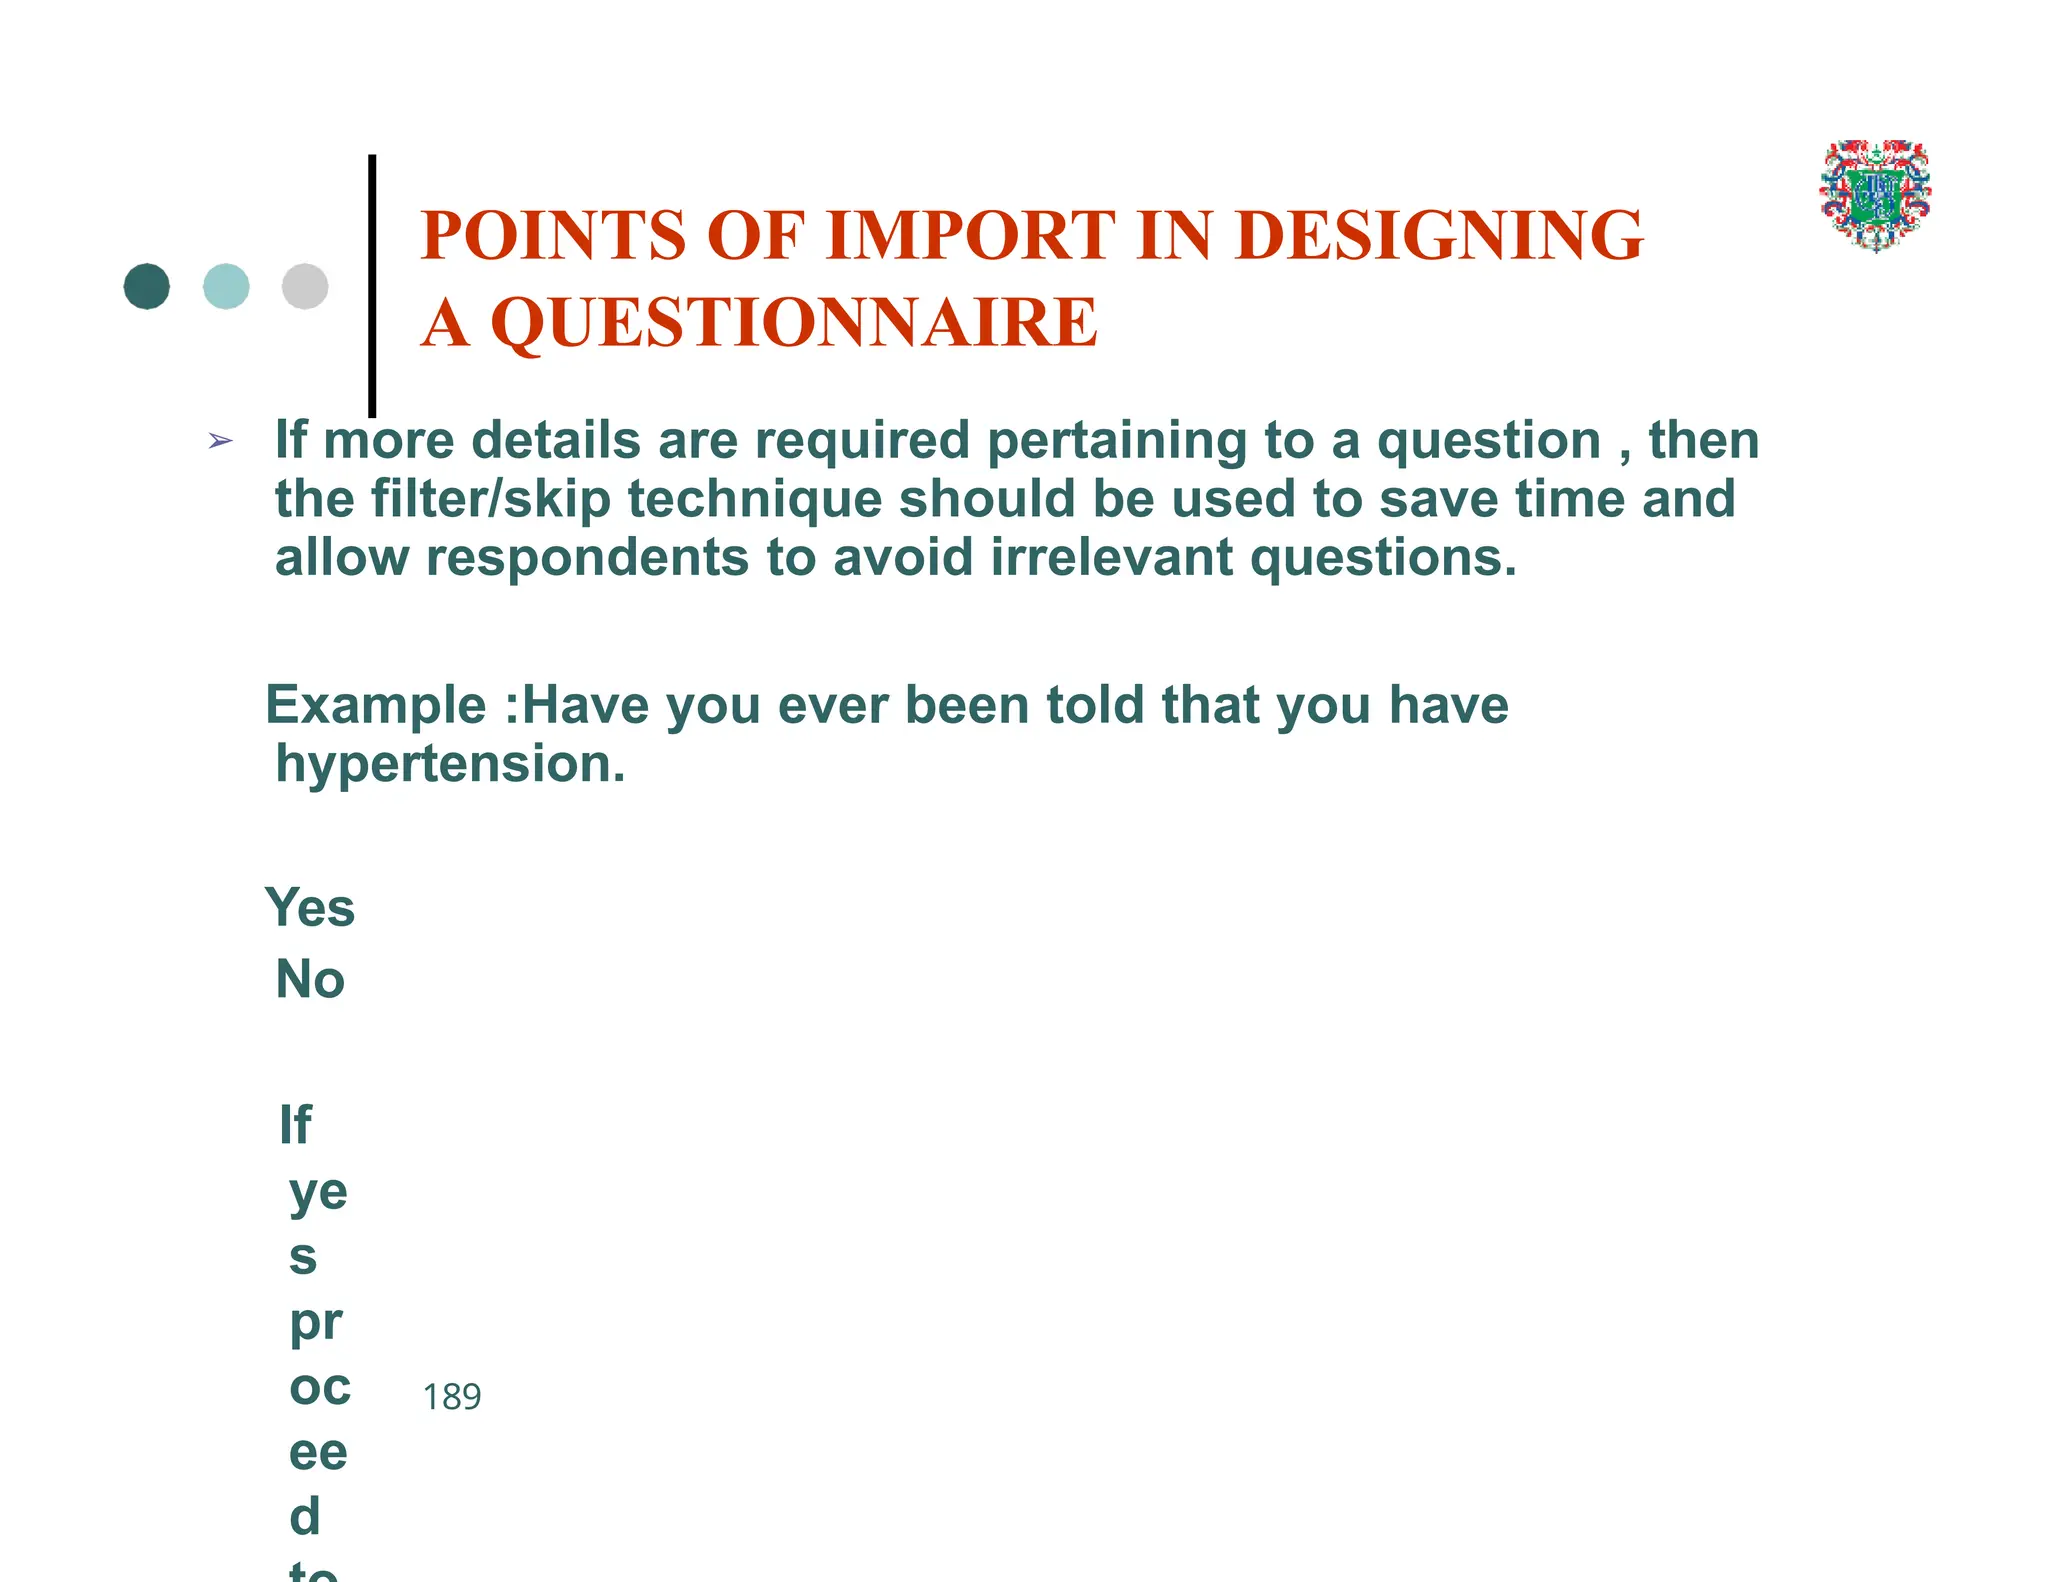
![POINTS OF IMPORT IN DESIGNING A
QUESTIONNAIRE
188
➢ Questions should be close ended, possible answers to close
ended questions should be lined vertically, preceded
by boxes, brackets or numbers
Example
How many different medicines do you take daily (check one)
[ ]
None [ ]
1-
2
[ ] 3-
4
[ ] 5-
6](https://image.slidesharecdn.com/researchpptnew-241123132755-92673709/75/research-PPT-NEW-pptx-henananannanannanann-188-2048.jpg)


![Dissertation Writing
Detailed discourse on a subject especially
submitted for a higher degree in a
University [Oxford]
213](https://image.slidesharecdn.com/researchpptnew-241123132755-92673709/75/research-PPT-NEW-pptx-henananannanannanann-205-2048.jpg)


![Dissertation
240
O Borkowski MM. Infant sleep and
feeding: a telephone survey of Hispanic
Americans [dissertation]. Mount
Pleasant : Central Michigan University;
2002.](https://image.slidesharecdn.com/researchpptnew-241123132755-92673709/75/research-PPT-NEW-pptx-henananannanannanann-240-2048.jpg)
![Journal article on the Internet
241
O Abood S. Quality improvement initiative
in nursing homes: the ANA acts in an
advisory role. Am J Nurs [serial on the
Internet].
2002 Jun [cited 2002 Aug 12];102(6):[about
3 p.]. Available from:
http://www.nursingworld.org/AJN/2002/j
une/
Wawatch.htm](https://image.slidesharecdn.com/researchpptnew-241123132755-92673709/75/research-PPT-NEW-pptx-henananannanannanann-241-2048.jpg)


