More Related Content
Similar to Rental-Results_141208
Similar to Rental-Results_141208 (20)
Rental-Results_141208
- 1. 209 Day 0 YR 1 YR 2 YR 3 YR 4 YR 5
(10,204,048) (16,505,233) (2,106,937) ‐ ‐ ‐
22,590,349$
6,225,869 ‐ 2,621,988 3,746,688 3,821,622 3,898,054 3,976,015
28,816,218 ‐ (950,431) (1,436,277) (1,465,003) (1,494,303) (1,524,189)
‐ 1,671,557 2,310,411 2,356,619 2,403,752 2,451,827
3,746,688
(1,436,277) 36,576,000 38,770,560 41,096,794 43,562,601
2,310,411 ‐ ‐ ‐ (1,306,878)
8.02% ‐ ‐ ‐ 42,255,723
32,297,900 (10,204,048) (14,833,676) 203,474 2,356,619 2,403,752 44,707,550
89.22%
36,576,000 17.49%
78.78%
7,759,782$
ID Folio # (Redacted) City Purchase Date
Purchase
Price
Capital
Expenses for
Stabilization
Total Capital
Cost Rent (mo)
Vac & Exp.
(mo) Cap Rate
Market
Value @
Purchase
Market
Value
(10/1/2014)
Owner's
Equity
(10/1/2014)
H12‐0001 49410214#### North Lauderdale 10/2/2012 90,600 26,655 117,255 1,550 493 10.81% 134,000 172,000 54,745
H12‐0002 51410328#### Hollywood 10/3/2012 107,200 30,573 137,773 1,450 430 8.88% 160,000 205,000 67,227
H12‐0003 50421809#### Fort Lauderdale 10/3/2012 101,300 32,023 133,323 1,650 556 9.84% 160,000 205,000 71,677
H12‐0004 51412202#### Miramar 10/3/2012 100,100 32,745 132,845 1,500 442 9.56% 150,000 192,000 59,155
H12‐0005 48421404#### Deerfield Beach 10/3/2012 83,200 39,236 122,436 1,600 516 10.62% 130,000 167,000 44,564
H12‐0006 51411117#### Hollywood 10/9/2012 45,100 50,081 95,181 1,250 413 10.55% 104,000 133,000 37,819
H12‐0007 51411408#### Hollywood 10/10/2012 116,600 36,120 152,720 1,650 594 8.30% 170,000 217,000 64,280
H12‐0008 49413006#### Sunrise 10/16/2012 141,300 19,442 160,742 1,650 556 8.16% 180,000 229,000 68,258
H12‐0009 51412205#### Miramar 10/17/2012 87,600 34,667 122,267 1,500 406 10.74% 120,000 153,000 30,733
H12‐0010 51412606#### Miramar 10/18/2012 69,900 26,943 96,843 1,200 434 9.49% 105,000 134,000 37,157
H12‐0011 51410211#### Hollywood 10/18/2012 99,000 27,517 126,517 1,500 513 9.36% 145,000 185,000 58,483
H12‐0012 48422420#### Pompano 10/24/2012 78,100 20,811 98,911 1,275 423 10.33% 115,000 146,000 47,089
H12‐0013 51410201#### Hollywood 10/30/2012 99,100 48,905 148,005 1,600 590 8.19% 160,000 202,000 53,995
H12‐0014 49412215#### Lauderhill 10/30/2012 144,300 36,801 181,101 1,750 639 7.36% 196,000 248,000 66,899
H12‐0015 51411117#### Hollywood 10/30/2012 82,700 24,613 107,313 1,300 548 8.41% 128,000 162,000 54,687
H12‐0016 49413506#### Lauderhill 10/30/2012 94,900 48,151 143,051 1,500 513 8.28% 150,000 190,000 46,949
H12‐0017 50421718#### Fort Lauderdale 10/30/2012 85,100 28,757 113,857 1,500 442 11.15% 140,000 177,000 63,143
H12‐0018 49412601#### Sunrise 11/6/2012 81,200 32,655 113,855 1,400 490 9.59% 135,000 170,000 56,145
H12‐0019 48422408#### Pompano 11/6/2012 79,100 21,395 100,495 1,350 475 10.44% 125,000 158,000 57,505
H12‐0020 48422413#### Pompano 11/7/2012 75,100 40,337 115,437 1,300 440 8.94% 120,000 151,000 35,563
H12‐0021 50422905#### Dania 11/7/2012 69,100 25,479 94,579 1,500 419 13.72% 125,000 157,000 62,421
Capital Cost to Value 10/1/2014
Owner's Equity (10/1/2014)
DATA
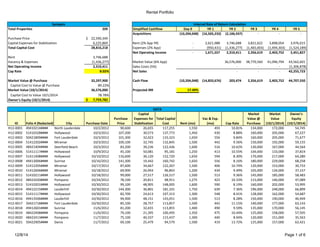
Internal Rate of Return Calculation
Simplified Cashflow
Acquisitions
Rent (2% App YR)
Expenses (2% App)
Net Operating Income
Market Value (6% App)
Total Properties
Purchase Price
Capital Expenses for Stabilization
Total Capital Cost
Synopsis
Sales Costs (5%)
Net Sales
Cash Flow
Projected IRR
Rent
Vacancy & Expenses
Net Operating Income
Cap Rate
Market Value @ Purchase
Capital Cost to Value @ Purchase
Market Value (10/1/2014)
Rental Portfolio
12/8/14 Page 1 of 6
- 2. ID Folio # (Redacted) City Purchase Date
Purchase
Price
Capital
Expenses for
Stabilization
Total Capital
Cost Rent (mo)
Vac & Exp.
(mo) Cap Rate
Market
Value @
Purchase
Market
Value
(10/1/2014)
Owner's
Equity
(10/1/2014)
H12‐0022 51420905#### Hollywood 11/7/2012 67,500 30,293 97,793 1,150 355 9.76% 115,000 145,000 47,207
H12‐0023 49420619#### Margate 11/13/2012 135,100 28,676 163,776 1,550 507 7.64% 185,000 232,000 68,224
H12‐0024 49412016#### Sunrise 11/13/2012 127,300 30,551 157,851 1,799 585 9.23% 200,000 251,000 93,149
H12‐0025 50410103#### Plantation 11/13/2012 135,100 49,471 184,571 1,700 584 7.25% 205,000 257,000 72,430
H12‐0026 51410211#### Hollywood 11/13/2012 111,900 26,060 137,960 1,700 466 10.74% 155,000 195,000 57,040
H12‐0027 50410103#### Plantation 11/13/2012 113,100 26,550 139,650 1,650 605 8.98% 165,000 207,000 67,350
H12‐0028 48423430#### Pompano 11/15/2012 100,100 19,273 119,373 1,400 380 10.25% 130,000 163,000 43,627
H12‐0029 48413615#### Margate 11/21/2012 75,000 32,706 107,706 1,600 527 11.95% 140,000 175,000 67,294
H12‐0030 51412707#### Miramar 11/27/2012 105,100 48,241 153,341 1,500 454 8.19% 150,000 187,000 33,659
H12‐0031 51412307#### Miramar 11/27/2012 68,200 26,695 94,895 1,200 405 10.06% 105,000 131,000 36,105
H12‐0032 49410111#### N Lauderdale 11/27/2012 110,100 37,078 147,178 1,600 631 7.90% 155,000 193,000 45,822
H12‐0033 51411208#### Hollywood 11/28/2012 72,100 18,364 90,464 1,100 428 8.91% 110,000 137,000 46,536
H12‐0034 49411506#### Lauderhill 11/28/2012 141,300 26,147 167,447 2,000 753 8.93% 210,000 262,000 94,553
H12‐0035 48412503#### Margate 11/28/2012 118,200 35,108 153,308 1,600 575 8.02% 160,000 199,000 45,692
H12‐0036 51411614#### Pembroke Pines 11/28/2012 143,500 29,319 172,819 1,750 547 8.35% 200,000 249,000 76,181
H12‐0037 50411315#### Fort Lauderdale 11/29/2012 74,200 32,334 106,534 1,300 474 9.31% 115,000 143,000 36,466
H12‐0038 49422215#### Oakland Park 12/4/2012 90,800 16,478 107,278 1,550 478 12.00% 135,000 168,000 60,722
H12‐0039 48422418#### Pompano 12/4/2012 72,400 24,298 96,698 1,150 335 10.11% 105,000 130,000 33,302
H12‐0040 48412503#### Margate 12/10/2012 83,000 18,943 101,943 1,250 444 9.49% 110,000 136,000 34,057
H12‐0041 49413013#### Sunrise 12/11/2012 160,100 32,660 192,760 1,850 706 7.12% 205,000 254,000 61,240
H12‐0042 48423615#### Pompano 12/11/2012 115,100 25,798 140,898 1,400 468 7.94% 150,000 186,000 45,102
H12‐0043 49401303#### Sunrise 12/11/2012 155,300 21,366 176,666 1,725 565 7.88% 195,000 241,000 64,334
H12‐0044 49413505#### Sunrise 12/11/2012 90,100 28,598 118,698 1,400 405 10.06% 140,000 173,000 54,302
H12‐0045 49402407#### Sunrise 12/12/2012 135,200 28,811 164,011 1,650 511 8.33% 170,000 210,000 45,989
H12‐0046 49410308#### Tamarac 12/13/2012 88,600 46,882 135,482 1,400 528 7.72% 125,000 155,000 19,518
H12‐0047 49412409#### Lauderlake Lakes 12/13/2012 87,900 31,045 118,945 1,450 570 8.87% 130,000 161,000 42,055
H12‐0048 49413512#### Sunrise 12/18/2012 92,000 32,262 124,262 1,500 542 9.25% 150,000 185,000 60,738
H12‐0049 49422103#### Oakland Park 1/3/2013 120,500 31,469 151,969 1,500 520 7.74% 150,000 184,000 32,031
H12‐0050 49422106#### Oakland Park 1/3/2013 114,100 30,501 144,601 1,600 487 9.24% 150,000 184,000 39,399
H12‐0051 51423007#### West Park 1/4/2013 89,000 6,095 95,095 1,200 448 9.49% 105,000 128,000 32,905
H12‐0052 49412602#### Sunrise 1/8/2013 92,100 40,365 132,465 1,650 561 9.86% 175,000 214,000 81,535
H12‐0053 49411211#### North Lauderdale 1/9/2013 80,100 36,242 116,342 1,350 465 9.13% 115,000 140,000 23,658
H12‐0054 49421505#### Oakland Park 1/9/2013 70,200 32,847 103,047 1,350 507 9.81% 115,000 140,000 36,953
H12‐0055 49411202#### North Lauderdale 1/10/2013 84,200 33,516 117,716 1,450 475 9.94% 130,000 159,000 41,284
H12‐0056 51412205#### Miramar 1/16/2013 80,600 26,882 107,482 1,250 363 9.90% 110,000 134,000 26,518
H12‐0057 51410308#### Hollywood 1/16/2013 103,200 38,296 141,496 1,500 540 8.14% 150,000 182,000 40,504
H12‐0058 51412201#### Miramar 1/16/2013 98,200 35,468 133,668 1,500 531 8.70% 145,000 176,000 42,332
H12‐0059 49410108#### North Lauderdale 1/16/2013 108,000 23,185 131,185 1,400 519 8.06% 140,000 170,000 38,816
H12‐0060 51411103#### Hollywood 1/16/2013 96,600 40,896 137,496 1,550 551 8.72% 150,000 182,000 44,504
DATA (Con't)
Rental Portfolio
12/8/14 Page 2 of 6
- 3. ID Folio # (Redacted) City Purchase Date
Purchase
Price
Capital
Expenses for
Stabilization
Total Capital
Cost Rent (mo)
Vac & Exp.
(mo) Cap Rate
Market
Value @
Purchase
Market
Value
(10/1/2014)
Owner's
Equity
(10/1/2014)
H12‐0061 49410208#### North Lauderdale 1/16/2013 102,600 23,586 126,186 1,600 465 10.79% 130,000 158,000 31,814
H12‐0062 49412811#### Sunrise 1/16/2013 93,800 32,286 126,086 1,400 445 9.09% 150,000 182,000 55,914
H12‐0063 50410103#### Plantation 1/22/2013 132,500 22,075 154,575 1,650 553 8.51% 170,000 206,000 51,425
H12‐0064 50420913#### Ft Lauderdale 1/24/2013 110,250 30,391 140,641 1,500 518 8.38% 150,000 182,000 41,359
H12‐0065 49413502#### Sunrise 1/28/2013 82,500 28,684 111,184 1,100 463 6.87% 130,000 157,000 45,816
H12‐0066 49421502#### Ft Lauderdale 1/29/2013 106,500 28,185 134,685 1,500 499 8.92% 165,000 199,000 64,315
H12‐0067 51412414#### Hollywood 1/30/2013 81,899 18,443 100,342 1,050 416 7.59% 105,000 127,000 26,658
H12‐0068 51422131#### Hollywood 2/6/2013 73,600 27,073 100,673 1,200 403 9.50% 110,000 132,000 31,327
H12‐0069 50411208#### Plantation 2/8/2013 80,000 23,855 103,855 1,400 421 11.32% 140,000 168,000 64,145
H12‐0070 50410103#### Plantation 2/8/2013 104,000 19,631 123,631 1,500 580 8.93% 165,000 198,000 74,369
H12‐0071 51411228#### Hollywood 2/19/2013 90,300 34,372 124,672 1,300 390 8.76% 120,000 143,000 18,328
H12‐0072 51410216#### Hollywood 2/19/2013 109,900 32,309 142,209 1,350 503 7.15% 155,000 185,000 42,791
H12‐0073 50412409#### Fort Lauderdale 2/20/2013 109,700 16,498 126,198 1,400 454 8.99% 150,000 179,000 52,802
H12‐0074 50420708#### Fort Lauderdale 2/20/2013 88,700 63,265 151,965 1,400 551 6.70% 140,000 167,000 15,035
H12‐0075 49413603#### Lauderhill 2/20/2013 98,000 44,392 142,392 1,550 571 8.25% 145,000 173,000 30,608
H12‐0076 49421506#### Oakland Park 2/21/2013 83,500 29,976 113,476 1,100 482 6.53% 120,000 143,000 29,524
H12‐0077 49411018#### North Lauderdale 2/27/2013 104,400 25,065 129,465 1,500 475 9.50% 140,000 166,000 36,535
H12‐0078 50420706#### Fort lauderdale 3/25/2013 110,000 13,914 123,914 1,350 489 8.34% 140,000 164,000 40,086
H12‐0079 50411209#### Plantation 3/29/2013 97,500 31,022 128,522 1,400 495 8.45% 130,000 152,000 23,478
H12‐0080 51411503#### Pembroke Pines 4/12/2013 122,100 46,490 168,590 1,700 598 7.85% 170,000 197,000 28,410
H12‐0081 49411601#### Lauderhill 4/12/2013 139,600 33,181 172,781 1,650 577 7.45% 185,000 215,000 42,219
H12‐0082 48421307#### Deerfield Beach 4/12/2013 60,000 26,791 86,791 1,200 387 11.24% 95,000 110,000 23,209
H12‐0083 49412408#### Lauderdale Lakes 4/18/2013 118,100 37,371 155,471 1,600 652 7.32% 150,000 174,000 18,529
H12‐0084 49420604#### Margate 4/19/2013 95,000 31,025 126,025 1,350 506 8.04% 135,000 156,000 29,975
H12‐0085 49410212#### N Lauderdale 4/19/2013 120,000 23,602 143,602 1,600 559 8.70% 150,000 173,000 29,398
H12‐0086 49412814#### Sunrise 4/24/2013 122,000 26,032 148,032 1,550 601 7.69% 260,000 260,000 111,968
H12‐0087 48421403#### Deerfield Beach 4/25/2013 76,400 27,926 104,326 1,350 484 9.96% 115,000 133,000 28,675
H12‐0088 50421716#### Fort Lauderdale 4/25/2013 77,000 32,157 109,157 1,300 492 8.89% 135,000 156,000 46,843
H12‐0089 51412302#### Hollywood 4/29/2013 95,000 25,396 120,396 1,200 412 7.86% 120,000 138,000 17,604
H12‐0090 51410308#### Hollywood 4/30/2013 138,300 26,731 165,031 1,500 526 7.08% 170,000 195,000 29,969
H12‐0091 49413513#### Sunrise 5/2/2013 113,600 27,271 140,871 1,500 513 8.41% 155,000 178,000 37,130
H12‐0092 49412006#### Sunrise 5/7/2013 161,800 24,345 186,145 1,800 656 7.38% 203,000 232,000 45,855
H12‐0093 51410202#### Hollywood 5/9/2013 98,100 23,897 121,997 1,225 496 7.18% 130,000 149,000 27,003
H12‐0094 49413605#### Lauderhill 5/15/2013 115,000 26,286 141,286 1,700 690 8.58% 160,000 182,000 40,714
H12‐0095 51420310#### Hollywood 5/15/2013 84,800 33,171 117,971 1,125 413 7.24% 120,000 137,000 19,029
H12‐0096 49410207#### North Lauderdale 5/21/2013 95,100 26,206 121,306 1,300 530 7.62% 125,000 142,000 20,694
H12‐0097 51420905#### Hollywood 5/21/2013 156,800 58,803 215,603 2,050 766 7.15% 200,000 227,000 11,397
H12‐0098 49413503#### Sunrise 5/22/2013 100,800 30,715 131,515 1,400 516 8.06% 150,000 170,000 38,485
H12‐0099 51411111#### Hollywood 5/28/2013 141,100 24,529 165,629 1,700 626 7.78% 175,000 198,000 32,371
DATA (Con't)
Rental Portfolio
12/8/14 Page 3 of 6
- 4. ID Folio # (Redacted) City Purchase Date
Purchase
Price
Capital
Expenses for
Stabilization
Total Capital
Cost Rent (mo)
Vac & Exp.
(mo) Cap Rate
Market
Value @
Purchase
Market
Value
(10/1/2014)
Owner's
Equity
(10/1/2014)
H12‐0100 50421714#### Fort Lauderdale 5/30/2013 100,600 38,529 139,129 1,400 594 6.95% 145,000 164,000 24,871
H12‐0101 50411304#### Fort Lauderdale 5/31/2013 101,500 30,197 131,697 1,400 487 8.32% 138,000 156,000 24,303
H12‐0102 49413508#### Sunrise 6/4/2013 95,400 26,107 121,507 1,450 583 8.56% 150,000 169,000 47,493
H12‐0103 51411115#### Hollywood 6/4/2013 120,600 29,582 150,182 1,400 515 7.07% 150,000 169,000 18,818
H12‐0104 49412713#### Sunrise 6/6/2013 106,100 21,601 127,701 1,400 479 8.65% 140,000 158,000 30,299
H12‐0105 51410103#### Hollywood 6/6/2013 119,000 30,651 149,651 1,350 468 7.08% 150,000 169,000 19,349
H12‐0106 49412805#### Sunrise 6/11/2013 167,800 26,744 194,544 1,800 663 7.02% 200,000 225,000 30,456
H12‐0107 48413616#### Margate 6/11/2013 121,100 27,927 149,027 1,600 673 7.46% 180,000 202,000 52,973
H12‐0108 49412905#### Sunrise 6/12/2013 104,600 24,616 129,216 1,300 495 7.48% 135,000 152,000 22,784
H12‐0109 49413605#### Lauderhill 6/12/2013 92,200 27,292 119,492 1,300 555 7.48% 135,000 152,000 32,509
H12‐0110 50411314#### Fort Lauderdale 6/12/2013 100,200 26,449 126,649 1,600 514 10.29% 135,000 152,000 25,351
H12‐0111 48412503#### Margate 6/18/2013 137,200 36,344 173,544 1,650 627 7.08% 170,000 190,000 16,456
H12‐0112 48431801#### Pompano 6/18/2013 100,400 23,985 124,385 1,450 556 8.63% 140,000 157,000 32,615
H12‐0113 49410136#### North Lauderdale 6/18/2013 116,100 28,037 144,137 1,500 538 8.01% 150,000 168,000 23,863
H12‐0114 49412025#### Sunrise 6/18/2013 162,200 24,626 186,826 2,000 774 7.88% 215,000 240,000 53,175
H12‐0115 49410320#### North Lauderdale 6/18/2013 105,800 47,912 153,712 1,450 600 6.64% 145,000 162,000 8,288
H12‐0116 51411501#### Hollywood 6/18/2013 145,100 30,199 175,299 1,600 560 7.12% 180,000 201,000 25,701
H12‐0117 49410325#### North Lauderdale 6/25/2013 124,300 24,321 148,621 1,600 635 7.80% 165,000 184,000 35,379
H12‐0118 49410207#### North Lauderdale 6/25/2013 112,900 24,507 137,407 1,700 674 8.96% 150,000 167,000 29,594
H12‐0119 48421404#### Deerfield Beach 6/26/2013 106,000 29,939 135,939 1,400 573 7.30% 135,000 150,000 14,061
H12‐0120 48430704#### Pompano 6/26/2013 70,000 29,509 99,509 1,150 379 9.30% 110,000 110,000 10,491
H12‐0121 49421504#### Oakland Park 6/26/2013 80,000 31,253 111,253 1,200 434 8.26% 160,000 160,000 48,748
H12‐0122 49413014#### Sunrise 6/28/2013 155,000 23,399 178,399 1,800 670 7.60% 200,000 222,000 43,601
H12‐0123 48430616#### Deerfield Beach 6/28/2013 165,000 19,694 184,694 1,800 731 6.95% 230,000 256,000 71,306
H12‐0124 49413605#### Lauderhill 7/2/2013 91,800 32,688 124,488 1,350 497 8.22% 140,000 155,000 30,512
H12‐0125 49421502#### Oakland Park 7/2/2013 95,600 27,667 123,267 1,200 471 7.10% 150,000 166,000 42,733
H12‐0126 50413504#### Davie 7/2/2013 130,200 28,571 158,771 1,700 673 7.76% 170,000 189,000 30,229
H12‐0127 48422420#### Pompano 7/11/2013 91,100 30,555 121,655 1,200 446 7.44% 125,000 138,000 16,345
H12‐0128 49421607#### Fort Lauderdale 7/12/2013 99,000 29,107 128,107 1,400 585 7.63% 150,000 150,000 21,893
H12‐0129 51410202#### Ft Lauderdale 7/19/2013 85,000 31,059 116,059 1,250 444 8.34% 120,000 132,000 15,941
H12‐0130 51410328#### Hollywood 7/23/2013 113,500 25,121 138,621 1,600 701 7.78% 165,000 181,000 42,379
H12‐0131 50420706#### Fort Lauderdale 7/23/2013 107,800 31,338 139,138 1,450 560 7.68% 147,000 161,000 21,862
H12‐0132 49421902#### Lauderdale Lakes 7/23/2013 92,900 23,703 116,603 1,500 711 8.12% 130,000 143,000 26,397
H12‐0133 48433013#### Pompano 7/23/2013 155,000 34,146 189,146 1,950 747 7.63% 255,000 255,000 65,855
H12‐0134 48413616#### Margate 7/24/2013 120,000 17,536 137,536 1,650 794 7.47% 170,000 186,000 48,464
H12‐0135 49412601#### Sunrise 7/29/2013 116,500 30,850 147,350 1,700 775 7.53% 165,000 180,000 32,650
H12‐0136 51411409#### Hollywood 7/30/2013 138,000 28,185 166,185 1,700 749 6.87% 185,000 202,000 35,815
H12‐0137 49412506#### Lauderhill 7/30/2013 110,000 28,430 138,430 1,400 548 7.39% 150,000 150,000 11,571
H12‐0138 50421806#### Fort Lauderdale 7/31/2013 145,000 26,106 171,106 1,650 582 7.49% 180,000 196,000 24,894
DATA (Con't)
Rental Portfolio
12/8/14 Page 4 of 6
- 5. ID Folio # (Redacted) City Purchase Date
Purchase
Price
Capital
Expenses for
Stabilization
Total Capital
Cost Rent (mo)
Vac & Exp.
(mo) Cap Rate
Market
Value @
Purchase
Market
Value
(10/1/2014)
Owner's
Equity
(10/1/2014)
H12‐0139 49421605#### Ft Lauderdale 8/6/2013 119,500 29,151 148,651 1,500 506 8.03% 175,000 190,000 41,350
H12‐0140 49421605#### Fort Lauderdale 8/6/2013 157,400 21,542 178,942 1,750 682 7.16% 185,000 201,000 22,058
H12‐0141 51411410#### PembrokePines 8/9/2013 137,000 19,032 156,032 1,700 745 7.35% 185,000 201,000 44,968
H12‐0142 49401303#### Sunrise 8/13/2013 140,300 25,331 165,631 1,700 686 7.35% 180,000 195,000 29,369
H12‐0143 49412509#### Lauderhill 8/15/2013 102,200 31,151 133,351 1,550 714 7.52% 140,000 151,000 17,649
H12‐0144 49410111#### North Lauderdale 8/15/2013 127,100 27,335 154,435 1,625 662 7.48% 160,000 173,000 18,565
H12‐0145 48412418#### Margate 8/19/2013 110,000 18,606 128,606 1,375 610 7.14% 135,000 146,000 17,394
H12‐0146 49421505#### Oakland Park 8/21/2013 94,200 29,759 123,959 1,350 563 7.62% 130,000 140,000 16,041
H12‐0147 51410204#### Hollywood 8/27/2013 143,000 24,448 167,448 1,700 677 7.33% 170,000 183,000 15,553
H12‐0148 49421410#### Oakland Park 9/3/2013 118,400 26,042 144,442 1,600 672 7.71% 160,000 171,000 26,558
H12‐0149 49423401#### Fort Lauderdale 9/3/2013 102,800 30,742 133,542 1,350 514 7.51% 160,000 171,000 37,458
H12‐0150 50420925#### Fort Lauderdale 9/3/2013 82,600 28,671 111,271 1,500 681 8.84% 175,000 187,000 75,729
H12‐0151 49410316#### Tamarac 9/12/2013 124,200 24,971 149,171 1,775 851 7.44% 160,000 170,000 20,829
H12‐0152 51412307#### Miramar 9/12/2013 110,300 10,113 120,413 1,400 517 8.80% 145,000 154,000 33,587
H12‐0153 49410110#### North Lauderdale 9/12/2013 95,000 58,895 153,895 1,600 792 6.30% 165,000 176,000 22,105
H12‐0154 51411409#### Hollywood 9/13/2013 115,000 43,411 158,411 1,500 551 7.19% 190,000 190,000 31,589
H12‐0155 51411115#### Hollywood 9/25/2013 125,000 22,219 147,219 1,500 593 7.39% 160,000 169,000 21,781
H12‐0156 51412809#### Miramar 9/27/2013 140,000 26,100 166,100 1,700 710 7.15% 175,000 185,000 18,900
H12‐0157 51422231#### Hallandale 10/2/2013 120,000 29,618 149,618 1,750 813 7.51% 155,000 199,000 49,382
H12‐0158 49410311#### North Lauderdale 10/4/2013 80,000 27,373 107,373 1,300 545 8.44% 140,000 147,000 39,627
H12‐0159 49420214#### Pompano 10/14/2013 155,000 28,999 183,999 1,750 657 7.13% 205,000 215,000 31,001
H12‐0160 51423008#### West Park 10/22/2013 94,500 29,205 123,705 1,400 680 6.98% 145,000 152,000 28,296
H12‐0161 49413603#### Lauderhill 10/24/2013 101,700 24,795 126,495 1,525 724 7.60% 130,000 136,000 9,505
H12‐0162 51412405#### Hollywood 10/25/2013 50,000 35,455 85,455 1,100 496 8.48% 110,000 115,000 29,545
H12‐0163 51410316#### Davie 10/28/2013 130,000 25,695 155,695 1,650 723 7.14% 185,900 195,000 39,306
H12‐0164 49422221#### Oakland Park 10/29/2013 100,100 31,259 131,359 1,375 621 6.88% 145,000 152,000 20,641
H12‐0165 49410210#### North Lauderdale 10/30/2013 87,600 37,848 125,448 1,425 620 7.70% 135,000 141,000 15,552
H12‐0166 51420916#### Hollywood 10/30/2013 95,800 31,704 127,504 1,400 596 7.57% 150,000 157,000 29,496
H12‐0167 49412905#### Sunrise 10/30/2013 94,400 27,843 122,243 1,300 497 7.88% 140,000 147,000 24,757
H12‐0168 51410203#### Hollywood 11/4/2013 150,000 23,660 173,660 1,750 692 7.31% 180,000 188,000 14,340
H12‐0169 49422105#### Oaklnad Park 11/6/2013 103,000 20,544 123,544 1,300 494 7.83% 150,000 157,000 33,456
H12‐0170 48431801#### Pompano 11/6/2013 104,200 34,560 138,760 1,450 595 7.39% 150,000 157,000 18,240
H12‐0171 49411601#### Lauderhill 11/12/2013 125,200 27,834 153,034 1,550 598 7.47% 160,000 167,000 13,966
H12‐0172 49410316#### Tamarac 11/13/2013 105,900 33,241 139,141 1,600 764 7.21% 175,000 183,000 43,859
H12‐0173 48413610#### Margate 11/14/2013 90,200 28,609 118,809 1,400 686 7.21% 140,000 146,000 27,191
H12‐0174 50421807#### Fort Lauderdale 11/19/2013 103,600 30,082 133,682 1,400 549 7.64% 155,000 162,000 28,318
H12‐0175 49410320#### North Lauderdale 11/19/2013 96,900 36,739 133,639 1,550 706 7.58% 150,000 157,000 23,361
H12‐0176 50420706#### Fort Lauderdale 11/20/2013 117,400 31,189 148,589 1,600 672 7.50% 165,000 172,000 23,411
H12‐0177 51421602#### Hollywood 11/22/2013 122,000 26,643 148,643 1,600 681 7.42% 170,000 178,000 29,357
DATA (Con't)
Rental Portfolio
12/8/14 Page 5 of 6
- 6. ID Folio # (Redacted) City Purchase Date
Purchase
Price
Capital
Expenses for
Stabilization
Total Capital
Cost Rent (mo)
Vac & Exp.
(mo) Cap Rate
Market
Value @
Purchase
Market
Value
(10/1/2014)
Owner's
Equity
(10/1/2014)
H12‐0178 51411114#### Hollywood 12/4/2013 123,900 28,125 152,025 1,550 609 7.42% 165,000 172,000 19,975
H12‐0179 51411006#### Hollywood 12/12/2013 119,000 28,774 147,774 1,600 688 7.41% 170,000 177,000 29,227
H12‐0180 51411005#### Hollywood 12/16/2013 120,000 28,300 148,300 1,550 482 8.64% 170,000 177,000 28,701
H12‐0181 48421405#### Pompano 12/17/2013 110,000 34,676 144,676 1,550 659 7.39% 165,000 172,000 27,325
H12‐0182 50422100#### Fort Lauderdale 1/14/2014 97,100 32,126 129,226 1,500 725 7.20% 210,000 218,000 88,774
H12‐0183 51410102#### Hollywood 1/15/2014 112,000 29,477 141,477 1,550 698 7.23% 165,000 171,000 29,523
H12‐0184 51411410#### Pembroke Pines 1/21/2014 136,100 35,229 171,329 1,650 698 6.67% 180,000 186,000 14,671
H12‐0185 49412808#### Sunrise 1/22/2014 135,000 30,646 165,646 1,600 643 6.93% 235,000 243,000 77,354
H12‐0186 48421210#### Deerfield Beach 1/28/2014 106,200 28,960 135,160 1,450 675 6.88% 180,000 186,000 50,840
H12‐0187 51411115#### Hollywood 1/28/2014 142,100 31,301 173,401 1,700 650 7.27% 190,000 197,000 23,599
H12‐0188 49412404#### Lauderdale Lakes 1/28/2014 68,100 22,421 90,521 1,300 762 7.13% 110,000 114,000 23,479
H12‐0189 49412814#### Sunrise 2/4/2014 123,300 33,298 156,598 1,650 774 6.72% 205,000 212,000 55,402
H12‐0190 49412815#### Sunrise 2/4/2014 100,400 32,075 132,475 1,375 634 6.71% 150,000 155,000 22,525
H12‐0191 50411304#### Fort Lauderdale 2/5/2014 79,100 30,214 109,314 1,300 545 8.29% 145,000 150,000 40,686
H12‐0192 51412602#### Miramar 2/5/2014 115,800 35,504 151,304 1,550 720 6.58% 162,000 167,000 15,696
H12‐0193 51410304#### Hollywood 2/5/2014 107,000 25,587 132,587 1,600 766 7.55% 170,000 176,000 43,413
H12‐0194 49422209#### Oakland Park 2/6/2014 121,500 33,607 155,107 1,750 772 7.56% 255,000 264,000 108,893
H12‐0195 51412308#### Miramar 2/12/2014 97,100 27,797 124,897 1,300 602 6.71% 135,000 139,000 14,103
H12‐0196 51412202#### Miramar 3/6/2014 120,600 30,913 151,513 1,500 632 6.87% 170,000 175,000 23,487
H12‐0197 50413505#### Davie 3/18/2014 162,000 32,675 194,675 1,850 763 6.70% 220,000 226,000 31,325
H12‐0198 51412312#### Pembroke Pines 3/18/2014 162,000 34,886 196,886 1,700 634 6.50% 200,000 206,000 9,114
H12‐0199 51412604#### Miramar 3/19/2014 120,500 33,556 154,056 1,600 677 7.19% 160,000 164,000 9,944
H12‐0200 49410217#### North Lauderdale 3/20/2014 107,900 33,387 141,287 1,450 631 6.96% 150,000 154,000 12,713
H12‐0201 49410202#### North Lauderdale 3/26/2014 111,600 35,832 147,432 1,500 621 7.15% 155,000 159,000 11,568
H12‐0202 49420602#### Margate 4/10/2014 112,000 29,491 141,491 1,550 722 7.02% 150,000 154,000 12,509
H12‐0203 51422222#### Hollywood 4/30/2014 125,000 6,258 131,258 1,200 453 6.83% 135,000 138,000 6,742
H12‐0204 51421901#### West Park 5/15/2014 99,900 34,299 134,199 1,500 733 6.86% 140,000 143,000 8,801
H12‐0205 51412706#### Miramar 5/21/2014 108,000 29,034 137,034 1,450 689 6.66% 150,000 153,000 15,966
H12‐0206 51412706#### Miramar 6/5/2014 140,100 35,264 175,364 1,650 685 6.60% 180,000 183,000 7,636
H12‐0207 51421602#### Hollywood 6/10/2014 96,500 32,283 128,783 1,350 592 7.06% 150,000 152,000 23,217
H12‐0208 49412726#### Sunrise 6/17/2014 114,000 30,523 144,523 1,400 590 6.72% 165,000 167,000 22,477
H12‐0209 51412311#### Miramar 7/2/2014 98,600 29,836 128,436 1,400 672 6.80% 155,000 157,000 28,564
Totals 209 22,590,349 6,225,869 28,816,218 312,224 119,690 8.02% 32,297,900 36,576,000 7,759,782
DATA (Con't)
Rental Portfolio
12/8/14 Page 6 of 6