SlideShare a Scribd company logo
1 of 98
Download to read offline
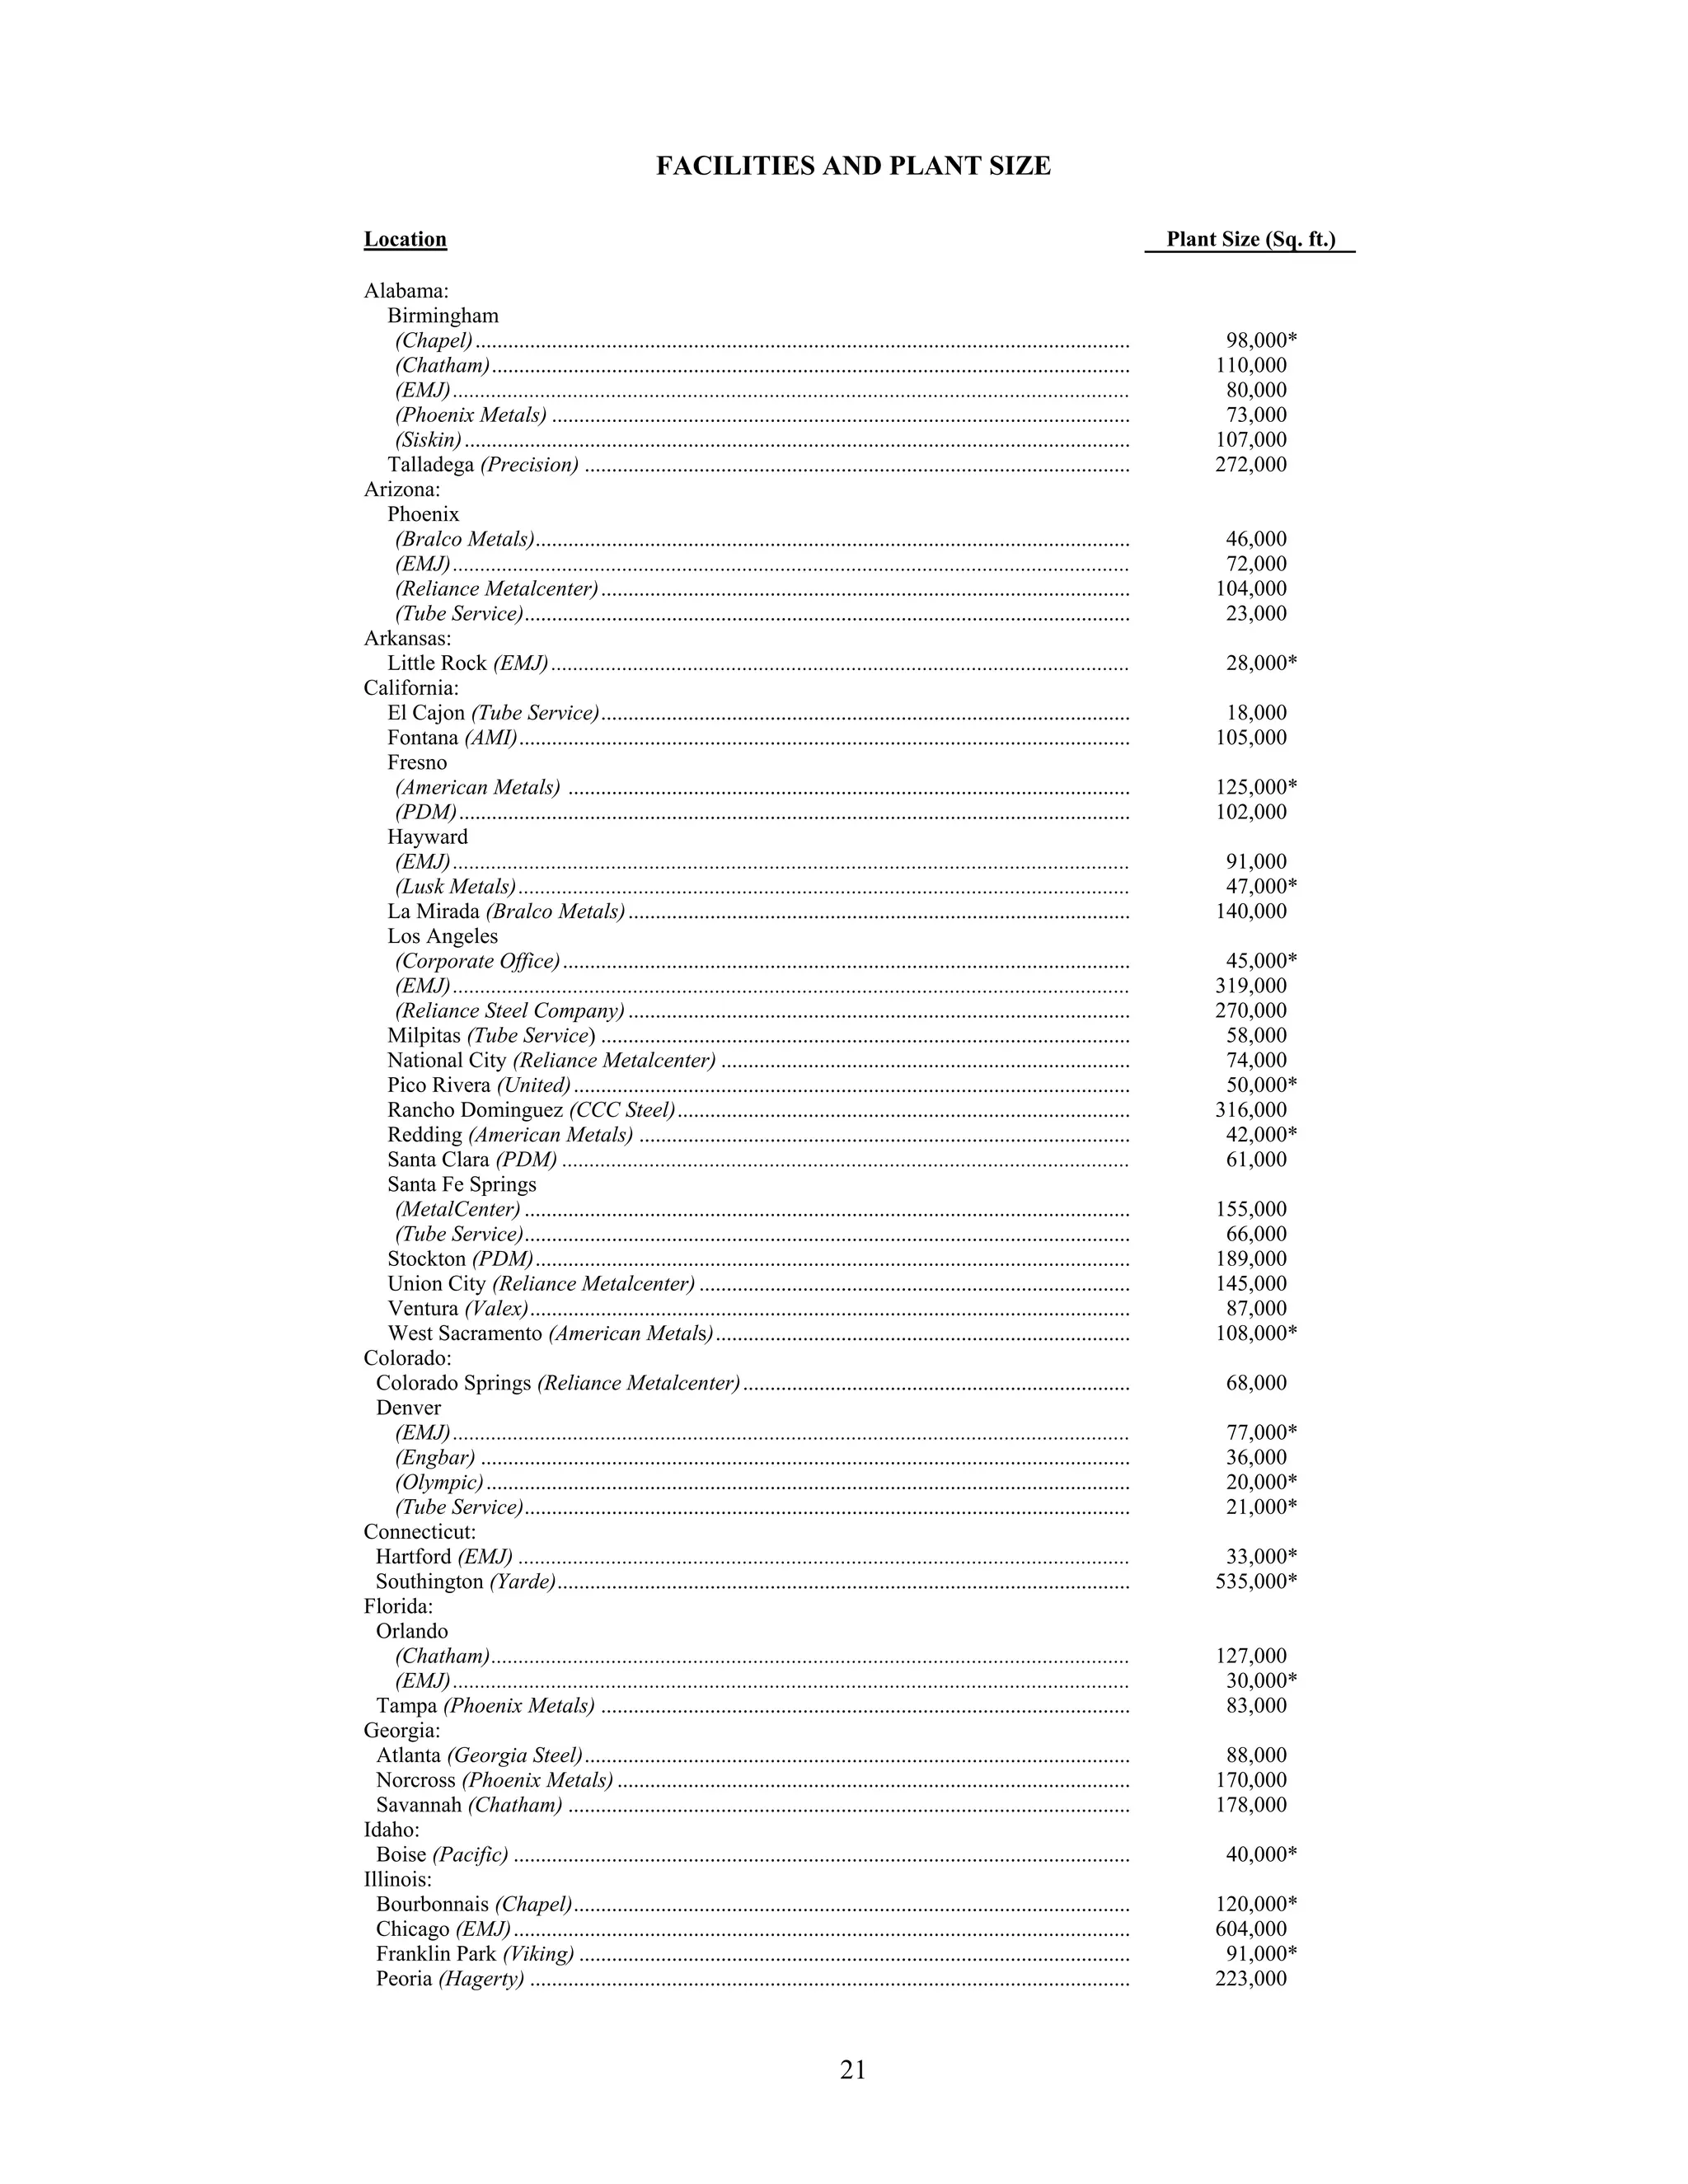
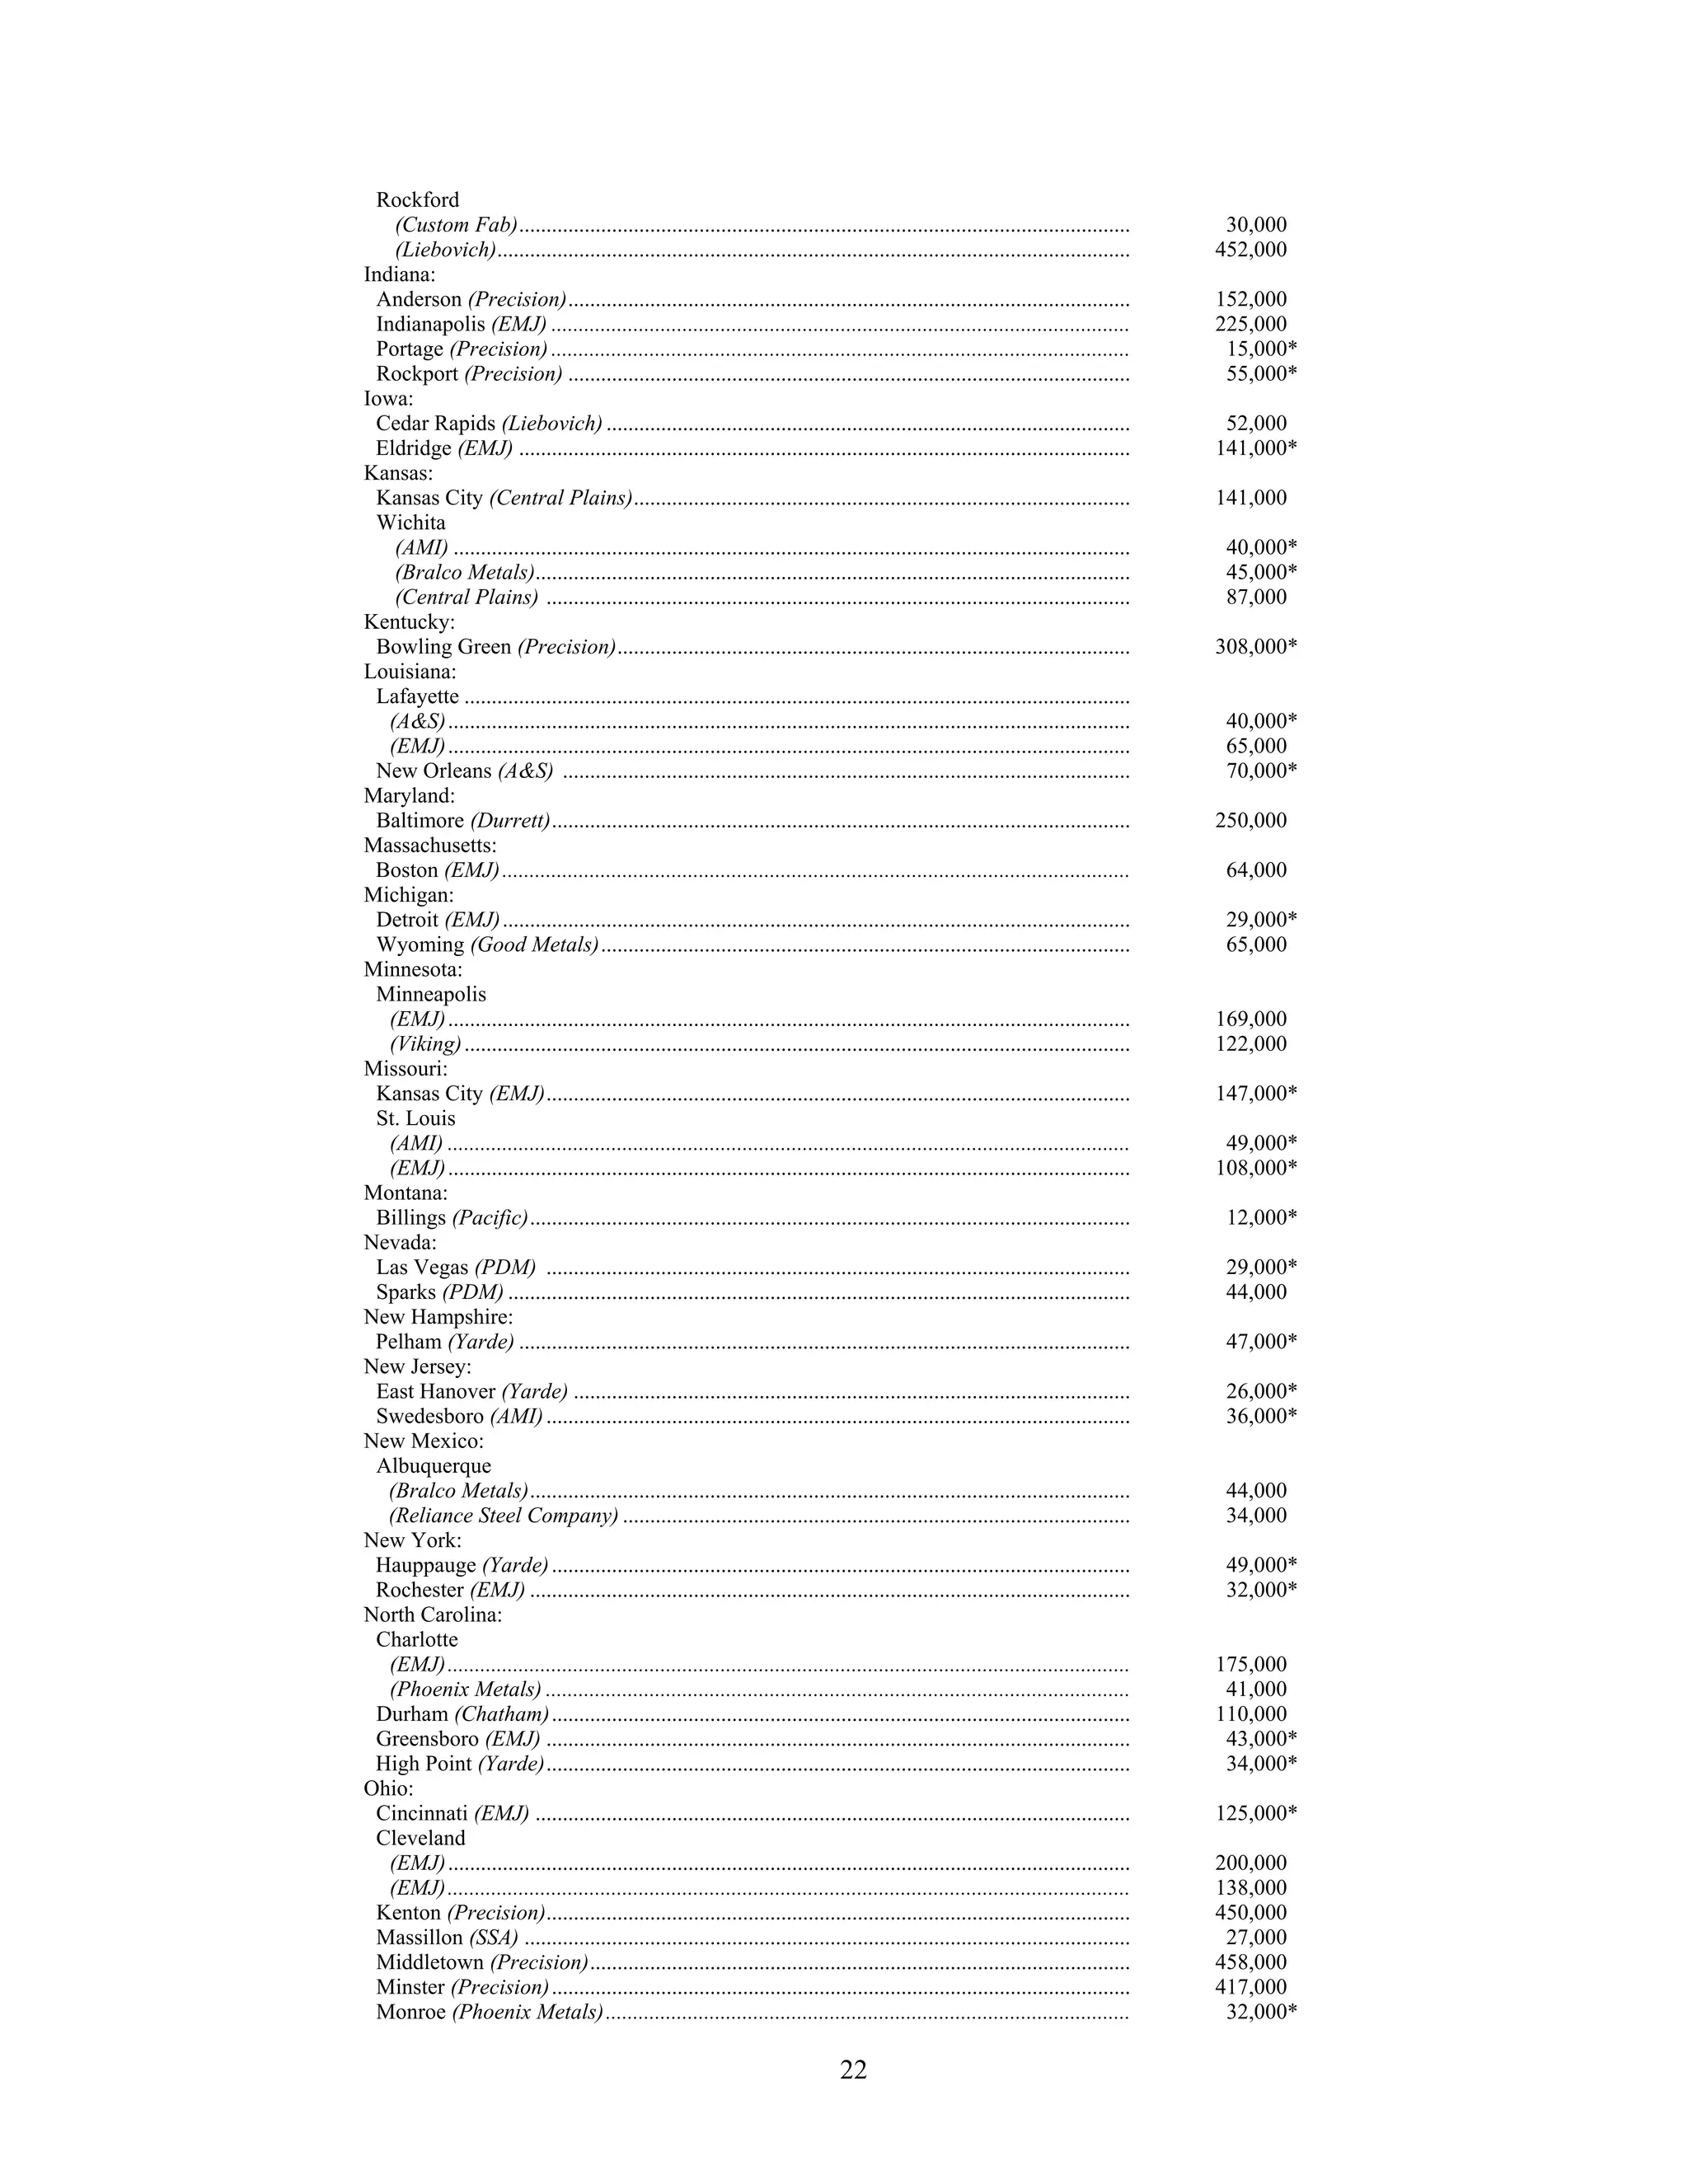
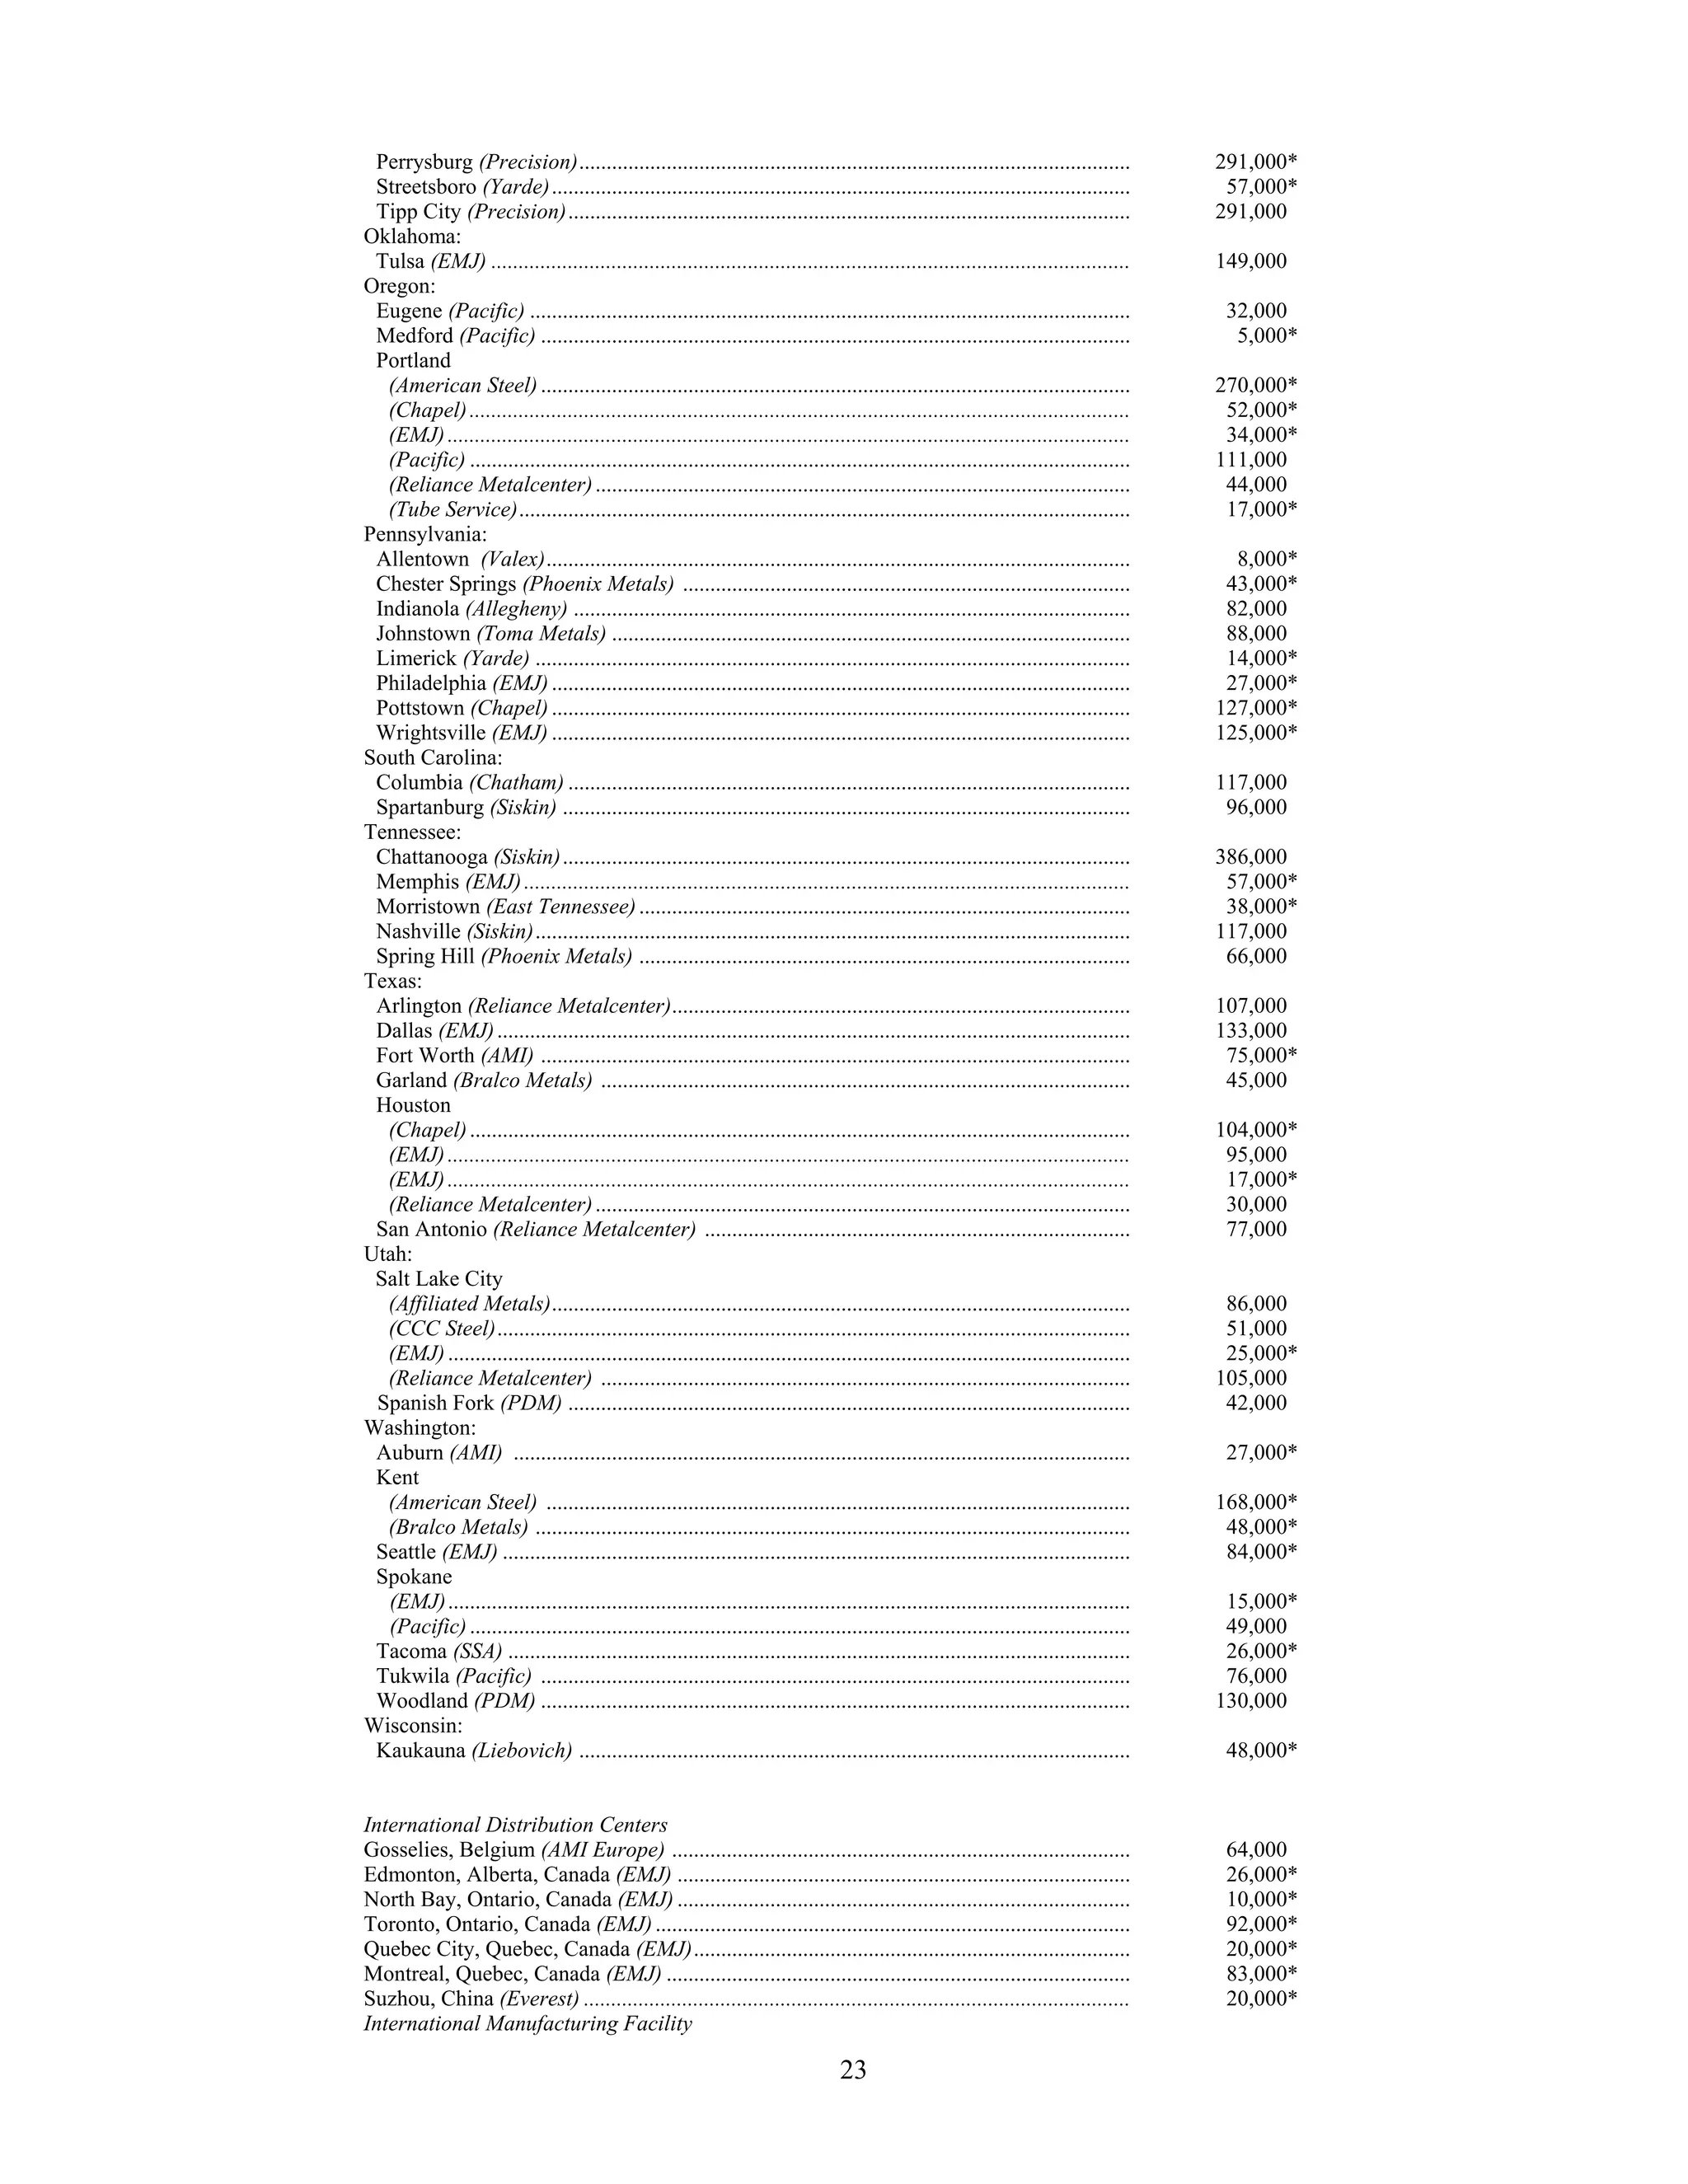
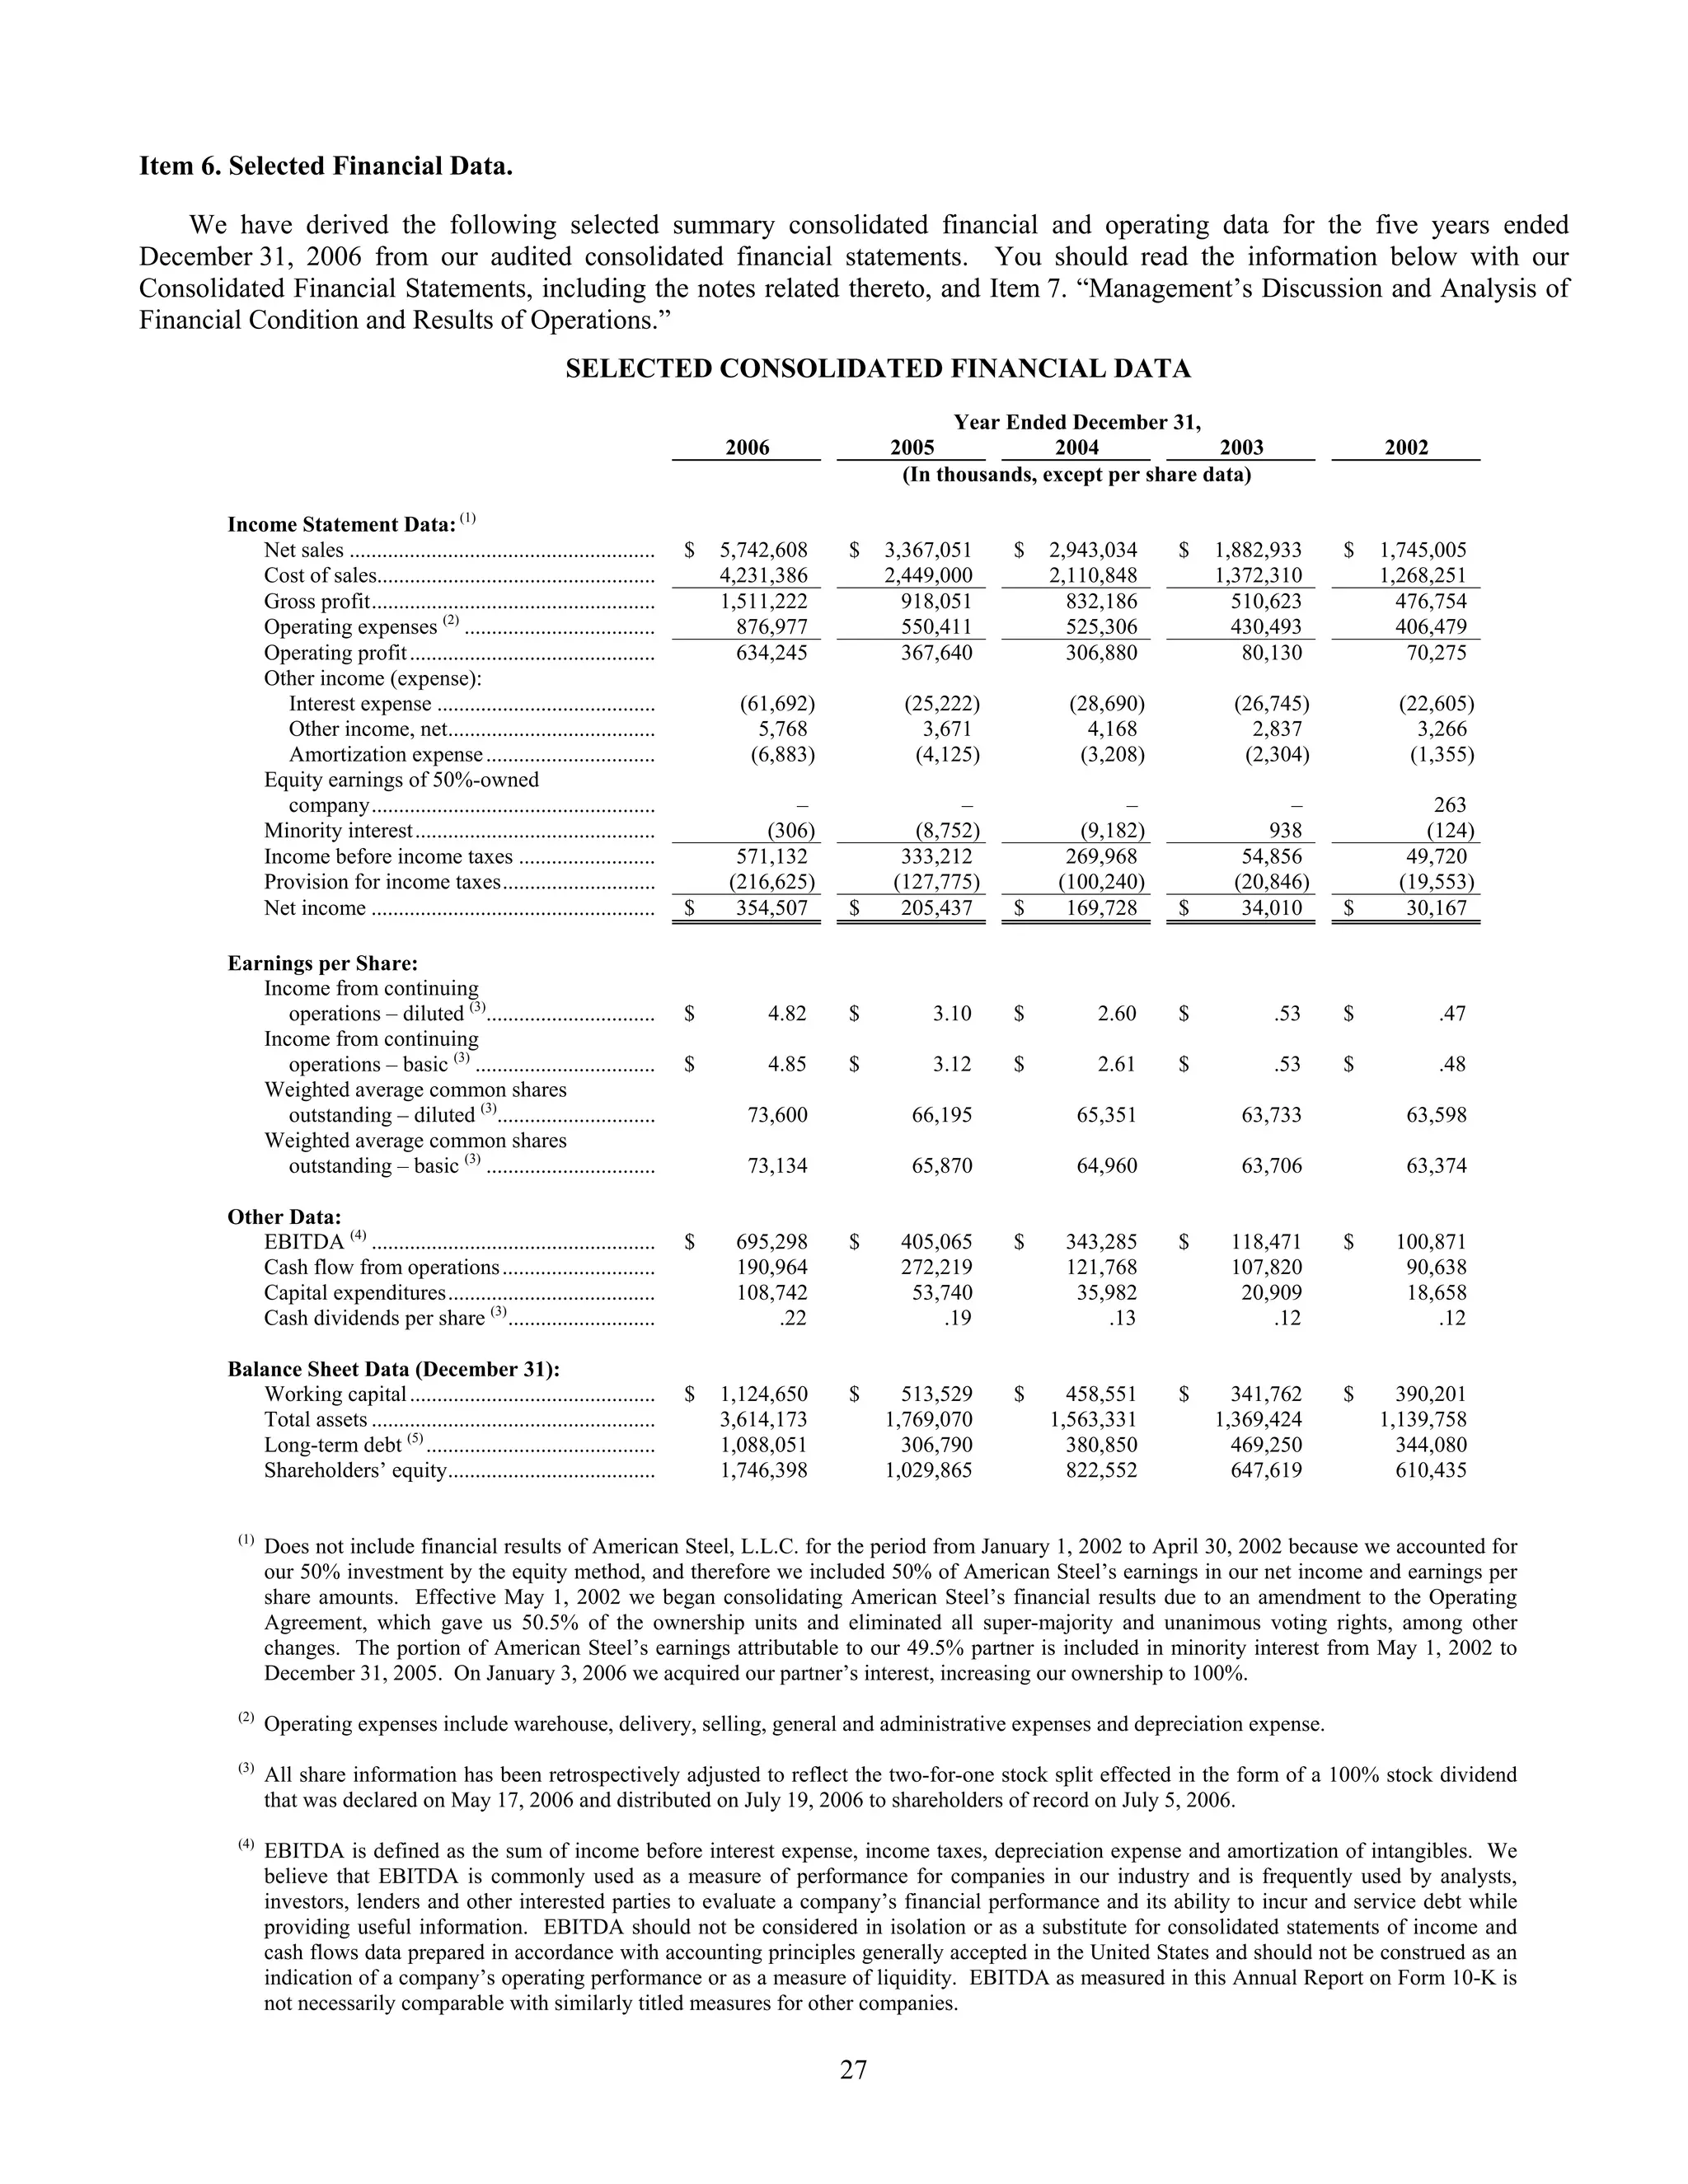
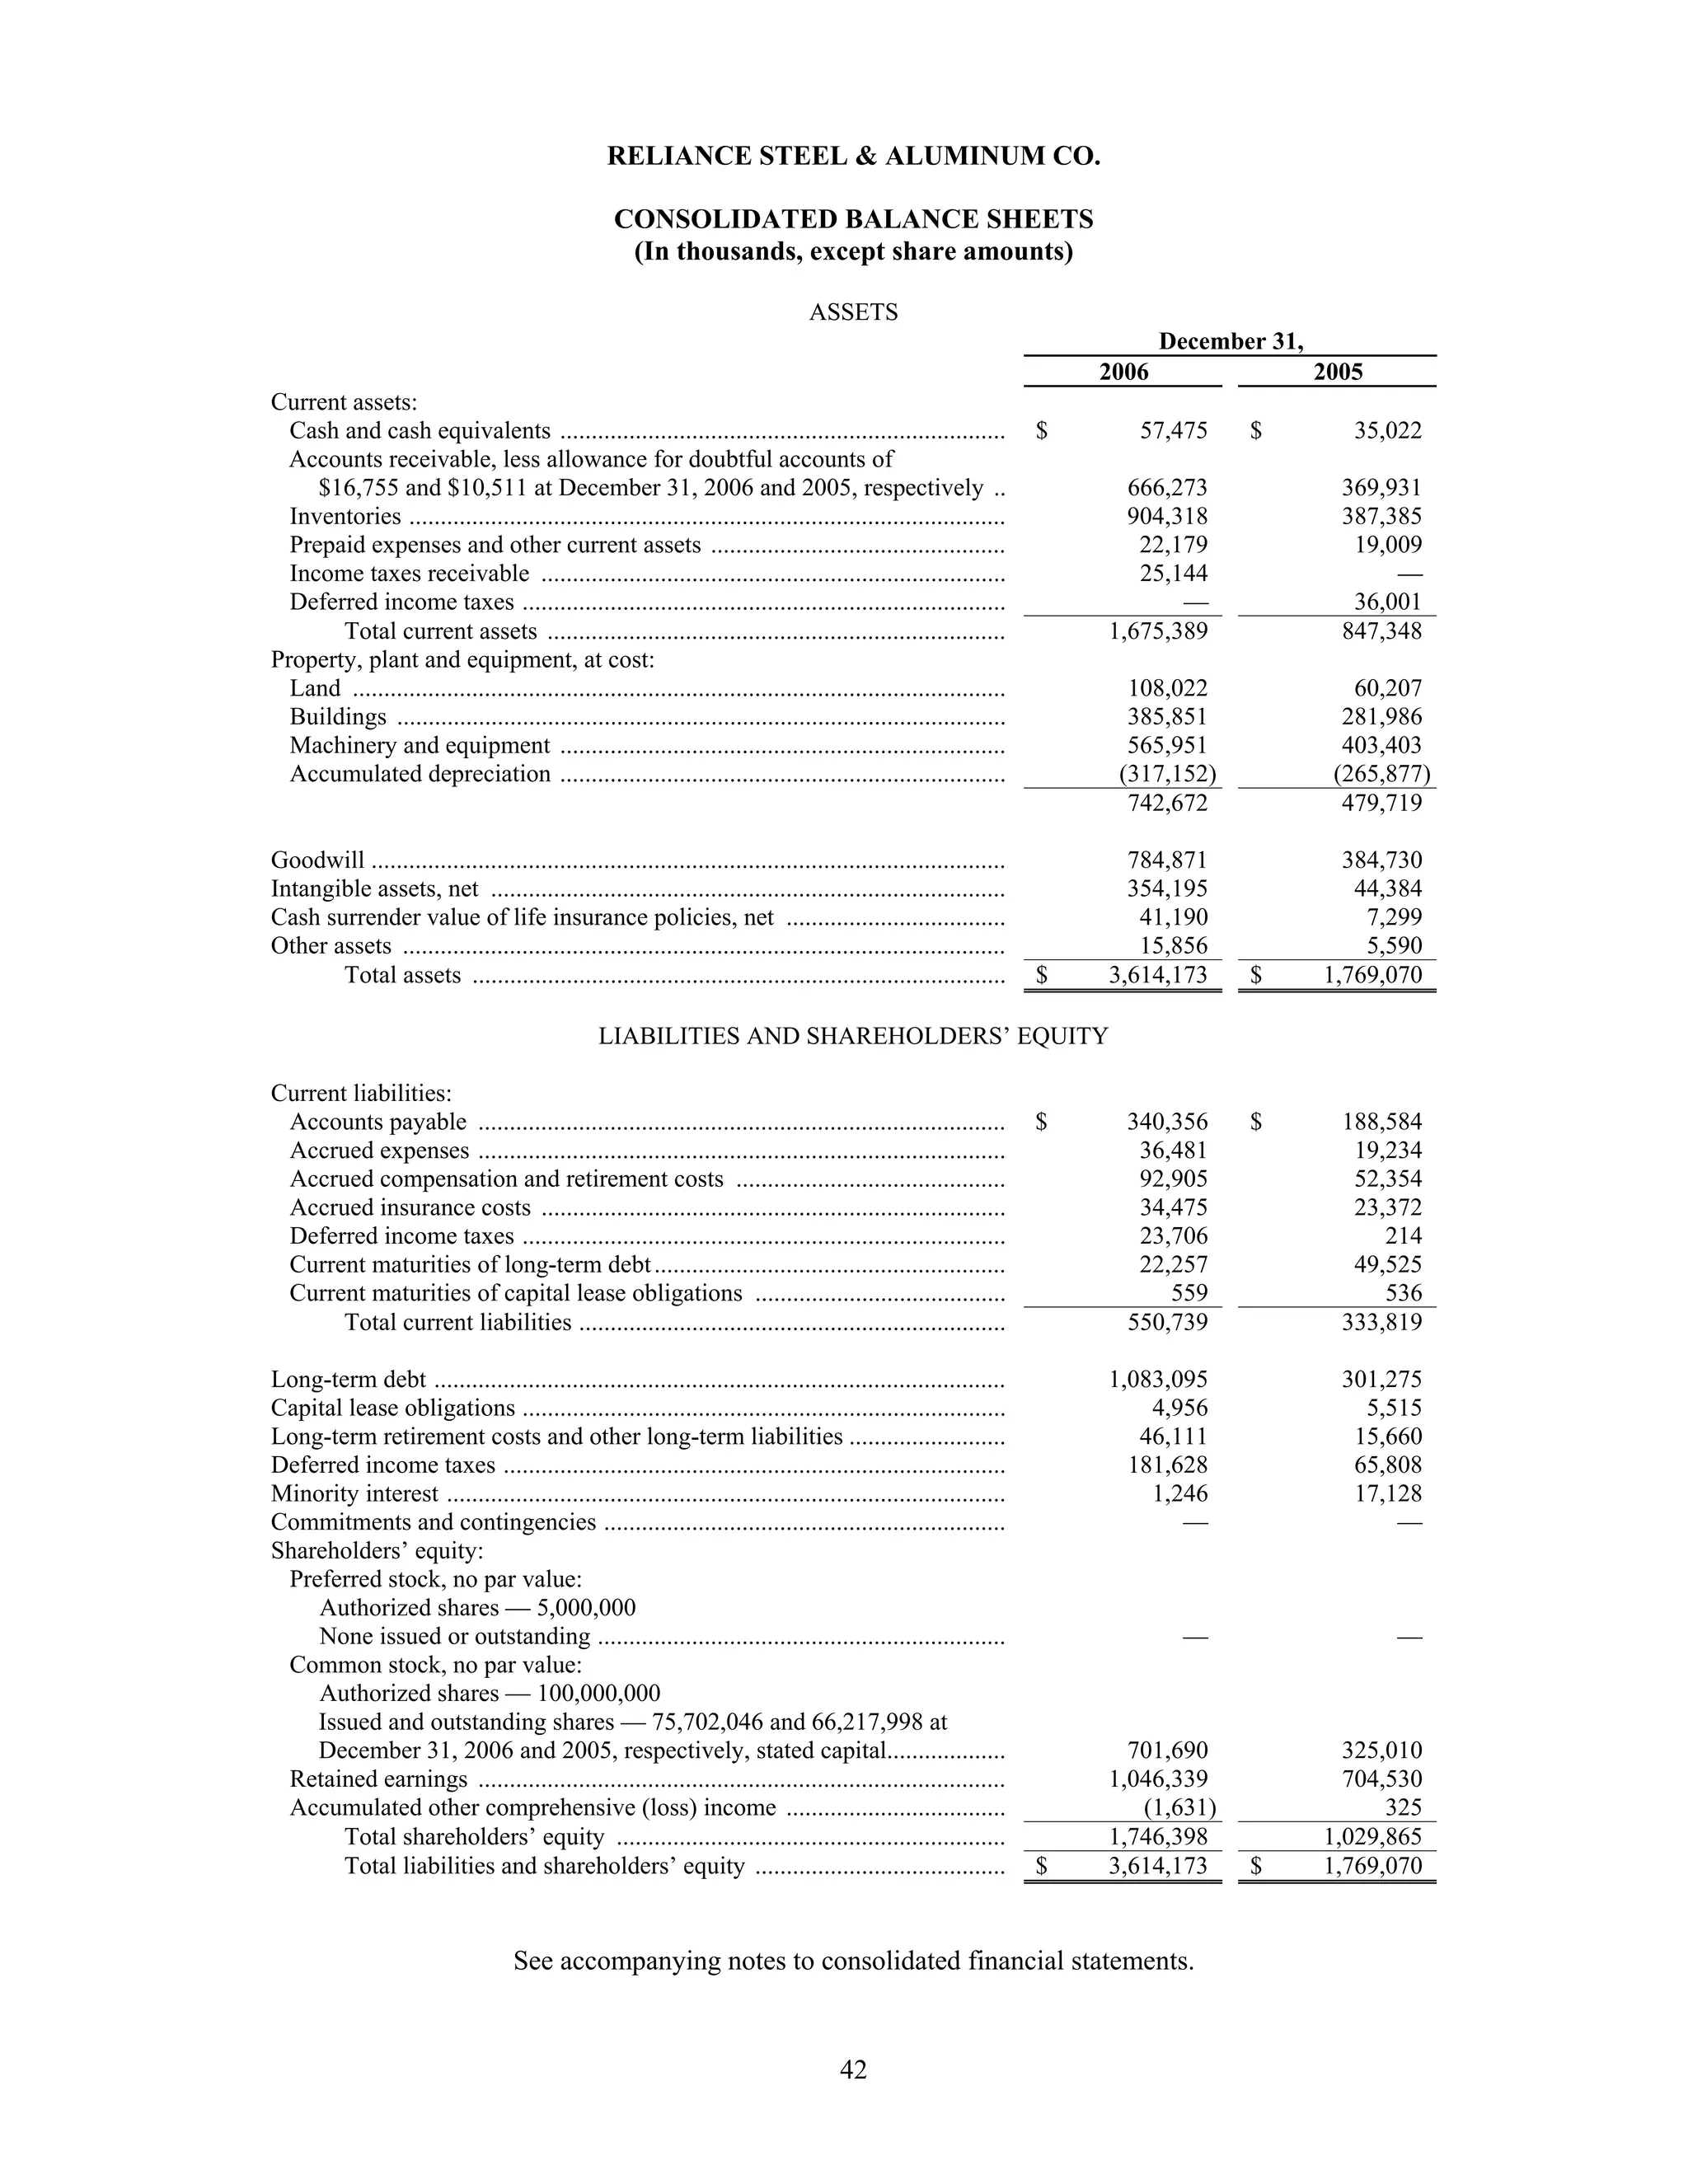
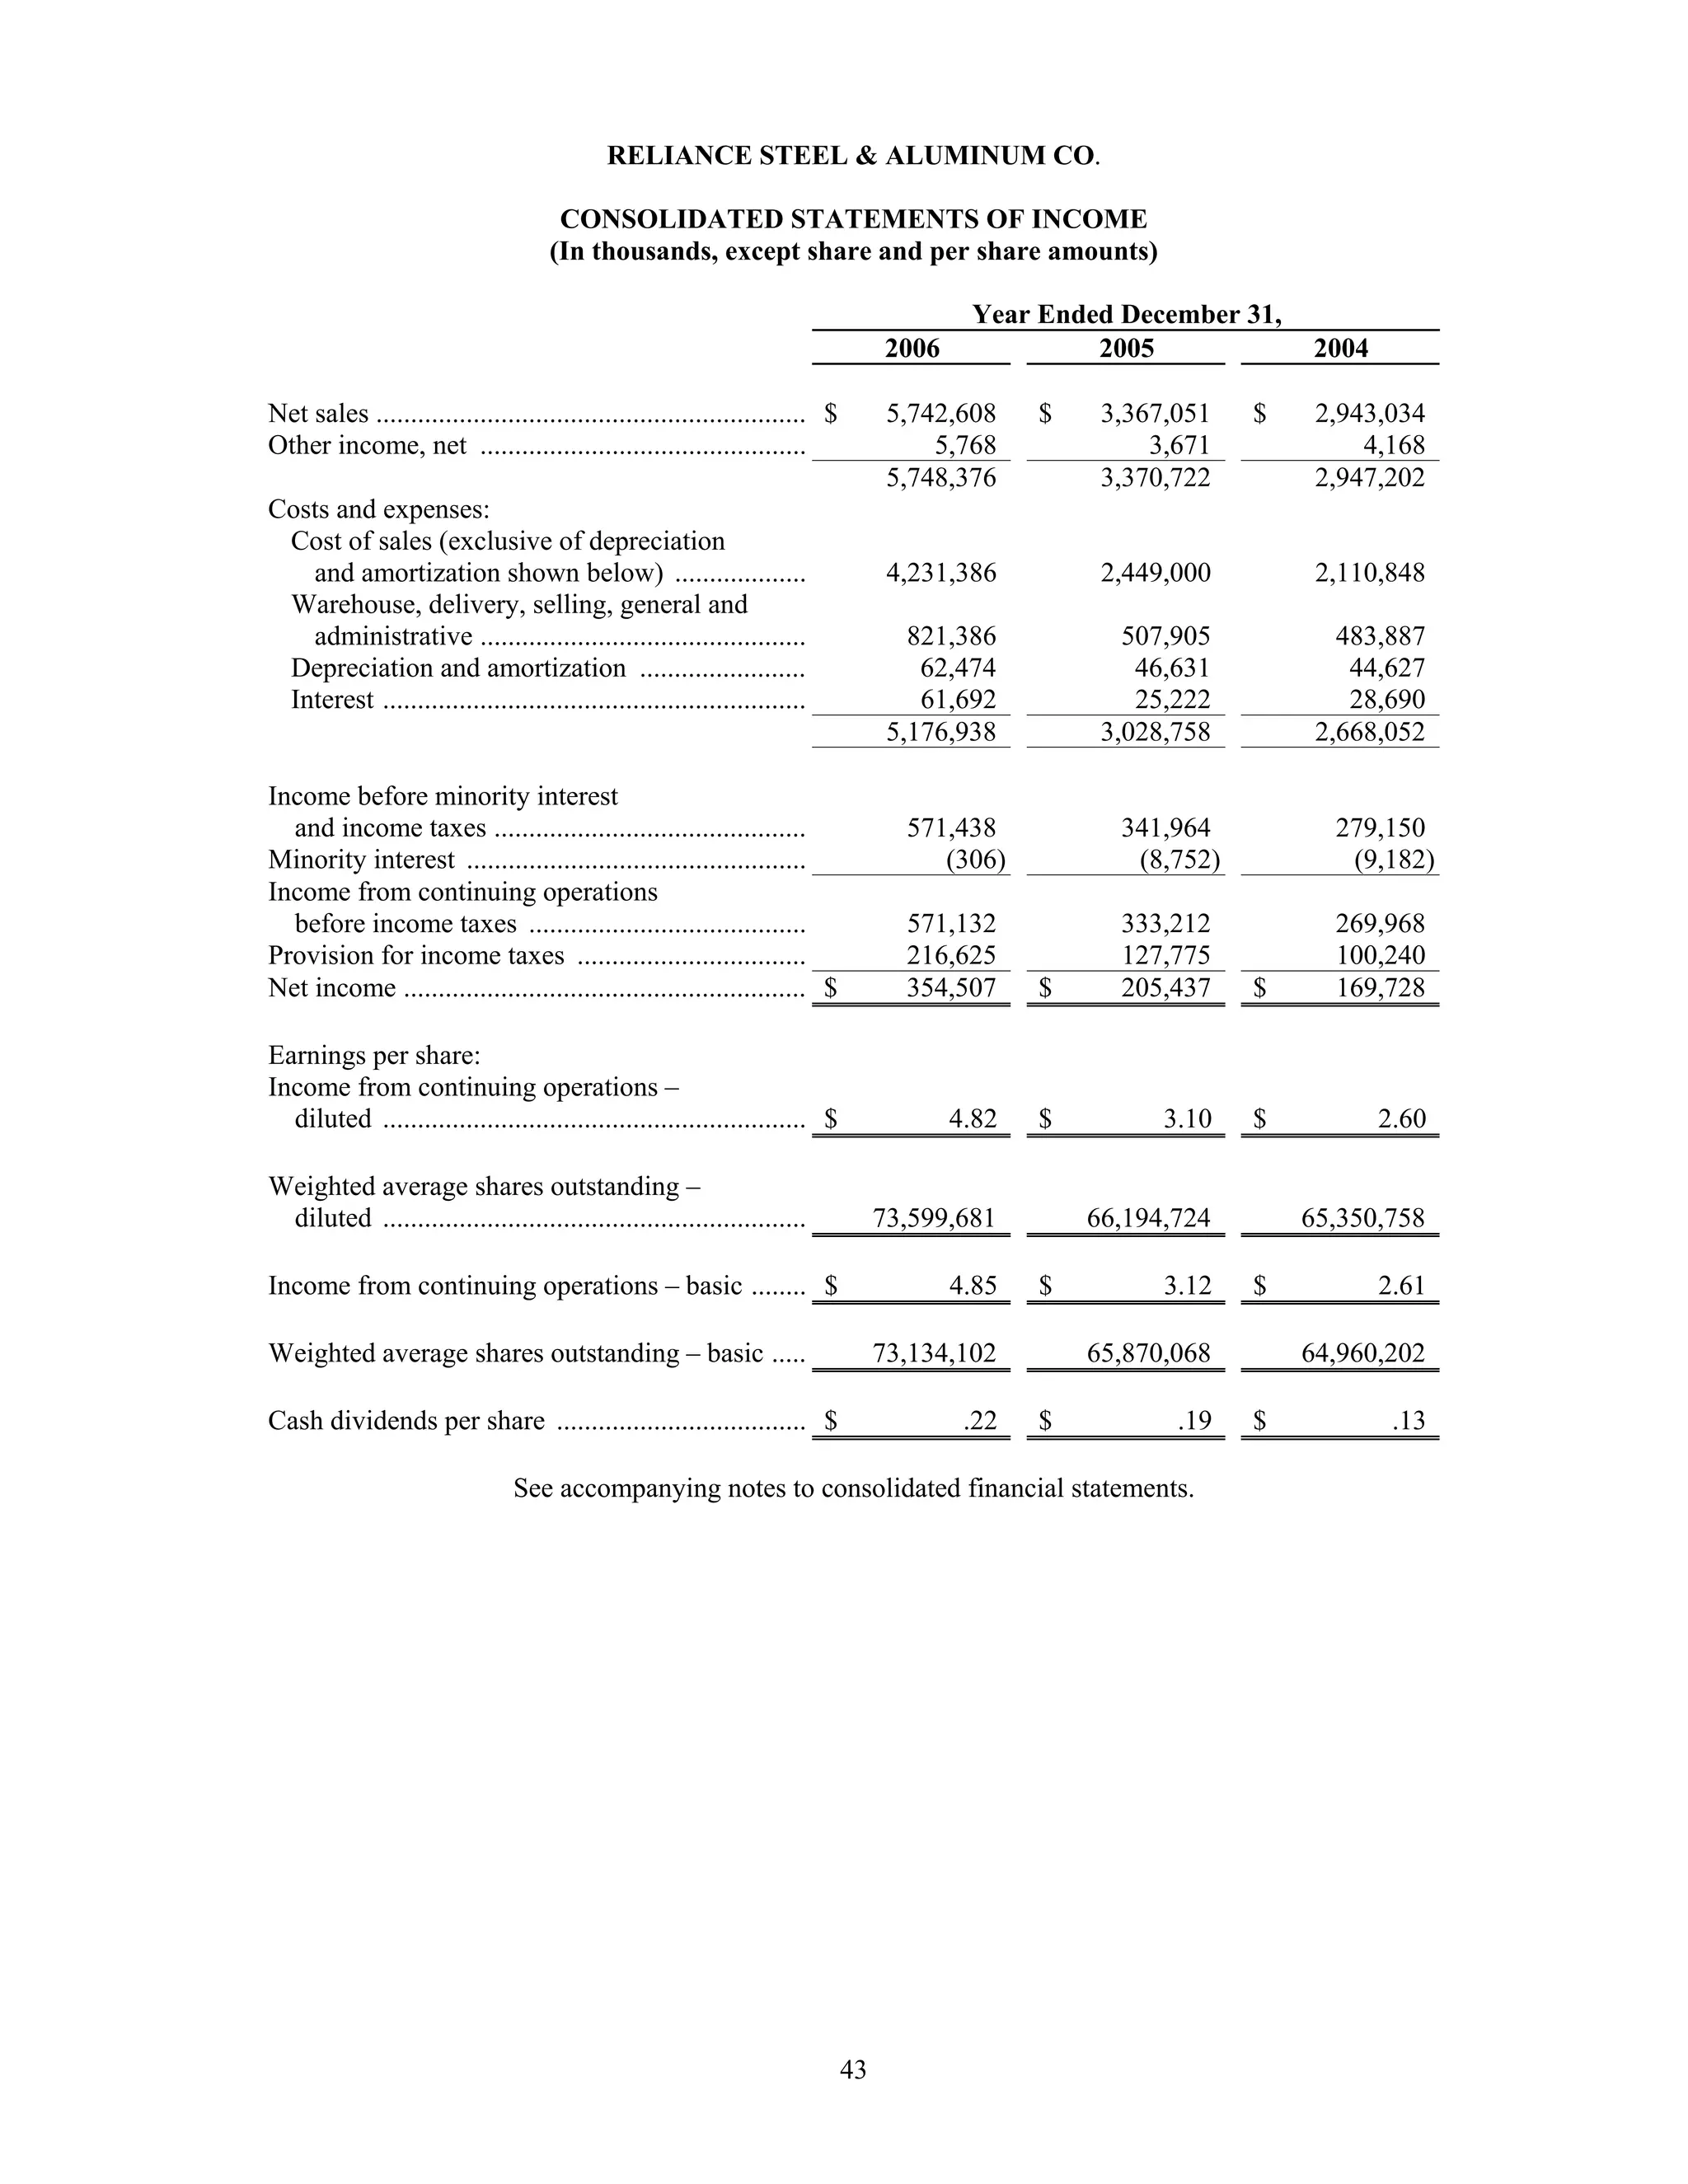
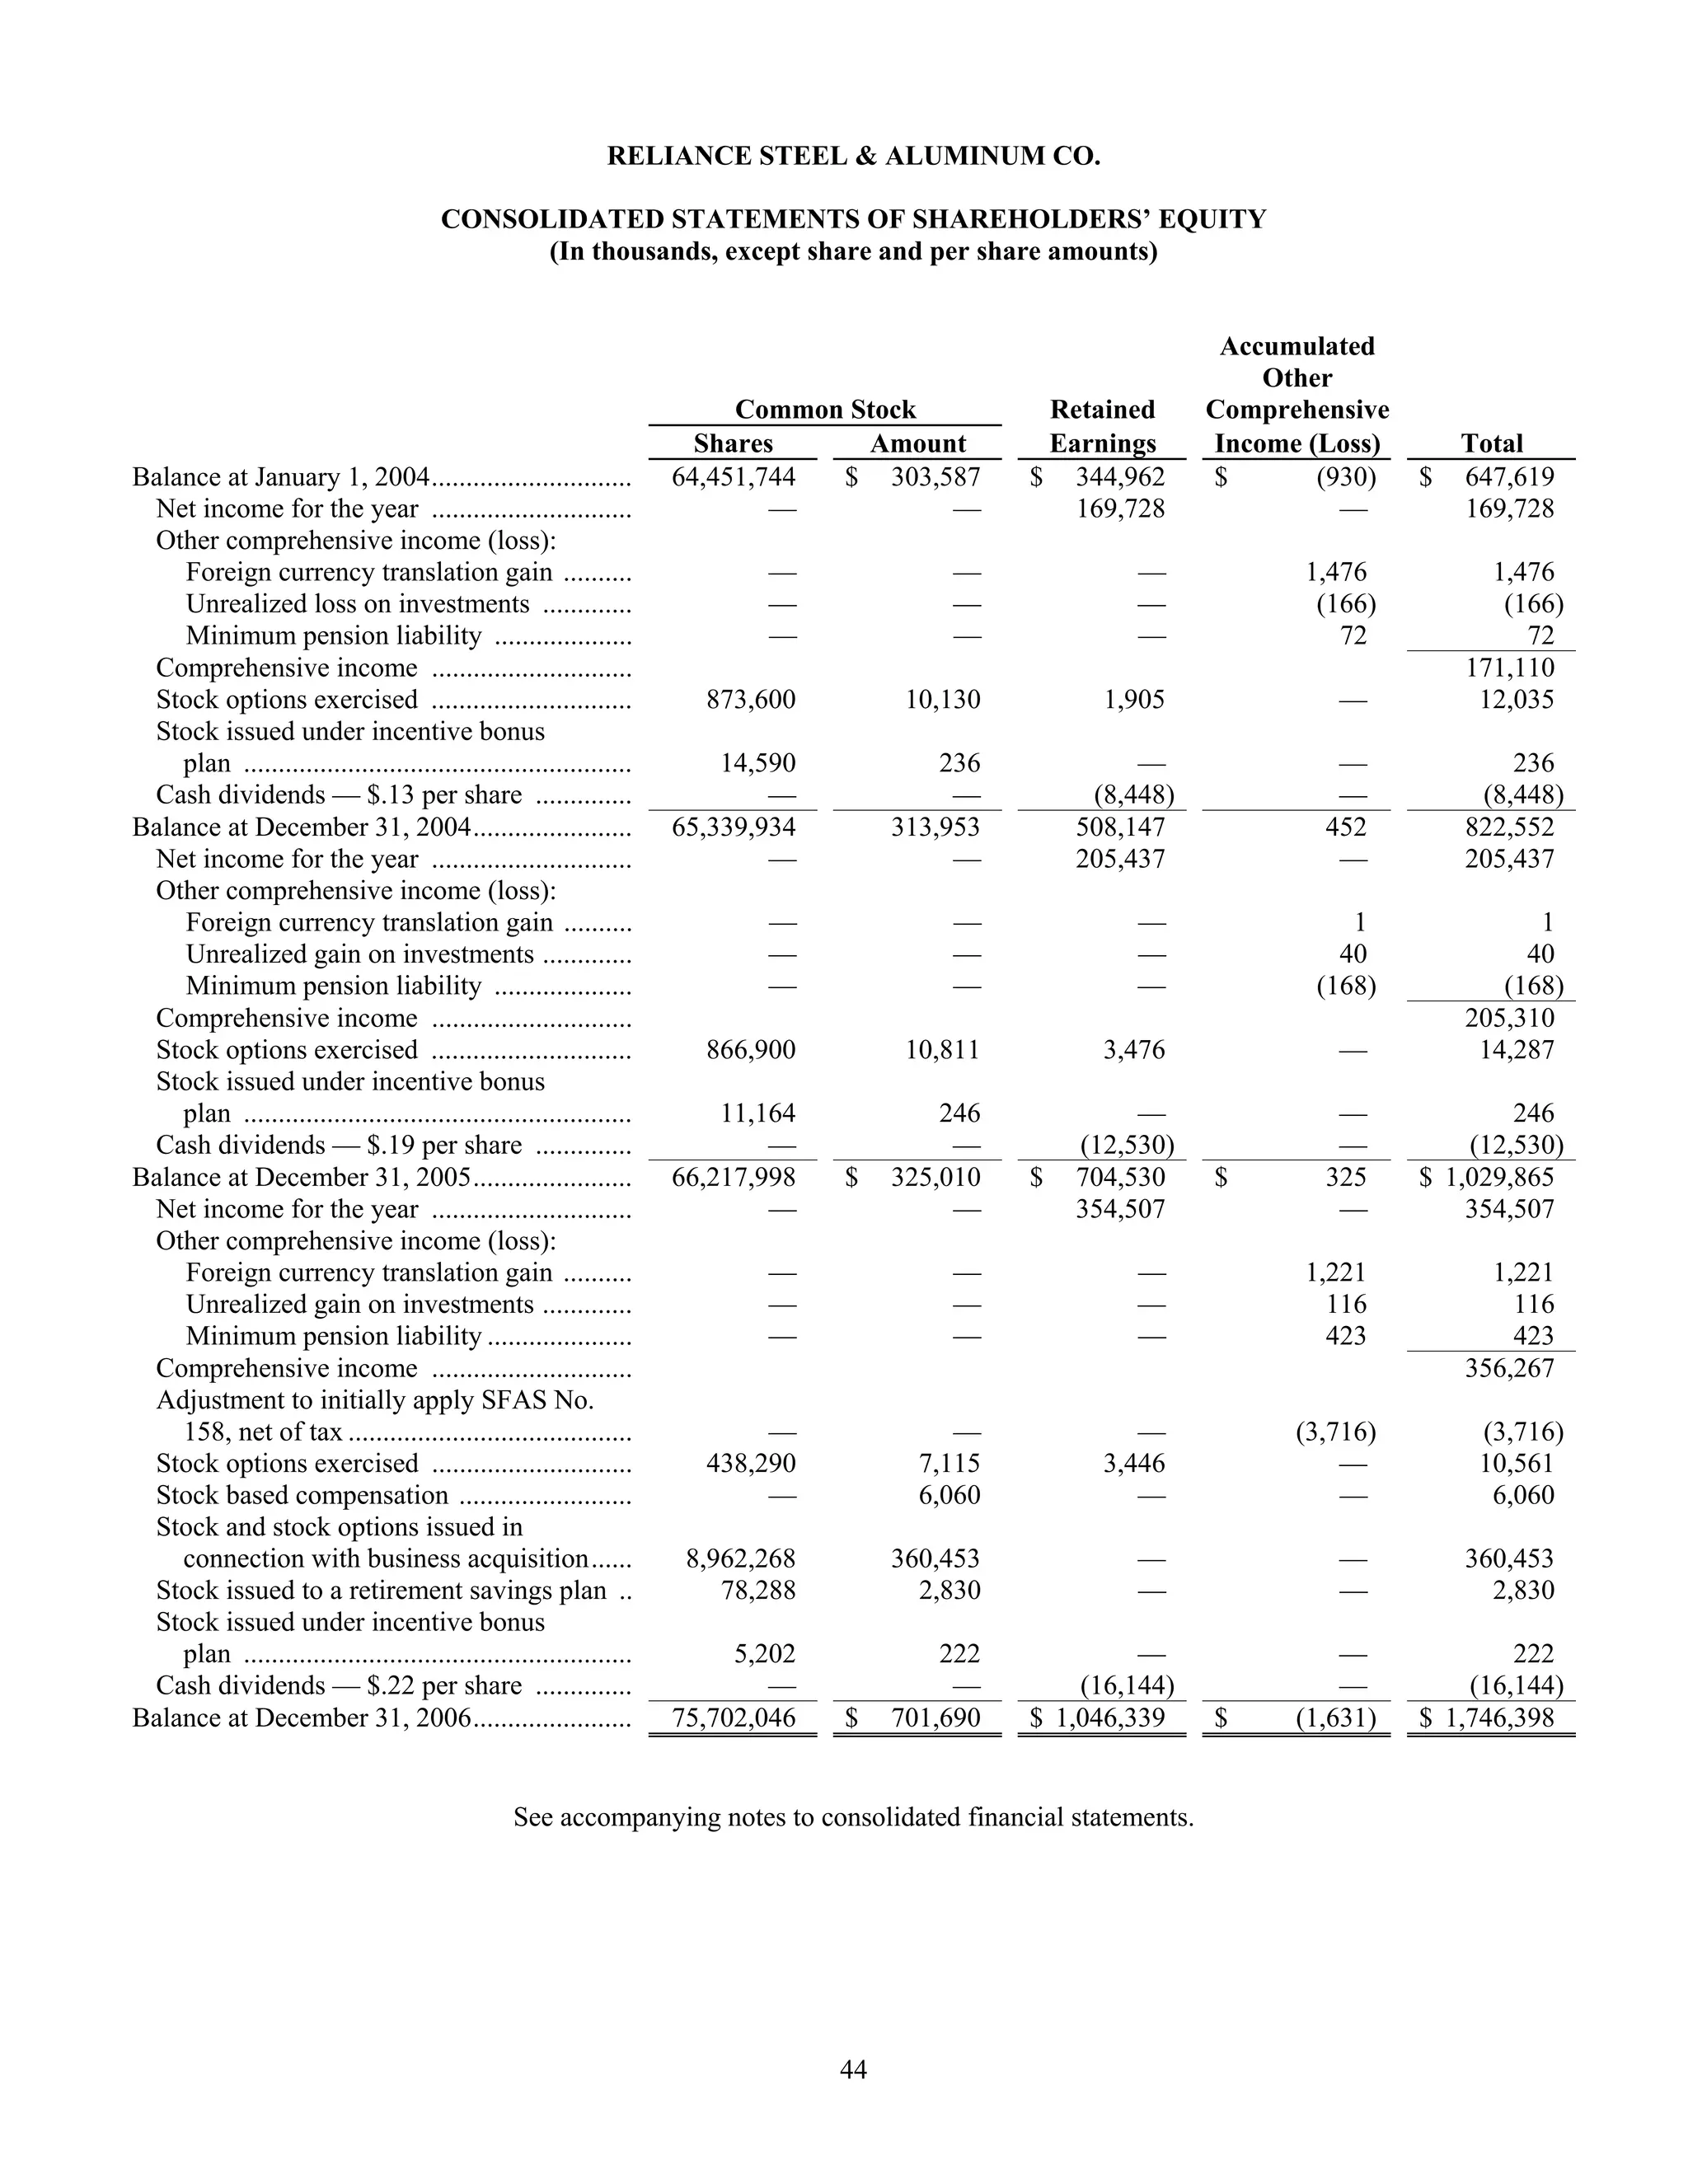
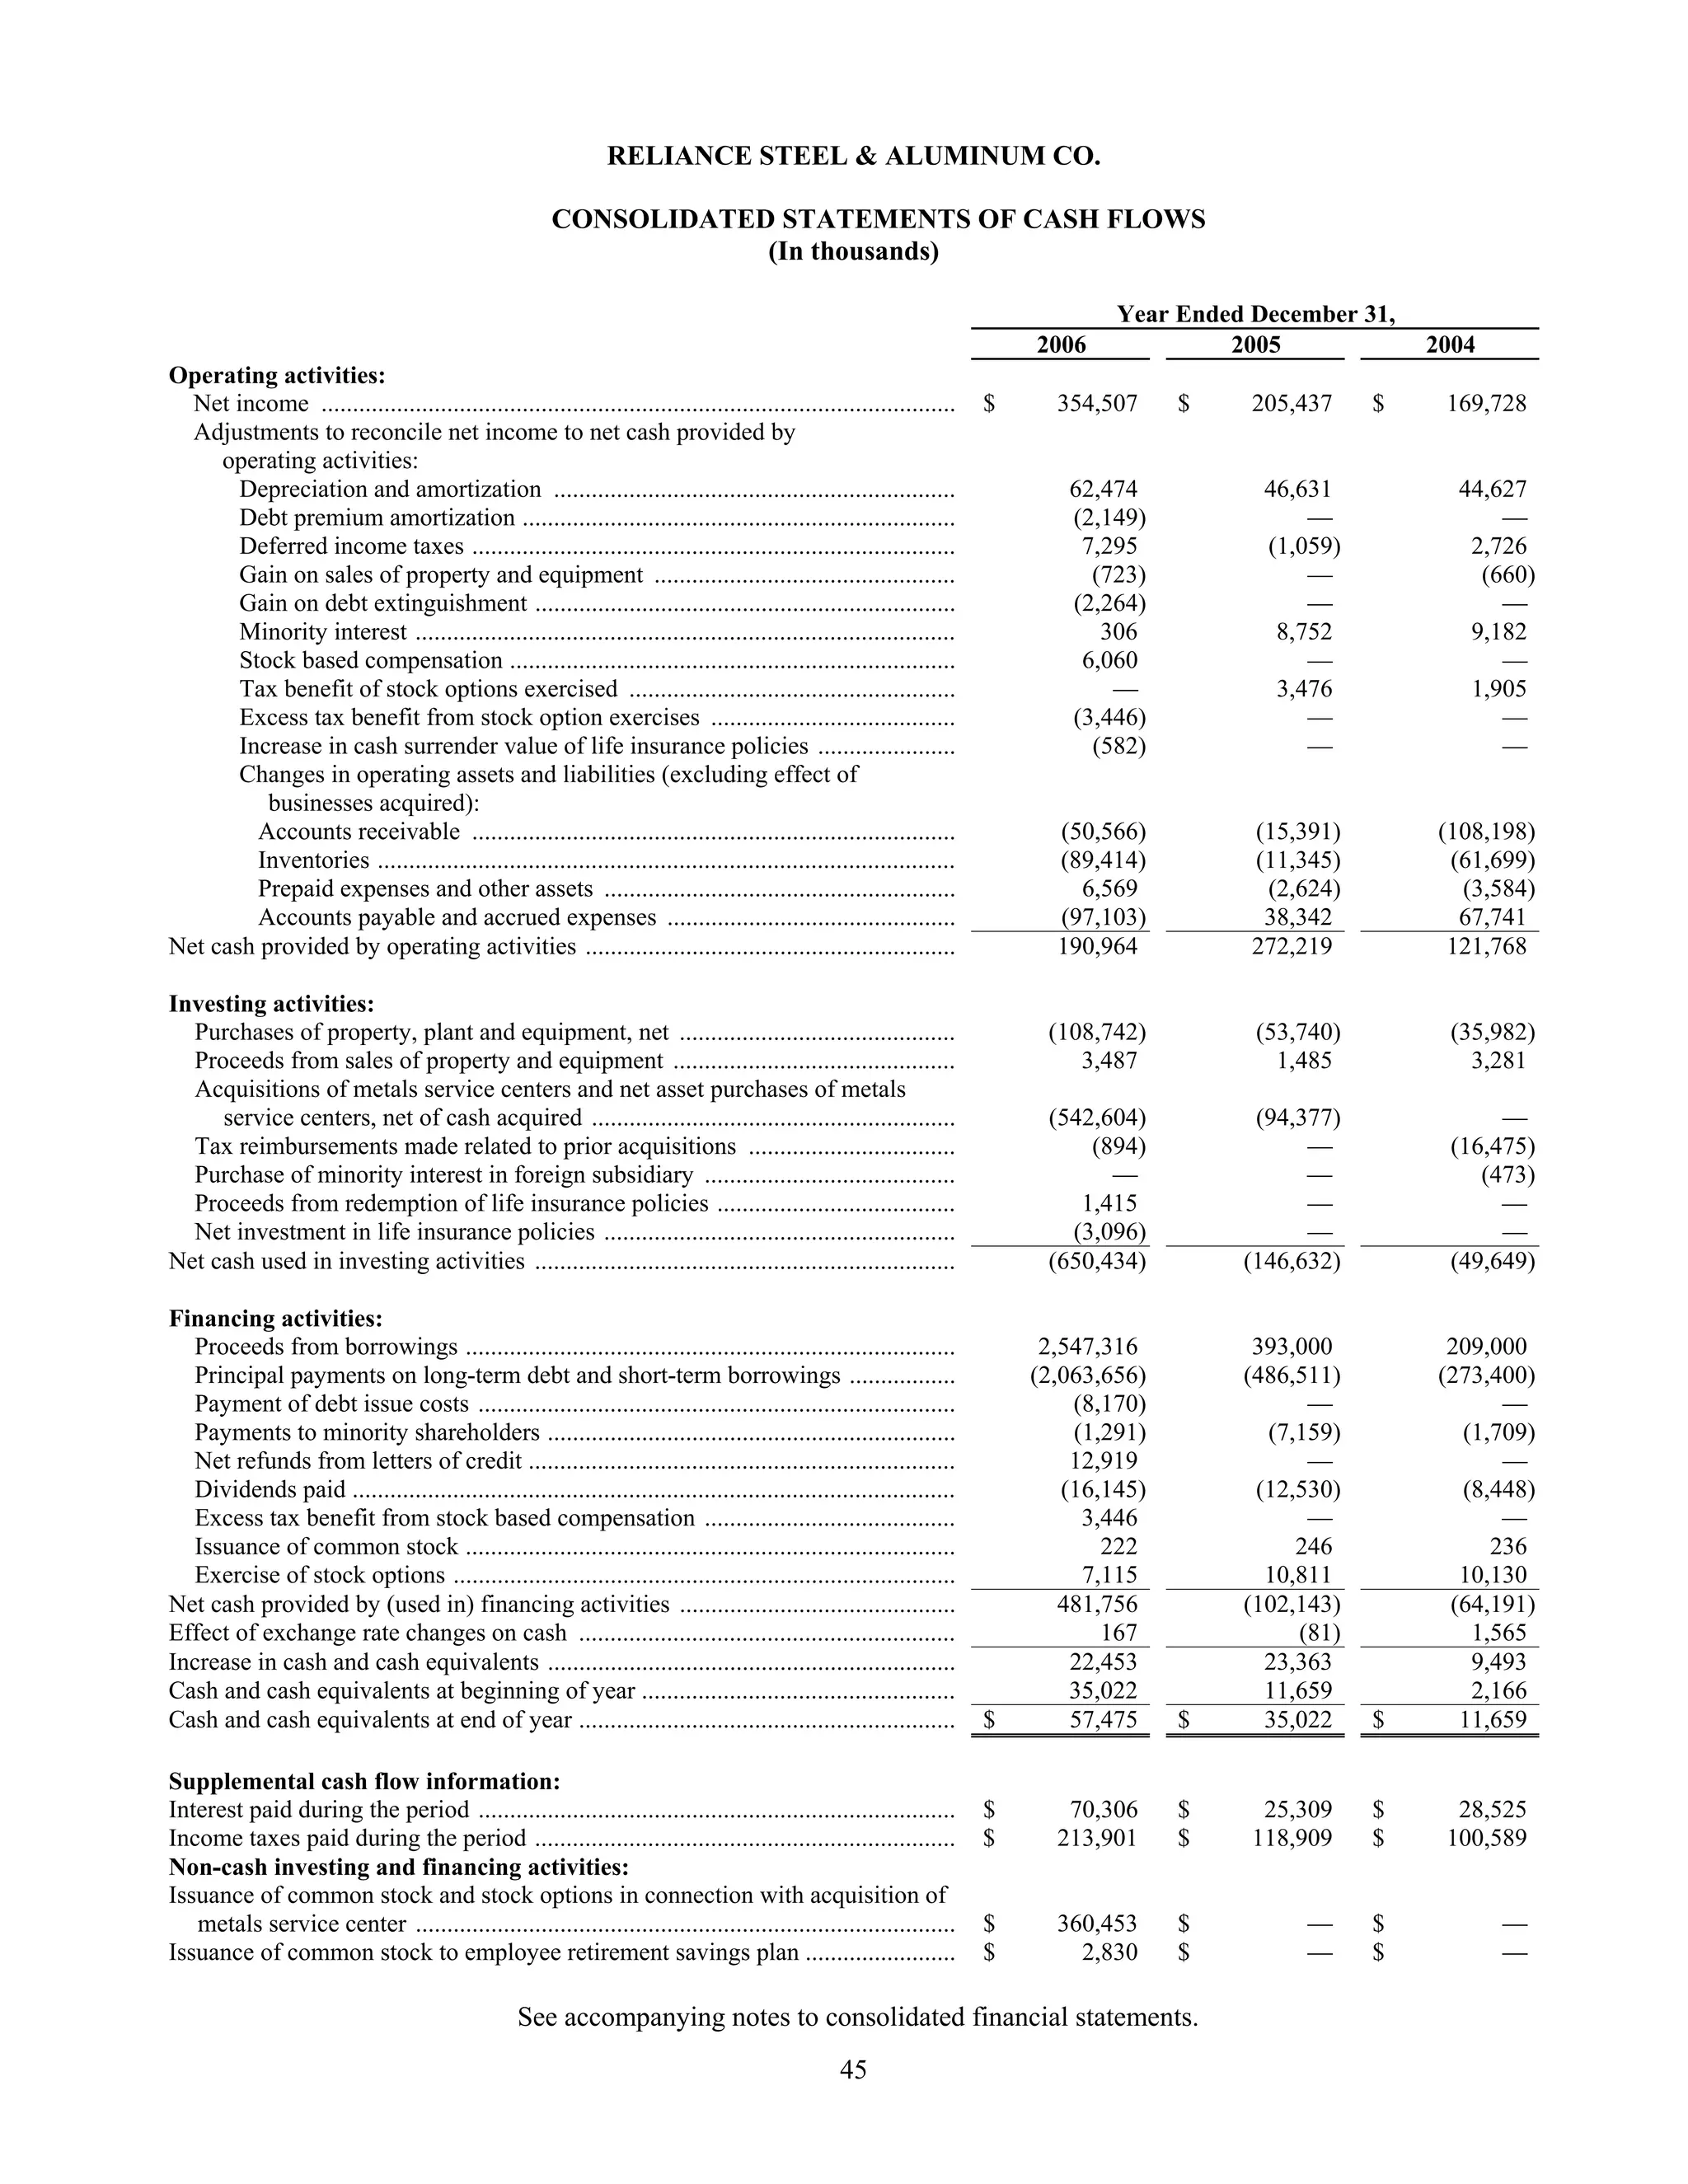
SECURITIES AND EXCHANGE COMMISSION
                                                  Washington, D.C. 20549

                                                       FORM 10-K
(Mark One)
[     ] ANNUAL REPORT PURSUANT TO SECTION 13 OR 15(d)
        OF THE SECURITIES EXCHANGE ACT OF 1934
                                            For the fiscal year ended December 31, 2006
                                       OR
[      ] TRANSITION REPORT PURSUANT TO SECTION 13 OR 15(d)
         OF THE SECURITIES EXCHANGE ACT OF 1934
                                       For the transition period from ______ to ________
                                              Commission file number: 001-13122


                  RELIANCE STEEL & ALUMINUM CO.
                                 (Exact name of registrant as specified in its charter)
                               California                                                95-1142616
                     (State or other jurisdiction of                                  (I.R.S. Employer
                    incorporation or organization)                                   Identification No.)

                                             350 South Grand Avenue, Suite 5100
                                                Los Angeles, California 90071
                                                         (213) 687-7700
                                 (Address of principal executive offices and telephone number)

                                   Securities registered pursuant to Section 12(b) of the Act:
                                                                               Name of each exchange on
                           Title of each class                                      which registered
                            Common Stock                                       New York Stock Exchange
                                   Securities registered pursuant to Section 12(g) of the Act:
                                                             None

    Indicate by check mark if the registrant is a well-known seasoned issuer, as defined in Rule 405 of the Securities Act.
Yes No
      Indicate by check mark if the registrant is not required to file reports pursuant to Section 13 or Section 15(d) of the Act.
Yes No
      Indicate by check mark whether the registrant (1) has filed all reports required to be filed by Section 13 or 15(d) of the
Securities Exchange Act of 1934 during the preceding 12 months (or for such shorter period that the registrant was required to
file such reports), and (2) has been subject to such filing requirements for the past 90 days. Yes No
      Indicate by check mark if disclosure of delinquent filers pursuant to Item 405 of Regulation S-K is not contained herein
and will not be contained, to the best of the registrant’s knowledge, in definitive proxy or information statements incorporated
by reference in Part III of this Form 10-K or any amendment to this Form 10-K.
      Indicate by check mark whether the registrant is a large accelerated filer, an accelerated filer, or a non-accelerated filer.
See definition of “accelerated filer and large accelerated filer” in Rule 12b-2 of the Exchange Act. (Check one):
    Large accelerated filer                         Accelerated filer                              Non-accelerated filer

Indicate by check mark whether the registrant is a shell company (as defined in Rule 12b-2 of the Act). Yes      No
   The aggregate market value of the voting stock held by non-affiliates of the registrant, based on the closing price on the
New York Stock Exchange on June 30, 2006 was $3,014,507,619.
       As of January 31, 2007, 75,849,932 shares of the registrant's common stock, no par value, were outstanding.
                                      DOCUMENTS INCORPORATED BY REFERENCE
       Portions of the registrant’s definitive Proxy Statement for the Annual Meeting of Shareholders to be held May 16,
    2007 (the “Proxy Statement”) are incorporated by reference into Part III of this report.
INDEX

                                                                                                                                                   Page
                                                                          PART I
    Item 1.    Business ..................................................................................................................................     1
               Industry Overview...................................................................................................................            1
               History of Reliance .................................................................................................................           2
               Customers ...............................................................................................................................       5
               Suppliers .................................................................................................................................     6
               Backlog ...................................................................................................................................     7
               Products and Processing Services ...........................................................................................                    7
               Marketing................................................................................................................................       9
               Industry and Market Cycles ....................................................................................................                 9
               Competition.............................................................................................................................       11
               Quality Control .......................................................................................................................        11
               Systems ...................................................................................................................................    11
               Government Regulation ..........................................................................................................               12
               Environmental.........................................................................................................................         12
               Employees...............................................................................................................................       12
               Available Information .............................................................................................................            12
    Item 1A.   Risk Factors ............................................................................................................................      13
    Item 1B.   Unresolved Staff Comments ...................................................................................................                  20
    Item 2.    Properties ................................................................................................................................    20
    Item 3.    Legal Proceedings ...................................................................................................................          24
    Item 4.    Submission of Matters to a Vote of Security Holders.............................................................                               24

                                                                         PART II
    Item 5.    Market for Registrant’s Common Equity, Related Stockholder Matters and Issuer                                                                  25
               Purchases of Equity Securities ................................................................................................
    Item 6.    Selected Financial Data...........................................................................................................             27
    Item 7.    Management’s Discussion and Analysis of Financial Condition and Results of Operations..                                                        29
    Item 7A.   Quantitative and Qualitative Disclosures About Market Risk ................................................                                    39
    Item 8.    Financial Statements and Supplementary Data .......................................................................                            40
    Item 9.    Changes in and Disagreements with Accountants on Accounting and Financial
               Disclosure ...............................................................................................................................     82
    Item 9A.   Controls and Procedures .........................................................................................................              82
    Item 9B.   Other Information ...................................................................................................................          82

                                                                  PART III
    Item 10.   Directors and Executive Officers and Corporate Governance ................................................                                     84
    Item 11.   Executive Compensation.........................................................................................................                84
    Item 12.   Security Ownership of Certain Beneficial Owners and Management and Related                                                                     84
               Stockholder Matters ................................................................................................................
    Item 13.   Certain Relationships and Related Transactions .....................................................................                           84
    Item 14.   Principal Accountant Fees and Services .................................................................................                       84

                                                      PART IV
    Item 15.   Exhibits, Financial Statement Schedules and Reports on Form 8-K....................................... 85

SIGNATURES     ................................................................................................................................................ 87


                                                                            i
SAFE HARBOR STATEMENT UNDER THE PRIVATE
                                    SECURITIES LITIGATION REFORM ACT OF 1995

     This Annual Report on Form 10-K and the documents incorporated by reference contain forward-looking statements within
the meaning of the Private Securities Litigation Reform Act of 1995. Our forward-looking statements include discussions of our
business strategies and our expectations concerning future operations, margins, profitability, liquidity and capital resources. In
some cases, you can identify forward-looking statements by terminology such as “may,” “will,” “should,” “expects,” “intends,”
“plans,” “anticipates,” “believes,” “thinks,” “estimates,” “seeks,” “predicts,” “potential” and similar expressions. These statements
relate to future events or our future financial performance and involve known and unknown risks, uncertainties and other factors
that may cause our actual results, levels of activity, performance or achievements to differ materially from those in the future that
are implied by these forward-looking statements. These risks and other factors include those described under “Risk Factors” and
elsewhere in this Annual Report on Form 10-K and the documents incorporated by reference. These factors, among others, could
cause our actual results and performance to differ materially from the results and performance projected in, or implied by, the
forward-looking statements. As you read and consider this Annual Report and the documents incorporated by reference, you
should carefully understand that the forward-looking statements are not guarantees of performance or results.

    All future written and oral forward-looking statements attributable to us or to any person acting on our behalf are expressly
qualified in their entirety by the cautionary statements contained or referred to in this section. New risks and uncertainties arise
from time to time, and we cannot predict those events or how they may affect us. We assume no obligation to update any forward-
looking statements after the date of this Annual Report as a result of new information, future events or developments, except as
required by the federal securities laws.

     Forward-looking statements involve known and unknown risks and uncertainties. Various factors, such as the factors listed
below and further discussed in detail in “Risk Factors” may cause our actual results, performance, or achievements to be materially
different from those expressed or implied by any forward-looking statements. Among the factors that could cause our results to
differ are the following:

    •    The interest rates on our debt could change. The interest rates on our variable rate debt increased steadily during 2005
         and 2006 and these rates may continue to increase through 2007.

    •    Foreign currency exchange rates could change, which could affect the price we pay for certain metals and the results of
         our foreign operations, which have grown as a percentage of our total operations.

    •    Our future operating results depend on a number of factors beyond our control, such as the prices for and the availability
         of metals, which could cause our results to fluctuate significantly over time. During periods of low customer demand it
         could be more difficult for us to pass through price increases to our customers, which could reduce our gross profit and
         net income. A significant or rapid increase or decrease in costs from current levels could also have a severe negative
         impact on our gross profit.

    •    We service industries that are highly cyclical, and downturns in our customers’ industries could reduce our revenue and
         profitability.

    •    The success of our business is affected by general economic conditions and, accordingly, our business was adversely
         impacted by the economic slowdown or recession in 2001, 2002 and 2003. This could occur in future periods.

    •    We operate in a very competitive industry and increased competition could reduce our gross profit margins and net
         income.

    •    As a decentralized business, we depend on both senior management and our operating employees; if we are unable to
         attract and retain these individuals, our results of operations may decline.

    •    We may not be able to consummate future acquisitions, and those acquisitions that we do complete may be difficult to
         integrate into our business.

    •    Our acquisitions might fail to perform as we anticipate. This could result in an impairment charge to write off some or all
         of the goodwill for that entity. Acquisitions may also result in our becoming responsible for unforeseen liabilities that
         may adversely affect our financial condition and liquidity. If our acquisitions do not perform as anticipated, our operating
         results also may be adversely affected.

    •    We are subject to various environmental and other governmental regulations which may require us to expend significant
         capital and incur substantial costs.
                                                                 ii
•   We may discover internal control deficiencies in our decentralized operations or in an acquisition that must be reported in
        our SEC filings, which may result in a negative impact on the market price of our common stock or the ratings of our
        debt.

    •   If existing shareholders sell their shares, the market price of our common stock could decline.

    •   Principal shareholders who own a significant number of our shares may have interests that conflict with yours.

    •   We have implemented a staggered or classified Board that may adversely impact your rights as a shareholder.

     The foregoing factors are not exhaustive, and new factors may emerge or changes to the foregoing factors may occur that
could impact our business. Although we believe the expectations reflected in the forward-looking statements are reasonable, we
cannot guarantee future performance or results. We are not obligated to update or revise any forward-looking statements, whether
as a result of new information, future events or otherwise. You should consider these risks when reading any forward-looking
statements and review carefully the section captioned “Risk Factors” in this Annual Report on Form 10-K for a more complete
discussion of the risks of an investment in the stock.


    This Annual Report on Form 10-K includes trademarks, trade names and service marks of the Company and its subsidiaries.


                                                                iii
PART I
Item 1. Business

     We are one of the largest metals service center companies in the United States. Our network of 27 divisions, 25 operating
subsidiaries and a 70%-owned company operates more than 180 locations in 37 states, Belgium, Canada, China and South
Korea. Through this network, we provide metals processing services and distribute a full line of more than 100,000 metal
products, including alloy, aluminum, brass, copper, carbon steel, titanium, stainless steel and specialty steel products, to more
than 125,000 customers in a broad range of industries. Many of our metals service centers process and distribute only specialty
metals. In addition to being diversified by product and customers, we are geographically diversified. We deliver products from
facilities located across the United States. One of our subsidiaries has an international location in South Korea that serves the
Asian semiconductor market. Another subsidiary has a metals service center in Belgium to service the European aerospace
market. On March 1, 2006, our 70%-owned joint venture company, based in Singapore, acquired a metals service center
company in China that mainly serves the electronics industry in China. We also entered the Canadian market in April 2006
through an acquisition and expanded our presence in Canada as a result of another acquisition in February 2007.

    Our primary business strategy is to enhance our operating results through strategic acquisitions, expansion of our existing
operations and improved operating performance at our locations. We believe that our geographic, customer and product
diversification also makes us less vulnerable to regional or industry specific economic volatility. Following the economic
recession in 2001, 2002 and 2003, our industry experienced a broad-based significant and unprecedented upturn in 2004 that
continued for many of our products throughout 2005 and 2006. In 2006, we achieved our highest ever levels of net sales of
$5.74 billion and net income of $354.5 million.

Industry Overview

     Metals service centers acquire products from primary metals producers and then process carbon steel, aluminum, stainless
steel and other metals to meet customer specifications, using techniques such as blanking, leveling (or cutting-to-length), sawing,
shape cutting, shearing and slitting. These processing services save our customers time, labor, and expense and reduce their
overall manufacturing costs. Specialized equipment used to process the metals requires high-volume production to be cost
effective. Many manufacturers are not able or willing to invest in the necessary technology, equipment, and inventory to process
the metals for their own manufacturing operations. Accordingly, industry dynamics have created a niche in the market. Metals
service centers purchase, process, and deliver metals to end-users in a more efficient and cost-effective manner than the end-user
could achieve by dealing directly with the primary producer or with an intermediate steel processor. Service centers comprise
the largest single customer group for North American mills, buying and reselling about 30% of all the carbon, alloy, stainless and
specialty steels, aluminum, copper, brass and bronze, and superalloys produced in the U.S. and Canada each year (Purchasing
magazine, May 2006).

     In May 2006, the magazine Purchasing also reported that the North American (U.S. and Canada) metals distribution
industry was estimated to have generated record revenues of about $115 billion in 2005 (the latest year for which such
information is available), up from $85 billion in 2004, with the increase being due to a revived metalworking economy that
boosted the nation’s need for metals and increased prices for steel and nonferrous metals.

     The metals service center industry is highly fragmented and intensely competitive within localized areas or regions. Many
of our competitors operate single stand-alone service centers. According to Purchasing, the number of intermediate steel
processors and metal center facilities in North America has decreased from approximately 7,000 locations in 1980 to
approximately 3,500 locations operated by more than 1,300 companies in 2003. This consolidation trend creates opportunities
for us to make acquisitions.

     Metals service centers are generally less susceptible to market cycles than producers of the metals, because service centers
are usually able to pass on all or a portion of increases in metal costs to their customers. In 2002 and 2003, it was more difficult
for our industry to pass through price increases of certain carbon steel products as the increased costs resulted from supply
constraints rather than customer demand, which is more typical. In 2004, these dynamics changed significantly as domestic mill
shutdowns and increased global demand limited availability of several carbon steel products. This limited supply, along with
somewhat improved U.S. demand, allowed service centers to increase their selling prices and pass these costs on to their
customers. In 2005, although supply was not as limited as in 2004 and carbon steel prices had declined from 2004 levels, the
consolidation at the carbon steel mill level resulted in a more stable pricing environment for carbon steel products. Demand and
pricing for carbon steel products improved near the end of 2005 with this improvement continuing through most of 2006.
Demand remained strong across most end markets in 2006, with the exception of the domestic auto market, although our
exposure to this market is very limited. For the most part, pricing increased through the first nine months of 2006 but declined
somewhat in the fourth quarter due to lower demand for some products and increased imports to the U.S. that resulted in higher

                                                                 1
inventory levels at distributors. Certain domestic mills reduced capacity in early 2007 which resulted in somewhat improved
pricing. Aluminum and stainless steel pricing rose throughout 2005, with significant and rapid price and demand increases for
aerospace-related products during 2005. In 2006, the prices of aluminum products, excluding specialty aerospace products,
increased somewhat and were fairly steady at high levels. The prices of aerospace related aluminum products continued to
increase in 2006, but at a slower rate than in 2005. In 2006, the prices of stainless steel products increased significantly to record
levels, primarily due to increased nickel surcharges resulting from global nickel shortages. We expect that stainless steel prices
will decline in the future if supply increases or demand declines, but we are uncertain as to when this may occur or how
significant price declines may be. A rapid and significant decline could negatively impact our results of operations. We believe
that service centers, like Reliance, with the most rapid inventory turnover are generally the least vulnerable to changing metals
prices.

    Customers purchase from service centers to obtain value-added metals processing, readily available inventory, reliable and
timely delivery, flexible minimum order size, and quality control. Many customers deal exclusively with service centers because
the quantities of metal products that they purchase are smaller than the minimum orders specified by mills or because those
customers require intermittent deliveries over long or irregular periods. Metals service centers respond to a niche market created
because of the focus of the capital goods and related industries on just-in-time inventory management and materials management
outsourcing, and because integrated mills have reduced in-house direct sales efforts to small sporadic purchasers to enhance their
production efficiency.

History of Reliance

    Reliance Steel & Aluminum Co. was organized as a California corporation on February 3, 1939, and commenced business in
Los Angeles, California fabricating steel reinforcing bar. Within ten years, we had become a full-line distributor of steel and
aluminum, operating a single metals service center in Los Angeles. In the early 1950’s, we automated our materials handling
operations and began to provide processing services to meet our customers’ requirements. In the 1960’s, we began to acquire
other companies to establish additional service centers, expanding into other geographic areas.

    In the mid-1970’s, we began to establish specialty metals centers stocked with inventories of selected metals such as
aluminum, stainless steel, brass, and copper, and equipped with automated materials handling and precision cutting equipment.
We have continued to expand our network, with a focus on servicing our customers as opposed to merely distributing metal. In
2003, we acquired a company that processes metal for a fee without taking ownership of the metal. In the past twelve months we
have expanded our geographic and product base significantly through our acquisitions. We have not diversified outside of our
core business and we strive to consistently perform as one of the best in our industry. We currently operate metals service
centers under the following trade names:

                                                                              No. of
                                                                             Locations
                              Trade Name                                                   Primary Products Processed & Distributed
   Reliance Divisions
     Affiliated Metals..................................................        1        Plate and flat-rolled aluminum and stainless steel
     Bralco Metals......................................................        6        Aluminum, brass, copper and stainless steel
     Central Plains Steel Co...................................... .            2        Carbon steel
     Engbar Pipe & Steel Co......................................               1        Carbon steel bars, pipe and tubing
     MetalCenter ........................................................       1        Flat-rolled aluminum and stainless steel
     Olympic Metals ...................................................         1        Aluminum, brass, copper and stainless steel
     Reliance Metalcenter ..........................................            9        Variety of carbon steel and non-ferrous
                                                                                           metal products
     Reliance Steel Company .....................................               2        Carbon steel
     Tube Service Co. .................................................         6        Specialty tubing
                                                                                1        Carbon steel
   Allegheny Steel Distributors, Inc. ........................
                                                                                2        Aluminum sheet, plate and bar
   Aluminum and Stainless, Inc. ..............................
   American Metals Corporation..............................                    3        Carbon steel
   American Steel, L.L.C.. ........................................             2        Carbon steel
   AMI Metals, Inc.
     AMI Metals ........................................................        6        Heat-treated aluminum sheet and plate
     AMI Metals Europe S.P.R.L...............................                   1        Heat-treated aluminum sheet and plate
   CCC Steel, Inc.
     CCC Steel...........................................................       1        Structural steel
     IMS Steel............................................................      1        Structural steel
                                                                                5        Carbon steel plate
   Chapel Steel Corp. ................................................

                                                                               2
5    Full-line service centers
   Chatham Steel Corporation..................................
                                                                                2    Carbon steel flat-rolled, plate, bar and structurals
   Crest Steel Corporation .........................................
                                                                                1    Carbon steel plate, bar and structurals
   Durrett Sheppard Steel Co., Inc. ...........................
   Earle M. Jorgensen Company
     Earle M. Jorgensen.............................................            33   Specialty bar and tubing
     Earle M. Jorgensen (Canada) Inc.......................                     5    Specialty bar and tubing
     Steel Bar..............................................................    1    Carbon steel bars and tubing
                                                                                1    Aluminum Plate and Bar
   Everest Metals (Suzhou) Co., Ltd..........................
   Liebovich Bros., Inc.
     Liebovich Steel & Aluminum Company .............                           3    Full-line service centers
     Custom Fabricating Co......................................                1    Tool and alloy steels
     Good Metals Company ......................................                 1    Plate and flat-rolled carbon steel
     Hagerty Steel & Aluminum Company ................                          1    Metal fabrication
   Lusk Metals.......................................................... .      1    Precision cut aluminum plate and aluminum
                                                                                       sheet and extrusions
                                                                                7    Aluminum and coated carbon steel
   Pacific Metal Company ........................................
                                                                                7    Carbon steel structurals and plate
   PDM Steel Service Centers, Inc ...........................
   Phoenix Corporation
     Phoenix Metals Company ..................................                  7    Flat-rolled aluminum, stainless steel and
                                                                                       coated carbon steel
                                                                                10   Toll processing (slitting, leveling, blanking) of
   Precision Strip, Inc. ..............................................
                                                                                       aluminum, stainless steel and carbon steel
   RSAC Canada Limited
     Encore Coils ......................................................        4    Flat-rolled carbon steel
     Encore Metals ....................................................         4    Stainless and alloy bar, plate and tube
     Encore Metals (USA) Inc. .................................                 3    Stainless and alloy bar, plate and tube
     Team Tube Canada ............................................              6    Alloy and carbon steel tubing
   Service Steel Aerospace Corp.
     Service Steel Aerospace .....................................              2    Stainless and alloy specialty steels
     United Alloys Aircraft Metals ............................                 1    Titanium products
   Siskin Steel & Supply Company, Inc.
     Siskin Steel .........................................................     4    Full-line service centers
     Athens Steel........................................................       1    Carbon steel structurals, flat-rolled and
                                                                                        ornamental iron
      East Tennessee Steel Supply ..............................                1    Carbon steel plate, bar and structurals
      Georgia Steel Supply Company .........................                    1    Full-line service center
      Industrial Metals and Surplus, Inc.....................                   1    Carbon steel structurals, flat-rolled and
                                                                                        ornamental iron
                                                                                1    Stainless steel sheet and coil
   Toma Metals, Inc..................................................
   Valex Corp.
     Valex ..................................................................   2    Electropolished stainless steel tubing and fittings
     Valex Korea Co., Ltd. ........................................             1    Electropolished stainless steel tubing and fittings
                                                                                2    Flat-rolled carbon steel
   Viking Materials, Inc............................................
                                                                                7    Stainless steel and aluminum plate, rod and bar
   Yarde Metals, Inc..................................................

     We serve our customers primarily by providing quick delivery, metals processing and inventory management services. We
purchase a variety of metals from primary producers and sell these products in small quantities based on our customers’ needs.
In connection with approximately 40% of our sales orders in 2006, we performed metals processing services, or first-stage
processing, before distributing the product to manufacturers and other end-users, often within 24 hours from receipt of an order,
if the order does not require extensive or customized processing. These services save time, labor, and expense for our customers
and reduce their overall manufacturing costs. During 2006, we handled approximately 17,275 transactions per business day,
with an average price of approximately $1,320 per transaction. Our net sales were $5.74 billion for the 2006 year. We believe
that our focus on small orders with quick turnaround differentiates us from many of the other large public metals service center
companies and allows us to generate higher profits than those companies.

    Historically, we have expanded both through acquisitions and internal growth. Since our initial public offering in September
1994, we have successfully purchased more than 40 businesses. In 2006, we significantly increased the size of our company
through acquisitions, primarily as a result of the Earle M. Jorgensen Company and Yarde Metals, Inc. acquisitions. From 1984
to September 1994, we acquired 20 businesses. We continue to evaluate acquisition opportunities and expect to continue to

                                                                                3
grow our business through acquisitions and internal growth initiatives, particularly those that will diversify our products,
customer base and geographic locations.

Acquisitions

     On August 1, 2006 we acquired Yarde Metals, Inc., a metals service center company headquartered in Southington,
Connecticut. We paid $100 million in cash for all of the outstanding common stock of Yarde Metals and assumed approximately
$101 million of its net debt. Yarde Metals was founded in 1976 and specializes in the processing and distribution of stainless
steel and aluminum plate, rod and bar products. Yarde has additional metals service centers in Pelham, New Hampshire; East
Hanover, New Jersey; Hauppauge, New York; High Point, North Carolina; Streetsboro, Ohio; and Limerick, Pennsylvania and a
sales office in Ft. Lauderdale, Florida. Yarde’s net sales for the five months ended December 31, 2006 were approximately
$181.7 million.

    On April 3, 2006 we completed the acquisition of Earle M. Jorgensen Company (“EMJ”) which was our first acquisition of
a public company. EMJ, headquartered in Lynwood, California, is one of the largest distributors of metal products in North
America with 40 service and processing centers. The transaction was valued at approximately $984 million, including the
assumption of EMJ’s net debt. We paid $6.50 in cash and issued .1784 of a share (split adjusted) of Reliance common stock for
each share of EMJ common stock outstanding. This also was the first acquisition where we used our stock as consideration.
EMJ’s net sales for the nine months ended December 31, 2006 were approximately $1.45 billion.

    On March 27, 2006, through Precision Strip, Inc. (“Precision Strip”), a wholly-owned subsidiary, we completed the
acquisition of certain assets and business of Flat Rock Metal Processing, LLC. (“Flat Rock”). The Flat Rock toll processing
businesses in Perrysburg, Ohio and Portage, Indiana, are operated by Precision Strip.

      In January 2006, we purchased the remaining 49.5% of American Steel, L.L.C. From its inception on July 1, 1995 through
April 30, 2002, we owned a 50% interest in the Membership Units of American Steel, which operates metals service centers in
Portland, Oregon and Kent, Washington and processes and distributes primarily carbon steel products. We retained operating
control over the assets and operations of American Steel. American Industries, Inc. owned the other 50% interest. Effective May
1, 2002, we increased our ownership to 50.5% of the outstanding Membership Units of American Steel and began consolidating
its financial results. We purchased American Industries’ 49.5% interest on January 3, 2006 and eliminated the related minority
interest expense.

     In October 2005, we formed Reliance Pan Pacific Pte., Ltd. (“RPP”) with our joint venture partner Manufacturing Network
Pte. Ltd. (“MNPL”). We own 70% of RPP and MNPL owns the remaining 30%. On March 1, 2006, RPP acquired 100% of the
outstanding equity interest in Everest Metals (Suzhou) Co., Ltd. (“Everest Metals”), a metals service center company near
Shanghai, People’s Republic of China. Everest Metals was previously wholly owned by MNPL. Everest Metals sells aluminum
products to the Chinese electronics market and had sales for the ten months ended December 31, 2006 of approximately $5.8
million.

     On July 1, 2005, we acquired all of the outstanding capital stock of Chapel Steel Corp. (“Chapel Steel”), a privately held
metals service center company founded in 1972 that processes and distributes carbon and alloy steel plate products from five
facilities in Pottstown (Philadelphia), Pennsylvania; Bourbonnais (Chicago), Illinois; Houston, Texas; Birmingham, Alabama;
and Portland, Oregon. Chapel Steel also warehouses and distributes its products in Cincinnati, Ohio and Hamilton, Ontario,
Canada. Chapel Steel is headquartered in Spring House (Philadelphia), Pennsylvania. We paid approximately $94.2 million in
cash for the equity of Chapel Steel and assumed approximately $16.8 million of Chapel Steel’s debt. Chapel Steel’s net sales for
2006 were approximately $341.9 million.

Recent Developments

     As of February 1, 2007 we acquired the net assets and business of the Encore Group of metals service center companies
(Encore Metals, Encore Metals (USA), Inc., Encore Coils, and Team Tube in Canada) headquartered in Edmonton, Alberta,
Canada. Encore was organized in 2004 in connection with the buyout by management and a private equity fund managed by
HSBC Capital (Canada) Inc. of certain former Corus CIC and Corus America businesses. Encore specializes in the processing
and distribution of alloy and carbon bar and tube, as well as stainless steel sheet, plate and bar and carbon steel flat-rolled
products, through its 17 facilities located mainly in Western Canada. Encore’s unaudited net sales for the year ended December
31, 2006 were approximately C$259 million. We acquired the Encore Group assets through RSAC Canada Limited, our wholly-
owned Canadian subsidiary, and RSAC Canada (Tube) ULC, its wholly-owned subsidiary.


                                                               4
On January 2, 2007, we acquired Crest Steel Corporation (“Crest”), a metals service center company headquartered in
Carson, California with facilities in Riverside, California and Phoenix, Arizona. Crest was founded in 1963 and specializes in the
processing and distribution of carbon steel products including flat-rolled, plate, bars and structurals. Crest’s unaudited net sales
for the year ended December 31, 2006 were approximately $133 million.

    Also, on January 2, 2007, our wholly-owned subsidiary, Siskin Steel & Supply Company, Inc., based in Chattanooga,
Tennessee, acquired Industrial Metals and Surplus, Inc. (“Industrial Metals”) a metals service center company headquartered in
Atlanta, Georgia and a related company, Athens Steel, Inc. located in Athens, Georgia. Industrial Metals was founded in 1978
and specializes in the processing and distribution of carbon steel structurals, flat-rolled and ornamental iron products. Industrial
Metals’ unaudited net sales (including Athens Steel) for the year ended December 31, 2006 were approximately $105 million.
Athens Steel, Inc. was merged with and into Industrial Metals which now operates as a wholly-owned subsidiary of Siskin.
Siskin’s Georgia Steel Supply Company division located in Atlanta will be combined with the Industrial Metals operation in
2007.

Other Developments

     In 2006, we experienced substantial organic growth by opening new facilities, building or expanding facilities and adding
processing equipment. In 2006, Liebovich Bros. opened a new location near Green Bay, Wisconsin to further penetrate that
geographic area and expanded its Cedar Rapids, Iowa location. Phoenix Metals Company opened a new location near
Philadelphia, Pennsylvania in 2006 as a new entry into that geographic region. Phoenix Metals also relocated an existing
operation to a new, larger more efficient facility in Birmingham, Alabama; is building a new facility for its Charlotte, North
Carolina operation; and is adding processing equipment in both of these locations to better support its customers in those areas.
Allegheny Steel Distributors expanded its Indianola, Pennsylvania facility to make room for additional equipment to help
support its increased business. Siskin Steel & Supply Company is expanding its Chattanooga, Tennessee warehouse. Precision
Strip is expanding its Talladega, Alabama facility and added processing equipment in its Talladega and Bowling Green,
Kentucky locations in 2006. Also in 2006, Toma Metals, Inc. expanded its Johnstown, Pennsylvania facility and Service Steel
Aerospace relocated its United Alloys Aircraft Metals division to a larger facility near Los Angeles, California. Earle M.
Jorgensen Company opened a satellite location in Lafayette, Louisiana in April 2006 and relocated its Portland, Oregon
operation to a new, larger more efficient facility in early 2007. EMJ also expanded its Kansas City facility in 2006. AMI Metals
Europe, S.P.R.L., expanded its warehouse facility in Belgium to better service its increased share of the European aerospace
business. In 2006, Valex Korea Co., Ltd., a 99%-owned subsidiary of Valex Corp., based near Seoul, South Korea, expanded its
facility. The current environment supports strong organic growth and we expect to continue to expand our business in 2007 by
continuing to build and expand facilities and add processing equipment.

    Due to the increased size of our company, late in 2006 we recapitalized the Company by issuing $600 million of debt
securities, increasing the availability of our credit facility to $1.1 billion, and repurchasing approximately $250 million of
outstanding 9.75% senior secured notes of EMJ. These activities lowered our cost of capital and provide for our future growth.

     We formed RSAC Management Corp., a California corporation, in 1999 to operate as a holding company for our
subsidiaries and to provide administrative and management services to our metals service centers. Our executive officers
maintain a control environment that is focused on integrity and ethical behavior, establish general policies and operating
guidelines and monitor adherence to proper financial controls, while our division managers and subsidiary officers have virtual
autonomy with respect to day-to-day operations. This balanced, yet entrepreneurial, management style has enabled us to
improve the productivity and profitability both of acquired businesses and of our own expanded operations. Division managers
and other management personnel are eligible for incentive compensation based, in part, on the profitability of their particular
division or subsidiary and, in part, on the Company’s overall profitability.

    We seek to increase our profitability by expanding our existing operations and acquiring businesses that diversify or enhance
our customer base, product range, processing services and geographic coverage. We have developed and maintained an
excellent reputation in the industry for our integrity and the quality and timeliness of our service to customers.

Customers

    Our customers purchase from us and other metals service centers to obtain value-added metals processing, readily available
inventory, reliable and timely delivery, flexible minimum order size and quality control. Many of our customers deal exclusively
with service centers because the quantities of metal products that they purchase are smaller than the minimum orders specified
by mills, because those customers require intermittent deliveries over long or irregular periods, or because those customers
require specialized processing services. We believe that metals service centers have also enjoyed an increasing share of total
metal shipments due to the focus of the capital goods and other manufacturing industries on just-in-time inventory management
                                                                 5
and materials management outsourcing, and because metal producers have reduced in-house direct sales efforts to small sporadic
purchasers in order to enhance their production efficiency.

     We have more than 125,000 metals service center customers in various industries. In 2006, no single customer accounted
for more than 1.5% of our sales, and approximately 80% of our orders were from repeat customers. Our customers are manu-
facturers and end-users in the general manufacturing, construction (mainly non-residential), transportation (rail, truck trailer and
shipbuilding), aerospace, energy, electronics and semiconductor fabrication and related industries. In 2003, many of our
suppliers also became our customers as a result of our purchase of Precision Strip, which typically sells processing services, but
not metal, to larger customers, such as mills and original equipment manufacturers (OEM’s), and in larger annual volumes than
we have experienced historically. Precision Strip has also indirectly increased our participation in the auto and appliance end
markets. Our metals service centers wrote and delivered over 4,095,000 orders during 2006 at an average price of approximately
$1,320. Most of our metals service center customers are located within a 200-mile radius of the metals service center serving
them. The proximity of our centers to our customers helps us provide just-in-time delivery to our customers. With our fleet of
approximately 1,265 trucks (some of which are leased), we are able to service many smaller customers. Moreover, our
computerized order entry system and flexible production scheduling enable us to meet customer requirements for short lead
times and just-in-time delivery. In 2006, our international presence increased significantly through the Canadian service centers
of EMJ. Approximately 5% of our sales were to international customers in 2006, with approximately 62% of these sales to
Canadian customers. Approximately 57% of our Canadian sales were made by our EMJ Canada locations. We believe that our
long-term relationships with many of our customers significantly contribute to the success of our business. Providing prompt
and efficient services and quality products at reasonable prices are important factors in maintaining these relationships.

    Customer demand may change from time to time based on, among other things, general economic conditions and industry
capacity. Many of the industries in which our customers compete are cyclical in nature. Because we sell to a wide variety of
customers in several industries, we believe that the effect of such changes on us is significantly reduced. However, from 2001
through August 2003, we experienced lower sales levels due to a broad-based economic downturn that affected all industries.
We experienced lower demand in each successive year from 2000 until September 2003 when we experienced an improvement
in our customer demand, as well as pricing, for most of the products we sell. Customer demand levels continued to increase in
2004. In 2005, demand rose for some of our products (primarily those related to aerospace) and for other products was fairly
steady with 2004 levels, until late 2005 when we saw significant increases in many markets, especially the non-residential
construction market. The improved demand levels continued through 2006, with strength in almost all of our end markets.

     Pricing for carbon steel products increased to record highs in 2004, primarily due to raw material shortages for the mills
which increased their costs, and due to reduced supply resulting from the shutdown of some domestic capacity and from
increased global demand that reduced the amount of import material available in the U.S. as it was re-routed to strong foreign
markets such as China. Although carbon steel prices declined during most of 2005, they rebounded slightly in late 2005 and
continued to increase through the first half of 2006, and then prices for certain products began to decline. The range of volatility
in carbon steel prices has moderated and pricing is at relatively high levels. Pricing for aluminum and stainless steel products
increased steadily throughout 2005 as demand increased, especially for aerospace products. There were significant and rapid
increases for both pricing and demand of aerospace products throughout 2005, with increases continuing into 2006 but at a lesser
rate than in 2005. Pricing for stainless steel products increased significantly throughout 2006, mainly because of global nickel
shortages, and are at historical highs.

     California was our largest market for many years, but we have expanded our geographic coverage in recent years and the
Midwest region of the United States has become our largest market followed closely by the Southeast region. Although our sales
dollars in each of these regions have increased, the percent of total sales in each region has changed due to our growth.
California represented 17% of our 2006 sales, which was a significant decrease from 45% of our 1997 sales. The Southeast
region of the United States represented 20% of our 2006 sales compared to 18% of our 1997 sales, and the Midwest region,
which we entered in 1999 and is now our largest market, represented 23% of our 2006 sales. Our 2006 acquisitions continued
our geographic diversification, especially in the Midwest, and facilitated our entry into the Northeast. The geographic breakout
of our sales for 2006 was as follows: Midwest – 23%; Southeast – 20%; California – 17%; West/Southwest – 15%; Pacific
Northwest – 9%; Mountain – 5%; Mid-Atlantic – 4%; International – 4%; Northeast – 3%.

Suppliers

    We purchase our inventory from the major metals mills, both domestic and foreign, and have multiple suppliers for all of
our product lines. Our major suppliers of domestic carbon steel products include California Steel Industries, Inc., Chaparral
Steel Company, IPSCO, Inc., Mittal Steel, Nucor Corporation, Oregon Steel Mills, Steel Dynamics, Inc. and United States Steel
Corporation. Allegheny Technologies Incorporated, AK Steel, and North American Stainless supply stainless steel products.


                                                                 6
We are a recognized distributor for various major aluminum companies, including Alcoa Inc, Alcan Aluminum Limited, Aleris
International, Inc. (formerly Commonwealth Aluminum Corp.) and Kaiser Aluminum Corp.

     During 2001 through 2003, many domestic steel mills entered bankruptcy proceedings and certain of those mills temporarily
closed a portion of their production capacity. Beginning in 2003 and continuing into 2004, many of the bankrupt mill facilities
were acquired and some production was re-started. Mill pricing for steel products stabilized in mid-2003 mainly because of the
consolidation that occurred at the mill level that improved capacity and mill-pricing discipline. Beginning in late 2003, steel
mills began to experience significant increases in their raw material costs due to shortages caused by increased global demand.
In 2004 they instituted surcharges on top of base price increases and consistently implemented significant increases through most
of 2004. In 2005 and 2006, the domestic mills exercised pricing discipline by shutting down excess capacity, when appropriate,
which has provided a more stable pricing environment, and at relatively high levels, than our industry has experienced
historically. Costs for aluminum and stainless steel products continued to increase steadily throughout 2004 and 2005.
Aluminum prices continued to increase somewhat in 2006 and then leveled off at relatively high levels. Costs for specialty
aluminum and stainless steel products sold to the aerospace industry increased significantly in 2005 and 2006 due to limited
supply caused by strong demand, and due to increased raw material costs. Stainless steel costs increased significantly in 2006,
primarily due to the global shortage of nickel that is used in stainless steel production. The nickel shortage is due to various
factors, including the closure of mines due to strikes and fires, some of which is expected to be temporary.

     Because of our total volume of purchases and our long-term relationships with our suppliers, we believe that we are
generally able to purchase inventory at the best prices offered by the suppliers, given the order size. We believe that we are not
dependent on any one of our suppliers for metals. In 2004, when carbon steel supply was tight, we believe that these
relationships provided an advantage to us in our ability to source product and have it available for our customers. Also, mill
consolidation has somewhat reduced the number of suppliers. The favorable market conditions being experienced in the U.S.
could cause new capacity to be built or could cause foreign mills to increase their exports to the U.S. In 2006, China became a
net exporter of metals which caused concern about the impact on the U.S. and other markets. We have not seen a significant
disruption in the U.S. market because of this; however, continued and increased imports of Chinese metals into the U.S. market
could negatively impact pricing.

Backlog

    Because of the just-in-time delivery policy and the short lead-time nature of our business, we do not believe the information
on backlog of orders is material to an understanding of our metals service center business.

Products and Processing Services

    We provide a wide variety of processing services to meet each customer’s specifications and deliver products to fabricators,
manufacturers and other end users. We maintain a wide variety of products in inventory. Flat-rolled carbon steel products are
generally the most volatile and competitive products in terms of pricing and account for only about 10% of our 2006 sales. For
orders other than those requiring extensive or specialized processing, we often deliver to the customer within 24 hours after
receiving the order. Our 2006 sales were comprised of the following approximate percentages of products or services:

                                        • 13%     carbon steel plate
                                        • 10%     carbon steel tubing
                                        • 9%      carbon steel bar
                                        • 7%      carbon steel structurals
                                        • 5%      galvanized steel sheet and coil
                                        • 3%      hot rolled steel sheet and coil
                                        • 2%      cold rolled steel sheet and coil
                              Carbon     49%

                                        •         heat-treated aluminum plate
                                             6%
                                        •         aluminum bar and tube
                                             6%
                                        •         common alloy aluminum sheet and coil
                                             4%
                                        •         common alloy aluminum plate
                                             1%
                                        •         heat-treated aluminum sheet and coil
                                             1%
                          Aluminum          18%


                                                                   7
•         stainless steel bar and tube
                                             8%
                                        •         stainless steel sheet and coil
                                             6%
                                        •         stainless steel plate
                                             3%
                                        •         electropolished stainless steel tubing and fittings
                                             1%
                            Stainless       18%

                                        • 5% alloy bar and tube
                                        • 1% alloy plate, sheet and coil
                                Alloy     6%

                                        • 2% toll processing of aluminum, carbon steel and stainless steel
                                        • 7% miscellaneous, including brass, copper and titanium


    We do not depend on any particular customer group or industry because we process a variety of metals. Because of this
diversity of product type and material, we believe that we are less exposed to fluctuations or other weaknesses in the financial or
economic stability of particular customers or industries. We also are less dependent on particular suppliers.

     For sheet and coil products, we purchase coiled metal from primary producers in the form of a continuous sheet, typically 36
to 60 inches wide, between .015 and .25 inches thick, and rolled into 3- to 20-ton coils. The size and weight of these coils
require specialized equipment to move and process the coils into smaller sizes and various products. Many of the other products
that we carry also require specialized equipment. Few of our customers have the capability to process the metal into the desired
products.

    After receiving an order, we enter it into our computerized order entry system, select appropriate inventory and schedule the
processing to meet the specified delivery date. In 2006, we delivered more than 40% of our orders within 24 hours. We attempt
to maximize the yield from the various metals that we process by combining customer orders to use each product that we
purchase to the fullest extent practicable.

    Few metals service centers offer the full scope of processing services and metals that we provide. In 2006, we performed
processing services for approximately 40% of our sales orders. Our primary processing services are described below:

         •   Bar turning involves machining a metal bar into a smaller diameter.
         •   Bending is the forming of metals into various angles.
         •   Blanking is the cutting of metals into close-tolerance square or rectangular shapes.
         •   Deburring is the process used to smooth the sharp, jagged edges of a cut piece of metal.
         •   Electropolishing is the process used on stainless steel tubing and fittings to simultaneously smooth, brighten, clean
             and passivate the interior surfaces of these components. Electropolishing is an electrochemical removal process
             that selectively removes a thin layer of metal, including surface flaws and imbedded impurities. Electropolishing is
             a required surface treatment for all ultra high-purity components used in the gas distribution systems of
             semiconductor manufacturers worldwide and many sterile water distribution systems of pharmaceutical and
             biotechnology companies.
         •   Fabricating includes performing second- and/or third-stage processing per customer specifications, typically to
             provide a part, casing or kit which is used in the customer’s end product.
         •   Forming involves bending and forming plate or sheet products into customer-specified shapes and sizes with press
             brakes.
         •   Grinding or blanchard grinding involves grinding the top and/or bottom of carbon or alloy steel plate or bars into
             close tolerance.
         •   Leveling (cutting-to-length) involves cutting metal along the width of a coil into specified lengths of sheets or
             plates.
         •   Machining refers to performing multiple processes to a piece of metal to produce a customer-specified component
             part.
         •   Oscillate slitting involves slitting the metal into specified widths and then oscillating the slit coil when it is wound.
             The oscillated coil winds the strip metal similar to the way fishing line is wound on a reel rather than standard
             ribbon winding. An oscillate coil can typically hold five to six times more metal than a standard coil, which allows


                                                                   8
customers to achieve longer production run times by reducing the number of equipment shut-downs to change
             coils.
         •   Pipe threading refers to the cutting of threads around the circumference of the pipe.
         •   Polishing changes the texture of the surface of the metal to specific finishes in accordance with customer
             specifications.
         •   Precision plate sawing involves sawing plate (primarily aluminum plate products) into square or rectangular shapes
             to tolerances as close as 0.003 of an inch.
         •   Punching is the cutting of holes into carbon steel beams or plates by pressing or welding per customer speci-
             fications.
         •   Routing produces various sizes and shapes of aluminum plate according to customer-supplied drawings through the
             use of CNC controlled machinery.
         •   Sawing involves cutting metal into customer-specified lengths, shapes or sizes.
         •   Shape cutting, or burning, can produce various shapes according to customer-supplied drawings through the use of
             CNC controlled machinery. This procedure can include the use of oxy-fuel, plasma, high-definition plasma, laser
             burning or water jet cutting for carbon, aluminum and stainless steel sheet and plate.
         •   Shearing is the cutting of metal into small, precise square or rectangular pieces.
         •   Skin milling grinds the top and/or bottom of a large aluminum plate into close tolerance.
         •   Slitting involves cutting metal to specified widths along the length of the coil.
         •   Tee splitting involves splitting metal beams. Tee straightening is the process of straightening split beams.
         •   Twin milling grinds one or all six sides of a small square or rectangular piece of aluminum plate into close
             tolerance.
         •   Welding is the joining of one or more pieces of metal.
         •   Wheelabrating, shotblasting and bead-blasting involve pressure blasting metal grid onto carbon steel products to
             remove rust and scale from the surface.

     We generally process specific metals to non-standard sizes only at the request of customers pursuant to purchase orders. We
do not maintain a significant inventory of finished products, but we carry a wide range of metals to meet the short lead time and
just-in-time delivery requirements of our customers. Our metals service centers maintain inventory and equipment selected to
meet the needs of that facility’s customers.

Marketing

     As of year-end 2006, we had approximately 1,300 sales personnel located in 41 states, Belgium, Canada, China, France,
South Korea and the United Kingdom that provide marketing services throughout each of those areas, as well as nearby
locations. The sales personnel are organized by division or subsidiary among our profit centers and are divided into two groups.
Our outside sales personnel are considered those personnel who travel throughout a specified geographic territory to maintain
relationships with our existing customers and develop new customers. Those sales personnel who remain at the facilities to write
and price orders are our inside sales personnel. The inside sales personnel generally receive incentive compensation, in addition
to their base salary, based on the gross profit or pretax profit of their particular profit center. The outside sales personnel
generally receive incentive compensation based on the gross profit from their particular geographic territories.

Industry and Market Cycles

     We distribute metal products to our customers in a variety of industries, including construction, manufacturing, trans-
portation, aerospace, energy and semiconductor fabrication. Many of the industries in which our customers compete are cyclical
in nature and are subject to changes in demand based on general economic conditions. We sell to a wide variety of customers in
diverse industries to reduce the effect of changes in these cyclical industries on our results. During 2001 and 2002 and until
August 2003, all of the industries to which we sell experienced low demand levels due to the poor economic conditions in the
U.S. Demand for most of our products improved beginning in September 2003 and the improvement continued through most of
2004 and 2005 for some of our products. In late 2005, we saw improvement in demand for most products that we sell, especially
for non-residential construction, which we believe is our largest end market measured by our net sales to this market. The
improved demand levels continued through 2006. Our results were significantly impacted by the economic downturn from 2001
through 2003, but reacted positively to the favorable pricing environment that began in 2004 and has continued. This
environment, combined with our acquisitions, has resulted in record profitability levels for us in each year since 2004. A
significant drop in current pricing levels or demand could result in a negative impact to our financial results. However, if current
pricing levels do not change significantly and demand improves, our financial results could be positively impacted.


                                                                 9
The semiconductor fabrication industry, aerospace industry, energy (oil and gas), and truck trailer and rail car industries
have historically experienced cycles that may have an impact on our results if they repeat in the future. The semiconductor
fabrication industry is highly cyclical in nature and is subject to changes in demand based on, among other things, general
economic conditions and industry capacity. There has been a substantial shift in this market, with many U.S. companies moving
their semiconductor fabrication operations to Asia. We are participating in the Asian market through our Valex Korea
subsidiary.

    In 2003, aerospace demand remained fairly consistent with the low levels experienced in 2002, but in 2004 we experienced
steady improvement throughout the year. Aerospace demand, as well as pricing, increased rapidly and significantly throughout
2005. Demand remained strong through 2006 and pricing continued to increase, although at a more moderate rate than in 2005.

   With our acquisition of EMJ in April 2006, we gained exposure to the oil and gas market, which is a volatile industry.
Demand and pricing are currently at high levels which has favorably impacted our 2006 financial results. Our acquisition of
Encore in early 2007 increases our exposure to the oil and gas industry.

    The heavy truck, truck trailer and rail car industries experienced a substantial slowing in demand beginning in 2000 that
continued through 2002, which materially impacted our operations in the Pacific Northwest. We did experience some
improvement for short periods during 2003 and saw significant improvements in truck trailer demand throughout 2004 that
continued at healthy levels in 2005 and 2006.

     Fluctuations in the cost of our materials also affect the prices we can charge to our customers. By selling a diverse product
mix, we are able to somewhat offset fluctuations in our costs of materials. However, because of weak demand and overcapacity
at the producer level in both domestic and foreign markets in 2001, the costs of most metal products reached their lowest levels
experienced in over 20 years. Due to the continued low demand, costs of most metals remained at or near the 2001 levels
throughout 2002 and most of 2003. However, costs of carbon steel flat-rolled products increased significantly in the second half
of 2002 due to supply constraints as a result of certain producers reducing capacity and government restrictions on foreign
imports. These increased costs began to decline slightly near the end of 2002 and early 2003 because of the continued low end-
user demand. In the second half of 2003, costs for carbon steel products again increased significantly and rapidly due to
improved demand and increased scrap, raw material and energy costs for steel producers. This trend continued through most of
2004 with pricing at all time highs. Increased global demand limited availability of many of these products in the U.S. allowing
the significant increases in prices. During the fourth quarter of 2004, increased amounts of import material arrived in the U.S.
putting some downward pressure on pricing for carbon steel products. In the first eight months of 2005, there was downward
pressure on carbon steel prices which we believe was mainly due to excess inventory in the supply chain. Pricing for carbon
steel products improved in late 2005 in part due to increased end user demand. Prices for carbon steel products remained at high
levels, and experienced some increases, in 2006, until the latter part of the year when lower demand along with increased imports
resulted in high inventory levels at distributors causing pricing pressures. However, pricing remains at strong levels and certain
domestic mills reduced capacity in early 2007 and pricing improved somewhat. Costs for aluminum and stainless steel products
increased in the second half of 2003 and throughout 2004 and 2005 due to supply constraints and improved customer demand.
Aluminum costs increased somewhat in 2006 and have leveled off at relatively high prices. Pricing for aerospace related
aluminum, stainless steel and titanium products experienced significant cost increases in 2005 which we believe was due to
improved demand and supply constraints that continued into 2006 although the increases were more moderate than in 2005
except for stainless steel products. Stainless steel costs increased significantly in 2006 due to nickel shortages. Overall, most
products that we sell are at or near historically high price levels due to supply issues and strong end market demand.

     We have historically been able to pass increases in metal costs on to our customers as costs typically increase due to strong
demand. In 2004, supply limitations for carbon steel products allowed us to pass through significant cost increases well in
advance of our receipt of the higher cost material, which resulted in significantly higher gross profit margins in 2004, especially
in the 2004 second quarter. Our gross profit margins declined somewhat from 2004 levels in 2005 because of declining costs
during the first eight months of 2005. Our gross profit margins in 2006 were fairly consistent with 2005 levels until the end of
the year when increased supply in the U.S. caused some pressure on pricing. Due to supply limitations in 2005, we were able to
increase our selling prices for aerospace products more than our costs increased, raising our 2005 gross profit margins for these
products. Our margins on aerospace products continued at strong levels in 2006. We cannot guarantee that the margin between
our metal costs and selling prices will remain at the levels experienced during 2006, especially if demand declines or if costs of
domestic metals decline due to increased availability or reduced global demand. If metals costs and related selling prices remain
at current levels or increase, we should be able to record consistent or increased revenue and gross profit dollars on a consistent
volume basis.


                                                                10
Competition

     The metals distribution industry is highly fragmented and competitive. We have numerous competitors in each of our
product lines and geographic locations, although competition is most frequently local or regional. Most of our competitors are
smaller than we are, but we still face strong competition from national, regional and local independent metals distributors and the
producers themselves, some of which have greater resources than we do. As reported in the May 2003 issue of Purchasing
magazine, it is estimated that there were approximately 3,500 intermediate steel processors and metals service center facilities in
North America in 2003. Purchasing magazine has identified us as the second largest metals service center company in North
America (based upon 2005 revenue). According to the May 2006 issue of the magazine Purchasing, the 2005 revenues for the
five largest North American metals service center companies ranged from $2.1 billion to $5.8 billion for total revenues of
$16.3 billion, which represents approximately 14% of the estimated $115 billion of total revenue for the metals service center
industry in 2005. Reliance’s 2005 sales of $3.4 billion represented approximately 3% of the estimated $115 billion industry
total. Because of the significant acquisitions that we have made in 2006, beginning with the second quarter of 2006, we are now
the largest North American metals service center company based on quarterly revenues (as reported in SEC filings). We
compete with other companies on price, service, quality and availability of products. We maintain centralized relationships with
our major suppliers and a decentralized operational structure. We believe that this division of responsibility has increased our
ability to obtain competitive prices of metals and to provide more responsive service to our customers. In addition, we believe
that the size of our inventory, the different metals and products we have available, and the wide variety of processing services we
provide, distinguish us from our competition. We believe that we have increased our market share during recent years due to our
strong financial condition, our high quality of service, our acquisitions and opportunities created by activities of certain of our
competitors.

Quality Control

     Procuring high quality metal from suppliers on a consistent basis is critical to our business. We have instituted strict quality
control measures to assure that the quality of purchased raw materials will enable us to meet our customers’ specifications and to
reduce the costs of production interruptions. We perform physical and chemical analyses on selected raw materials to verify that
their mechanical and dimensional properties, cleanliness and surface characteristics meet our requirements. We conduct similar
analyses on selected processed metal before delivery to the customer. We believe that maintaining high standards for accepting
metals ultimately results in reduced return rates from our customers.

     In 2006, 22 divisions and eight subsidiaries of Reliance, at a total of 73 facilities, have maintained ISO 9002 certifications
and were certified for ISO 9001-2000, but we do not expect to obtain the certification for any additional facilities at this time.
As of December 15, 2003, ISO 9001-2000 replaced ISO 9002. The ISO 9001-2000 quality standard added a matrix to record
and review customer satisfaction and reorganized the requirements for the quality standard from 20 elements to eight elements.
The certification takes approximately one year to obtain. Each facility seeking ISO certification is required to establish a quality
system that is documented in a quality control manual and that affects all aspects of the facility's operations, including sales,
product inspections, product storage, delivery and documentation. A certifying agent performs a physical audit of each facility
every six months to determine that the facility is in fact following the procedures set forth in the quality control manual. A
recertification is required for each facility every three years. Initially in 1996, when we first began the certification process, we
expected that more customers would require such certification, but we have learned that for the types of products and services
which most of our facilities provide, very few of our customers require such certification and most of our customers have
responded that they would purchase products from Reliance or its subsidiaries regardless of such certification. However, we
believe that going through the certification process allowed our facilities to improve their efficiency and the quality of products
and services provided to our customers.

     In addition, our subsidiary Precision Strip maintains ISO/TS 16949:2002 certifications at eight of its ten facilities. The two
facilities acquired in 2006 are in the process of becoming ISO/TS 16949:2002 certified. ISO/TS 16949:2002 is an ISO Technical
Specification, which aligns existing American (QS-9000), German (VDA6.1), French (EAQF) and Italian (AVSQ) automotive
quality systems standards within the global automotive industry. Quality System Requirements QS-9000 (“QS-9000”) is the
common quality standard for automotive suppliers and is based upon the 1994 edition of ISO 9001, with additional requirements
specific to the automotive industry. The International Automotive Sector Group is an international ad hoc working group that
monitors interpretation issues related to the standard.

Systems

   We have converted our Reliance divisions and certain of our subsidiaries from various software programs to the Stelplan™
manufacturing and distribution information system. Stelplan™ is a registered trademark of Invera, Inc. Stelplan™ is an

                                                                 11
integrated business application system with functions ranging from order entry to the generation of financial statements.
Stelplan™ was developed specifically for the metals service center and processor industry. Stelplan™ also provides information
in real time, such as inventory availability, location and cost. With this information, our marketing and sales personnel can
respond to our customers’ needs more efficiently and more effectively.

     Certain of our subsidiaries use other vendor or in-house developed systems to support their operations, including EMJ that
has 41 locations. The basic functionality of the software is similar to Stelplan™ but in many instances has been designed
specifically for each of their operations with features to accommodate the products that they carry, automated equipment
interfaces, or other specialized needs. These systems are included in our internal control testing. A common financial reporting
system is used company-wide.

Government Regulation

     Our metals service centers are subject to many foreign, federal, state and local requirements to protect the environment,
including hazardous waste disposal and underground storage tank regulations. The only hazardous substances that we generally
use in our operations are lubricants, cleaning solvents and petroleum for fueling our trucks. We pay state-certified private
companies to haul and dispose of our hazardous waste.

    Our operations are also subject to laws and regulations relating to workplace safety and worker health, principally the
Occupational Health and Safety Act and related regulations, which, among other requirements, establish noise, dust and safety
standards. We maintain comprehensive health and safety policies and encourage our employees to follow established safety
practices. We do not anticipate that future compliance with such laws and regulations will have a material adverse effect on our
results of operations or financial condition.

Environmental

    Some of the properties we own or lease are located in industrial areas with histories of heavy industrial use. We may incur
some environmental liabilities because of the location of these properties. In addition, we are currently investigating and
remediating contamination at certain properties we have acquired or that acquired subsidiaries previously owned, but we do not
expect that these liabilities would have a material adverse impact on our results of operations. All scrap metal produced by our
operations is sold to independent scrap metal companies and we believe is recycled.

Employees

     As of December 31, 2006, we had approximately 8,600 employees. Approximately 15% of the employees are covered by
collective bargaining agreements, which expire at various times over the next four years. We have entered into collective
bargaining agreements with 30 union locals at 34 of our locations. These collective bargaining agreements have not had a
material impact either favorably or unfavorably on our revenues or profitability at our various locations. We have always
maintained excellent relations with our employees. In 2005, we experienced a work stoppage by our drivers at one of our
locations, but it did not have a material impact on our operations at that location. This contract expired and the drivers at that
location are now non-union employees. We have never experienced a significant work stoppage.

Available Information

     We file annual, quarterly and current reports, proxy statements and other documents with the Securities and Exchange
Commission (“SEC”) under the Securities Exchange Act of 1934, as amended (“the Exchange Act”). The public may read and
copy any materials that we file with the SEC at the SEC’s Public Reference Room at 450 Fifth Street, N.W., Washington, DC
20549. The public may obtain information on the operation of the Public Reference Room by calling the SEC at 1-800-SEC-
0330. Also, the SEC maintains a Website that contains reports, proxy information statements and other information regarding
issuers, including our Company, that file electronically with the SEC. The public can obtain any documents that we file with the
SEC at http://www.sec.gov.

     We also make available free of charge on or through our Internet Website (http://www.rsac.com) our Annual Report on
Form 10-K, Quarterly Reports on Form 10-Q, Current Reports on Form 8-K and, if applicable, amendments to those reports filed
or furnished pursuant to Section 13(a) of the Exchange Act as soon as reasonably practicable after we electronically file such
material with, or furnish it to, the SEC. Reference to our Website is not intended to incorporate anything on the Website into this
report.


                                                                12
Item 1A. Risk Factors

Set forth below are the risks that we believe are material to our investors. Our business, results of operations and financial
condition may be materially adversely affected due to any of the following risks. The risks described below are not the only ones
we face. Additional risks of which we are not presently aware or that we currently believe are immaterial may also harm our
business. This section contains forward-looking statements. You should refer to the explanation of the qualifications and
limitations on forward-looking statements set forth at the beginning of this Report.

Risks Related to Our Business and Industry

Our indebtedness could impair our financial condition and reduce the funds available to us for other purposes and our
failure to comply with the covenants contained in our debt instruments could result in an event of default that could adversely
affect our operating results.

    We have substantial debt service obligations. As of December 31, 2006, we had aggregate outstanding indebtedness of
approximately $1.1 billion, with a significant increase in 2006 that is attributable to our 2006 acquisitions. This indebtedness
could adversely affect us in the following ways:

   •   our ability to obtain additional financing in the future for working capital, capital expenditures, acquisitions, general
       corporate purposes or other purposes may be impaired;

   •   a significant portion of our cash flow from operations must be dedicated to the payment of interest and principal on our
       debt, which reduces the funds available to us for our operations or other purposes;

   •   some of the interest on debt is, and will continue to be, accrued at variable rates, which may result in higher interest
       expense in the event of increases in interest rates, which may occur in 2007;

   •   because we may be more leveraged than some of our competitors, our debt may place us at a competitive disadvantage;

   •   our leverage may increase our vulnerability to economic downturns and limit our ability to withstand adverse events in
       our business by limiting our financial alternatives; and

   •   our ability to capitalize on significant business opportunities, including potential acquisitions, and to plan for, or respond
       to, competition and changes in our business may be limited.

     Our existing debt agreements contain, and our future debt agreements may contain, financial and restrictive covenants that
limit our ability to incur additional debt, including to finance future operations or other capital needs, and to engage in other
activities that we may believe are in our long-term best interests, including to dispose of or acquire assets or other companies or
to pay dividends to our shareholders. Our failure to comply with these covenants may result in an event of default which, if not
cured or waived, could accelerate the maturity of our indebtedness or prevent us from accessing availability under our credit
facility. If our indebtedness is accelerated, we may not have sufficient cash resources to satisfy our debt obligations and we may
not be able to continue our operations as planned.

We may not be able to generate sufficient cash flow to meet our existing debt service obligations.

     Our annual debt service obligations until November 8, 2011, when our revolving credit facility is scheduled to mature, will
be primarily limited to interest and principal payments on multiple series of privately placed senior notes and our outstanding
debt securities with an aggregate principal amount of $898 million, and on borrowings under our $1.1 billion credit facility. Our
ability to generate sufficient cash flow from operations to make scheduled payments on our debt obligations will depend on our
future financial performance, which will be affected by a range of economic, competitive and business factors, many of which
are outside of our control. For example, we may not generate sufficient cash flow from our operations or new acquisitions to
repay amounts drawn under our credit facility when it matures in 2011, our private notes when they mature on various dates
between 2007 and 2013, our debt securities when they mature in 2016 and 2036 or our industrial revenue bonds when they
mature in 2009 and 2014. If we do not generate sufficient cash flow from operations to satisfy our debt obligations, we expect to
undertake alternative financing plans, such as refinancing or restructuring our debt, selling assets, reducing or delaying capital
investments or seeking to raise additional capital. We may not be able to consummate any such transaction at all or on a timely
basis or on terms, and for proceeds, that are acceptable to us. These transactions may not be permitted under the terms of our
various debt instruments then in effect, however, our inability to generate sufficient cash flow to satisfy our debt obligations, or


                                                                13
to timely refinance our obligations on acceptable terms, could adversely affect our ability to serve our customers and could cause
us to reduce or discontinue our planned operations.

The costs that we pay for metals fluctuate due to a number of factors beyond our control, and such fluctuations could
adversely affect our operating results, particularly if we cannot pass on higher metal prices to our customers.

    We purchase large quantities of carbon, alloy and stainless steel, aluminum and other metals, which we sell to a variety of
end-users. In 2004 the costs for carbon steel increased significantly and rapidly from historically low levels. Although these costs
declined somewhat through mid-2005, the costs increased in the fourth quarter of 2005, with moderate increases in 2006. Overall
carbon steel costs remain at relatively high levels. Costs for aluminum products, excluding aerospace-related products, rose
steadily in 2004 with continued increases in 2005 and 2006. Costs for stainless steel products rose steadily in 2004 and increased
more rapidly in 2005 and 2006. Stainless steel costs are currently at unprecedented high levels, primarily due to the high nickel
surcharges resulting from low global nickel supply. Costs for aerospace-related products increased significantly beginning in late
2004 and continued to increase through all of 2005 and into 2006, although at a slower rate than in 2005. We attempt to pass
these cost increases on to our customers with higher selling prices but we may not always be able to do so. The costs to us for
these metals and the prices that we charge customers for our products may change depending on many factors outside of our
control, including general economic conditions (both domestic and international), competition, production levels, customer
demand levels, import duties and other trade restrictions, currency fluctuations and surcharges imposed by our suppliers.

     We maintain substantial inventories of metal to accommodate the short lead times and delivery requirements of our
customers. Our customers typically purchase products from us pursuant to purchase orders and typically do not enter into long-
term purchase agreements or arrangements with us. Accordingly, we purchase metal in quantities we believe to be appropriate to
satisfy the anticipated needs of our customers based on information derived from customers, market conditions, historic usage
and industry research. Commitments for metal purchases are generally at prevailing market prices in effect at the time orders are
placed or at the time of shipment. During periods of rising prices for metal, we may be negatively impacted by delays between
the time of increases in the cost of metals to us and increases in the prices that we charge for our products if we are unable to
pass these increased costs on to our customers immediately. In addition, when metal prices decline, customer demand for lower
prices could result in lower sale prices for our products and, as we use existing inventory that we purchased at higher metal
prices, lower margins. Consequently, during periods in which we use this existing inventory, the effects of changing metal prices
could adversely affect our operating results.

Our business could be adversely affected by economic downturns.

    Demand for our products is affected by a number of general economic factors. A decline in economic activity in the U.S.
and other markets in which we operate could materially affect our financial condition and results of operation.

The prices of metals are subject to fluctuations in the supply and demand for metals worldwide and changes in the worldwide
balance of supply and demand could negatively impact our revenues, gross profit and net income.

     Metal prices are volatile due to, among other things, fluctuations in foreign and domestic production capacity, raw material
availability, metals consumption and foreign currency rates. For example, in the past few years, China has significantly increased
both its consumption and production of metals and metal products. Initially, China’s large and growing demand for metals
significantly affected the metals industry by diverting supply to China and contributing to the global increases in metal prices.
With China’s increased production of metals, it has recently become a net exporter of certain metals and this has somewhat
reduced metal prices both within and outside of China. While this development can affect global pricing, it has yet to have a
significant impact on U.S. pricing or the pricing for our products. Any future downturn in China’s general economic conditions
or increases in its export of metals could cause a reduction in metal prices globally, which could adversely affect our revenues,
gross profit and net income. Additionally, significant currency fluctuations in the United States or abroad could negatively
impact our cost of metals and the pricing of our products. The decline in the dollar relative to foreign currencies in recent years
has resulted in increased prices for metals and metal products in the United States as imported metals have become relatively
more expensive. If, in the future, the dollar increases in value relative to foreign currencies, the U.S. market may be more
attractive to foreign producers, resulting in increased supply that could cause decreased metal prices and adversely affect our
revenues, gross profit and net income.

We operate in an industry that is subject to cyclical fluctuations and any downturn in general economic conditions or in our
customers’ specific industries could negatively impact our revenues, gross profit and net income.

    The metals service center industry is cyclical and impacted by both market demand and metals supply. Periods of economic
slowdown or recession in the United States or other countries, or the public perception that these may occur, could decrease the

                                                                14
reliance steel & aluminum  2006_Form_10K

More Related Content

What's hot

western digital 2278-001005-A02
western digital  2278-001005-A02western digital  2278-001005-A02
western digital 2278-001005-A02finance37
 
Realogy10-KFiling22509
Realogy10-KFiling22509Realogy10-KFiling22509
Realogy10-KFiling22509finance35
 
Arvinmeritor ARM_2008_Annual_Report
Arvinmeritor ARM_2008_Annual_ReportArvinmeritor ARM_2008_Annual_Report
Arvinmeritor ARM_2008_Annual_Reportfinance27
 
plains all american pipeline Table of Contents and Forward Looking Statement...
plains all american pipeline  Table of Contents and Forward Looking Statement...plains all american pipeline  Table of Contents and Forward Looking Statement...
plains all american pipeline Table of Contents and Forward Looking Statement...finance13
 
owens & minor 200610K
owens & minor  200610Kowens & minor  200610K
owens & minor 200610Kfinance33
 
comcast Annual Report on Form 10-K
 comcast Annual Report on Form 10-K   comcast Annual Report on Form 10-K
comcast Annual Report on Form 10-K finance8
 
plains all american Table of Contents and Forward Looking Statements 2007
plains all american Table of Contents and Forward Looking Statements  2007plains all american Table of Contents and Forward Looking Statements  2007
plains all american Table of Contents and Forward Looking Statements 2007finance13
 
starbucks 200710K
starbucks  200710Kstarbucks  200710K
starbucks 200710Kfinance41
 
boston scientific0710K
boston scientific0710Kboston scientific0710K
boston scientific0710Kfinance28
 
tenet healthcare 10K03082005
tenet healthcare 10K03082005tenet healthcare 10K03082005
tenet healthcare 10K03082005finance42
 
cit 10K20212cleannoban
cit 10K20212cleannobancit 10K20212cleannoban
cit 10K20212cleannobanfinance28
 
RR Donnelley 2005_10K
RR Donnelley  2005_10KRR Donnelley  2005_10K
RR Donnelley 2005_10Kfinance23
 
usg AR_10K2006
usg AR_10K2006usg AR_10K2006
usg AR_10K2006finance40
 
universal helath services 2003Financials
universal helath services  2003Financialsuniversal helath services  2003Financials
universal helath services 2003Financialsfinance49
 

What's hot (14)

western digital 2278-001005-A02
western digital  2278-001005-A02western digital  2278-001005-A02
western digital 2278-001005-A02
 
Realogy10-KFiling22509
Realogy10-KFiling22509Realogy10-KFiling22509
Realogy10-KFiling22509
 
Arvinmeritor ARM_2008_Annual_Report
Arvinmeritor ARM_2008_Annual_ReportArvinmeritor ARM_2008_Annual_Report
Arvinmeritor ARM_2008_Annual_Report
 
plains all american pipeline Table of Contents and Forward Looking Statement...
plains all american pipeline  Table of Contents and Forward Looking Statement...plains all american pipeline  Table of Contents and Forward Looking Statement...
plains all american pipeline Table of Contents and Forward Looking Statement...
 
owens & minor 200610K
owens & minor  200610Kowens & minor  200610K
owens & minor 200610K
 
comcast Annual Report on Form 10-K
 comcast Annual Report on Form 10-K   comcast Annual Report on Form 10-K
comcast Annual Report on Form 10-K
 
plains all american Table of Contents and Forward Looking Statements 2007
plains all american Table of Contents and Forward Looking Statements  2007plains all american Table of Contents and Forward Looking Statements  2007
plains all american Table of Contents and Forward Looking Statements 2007
 
starbucks 200710K
starbucks  200710Kstarbucks  200710K
starbucks 200710K
 
boston scientific0710K
boston scientific0710Kboston scientific0710K
boston scientific0710K
 
tenet healthcare 10K03082005
tenet healthcare 10K03082005tenet healthcare 10K03082005
tenet healthcare 10K03082005
 
cit 10K20212cleannoban
cit 10K20212cleannobancit 10K20212cleannoban
cit 10K20212cleannoban
 
RR Donnelley 2005_10K
RR Donnelley  2005_10KRR Donnelley  2005_10K
RR Donnelley 2005_10K
 
usg AR_10K2006
usg AR_10K2006usg AR_10K2006
usg AR_10K2006
 
universal helath services 2003Financials
universal helath services  2003Financialsuniversal helath services  2003Financials
universal helath services 2003Financials
 

Similar to reliance steel & aluminum 2006_Form_10K

GPI2006AR_Form10K
GPI2006AR_Form10KGPI2006AR_Form10K
GPI2006AR_Form10Kfinance45
 
tenet healthcare CY0810KFinal
tenet healthcare CY0810KFinaltenet healthcare CY0810KFinal
tenet healthcare CY0810KFinalfinance42
 
tenet healthcare CY0810KFinal
tenet healthcare CY0810KFinaltenet healthcare CY0810KFinal
tenet healthcare CY0810KFinalfinance42
 
starbucks 200710K
starbucks  200710Kstarbucks  200710K
starbucks 200710Kfinance41
 
cit B6ECBCC8-387D-47CD-8386-D05A207C86FB_34562pr11clean
cit B6ECBCC8-387D-47CD-8386-D05A207C86FB_34562pr11cleancit B6ECBCC8-387D-47CD-8386-D05A207C86FB_34562pr11clean
cit B6ECBCC8-387D-47CD-8386-D05A207C86FB_34562pr11cleanfinance28
 
cit B6ECBCC8-387D-47CD-8386-D05A207C86FB_34562pr11clean
cit B6ECBCC8-387D-47CD-8386-D05A207C86FB_34562pr11cleancit B6ECBCC8-387D-47CD-8386-D05A207C86FB_34562pr11clean
cit B6ECBCC8-387D-47CD-8386-D05A207C86FB_34562pr11cleanfinance28
 
owens & minor FD57D1A1-8F5F-4464-AC94-EB65DE35BF6C_2008_10-K
owens & minor  FD57D1A1-8F5F-4464-AC94-EB65DE35BF6C_2008_10-Kowens & minor  FD57D1A1-8F5F-4464-AC94-EB65DE35BF6C_2008_10-K
owens & minor FD57D1A1-8F5F-4464-AC94-EB65DE35BF6C_2008_10-Kfinance33
 
dish network annual reports 2000
dish network annual reports 2000dish network annual reports 2000
dish network annual reports 2000finance24
 
REALOGY_10_filing_K3_19_08
REALOGY_10_filing_K3_19_08REALOGY_10_filing_K3_19_08
REALOGY_10_filing_K3_19_08finance35
 
REALOGY_10_filing_K3_19_08
REALOGY_10_filing_K3_19_08REALOGY_10_filing_K3_19_08
REALOGY_10_filing_K3_19_08finance35
 
dish network annual reports 2002
dish network annual reports 2002dish network annual reports 2002
dish network annual reports 2002finance24
 
RR Donnelley 2002_Form_10K
RR Donnelley  2002_Form_10KRR Donnelley  2002_Form_10K
RR Donnelley 2002_Form_10Kfinance23
 
Realogy10-KFiling22509
Realogy10-KFiling22509Realogy10-KFiling22509
Realogy10-KFiling22509finance35
 
tenet healthcare CY0610KFINAL
tenet healthcare CY0610KFINALtenet healthcare CY0610KFINAL
tenet healthcare CY0610KFINALfinance42
 
dish network annual reports 2001
dish network annual reports 2001dish network annual reports 2001
dish network annual reports 2001finance24
 
dish network annual reports 1999
dish network annual reports 1999dish network annual reports 1999
dish network annual reports 1999finance24
 
calpine 10K_2006
calpine 10K_2006calpine 10K_2006
calpine 10K_2006finance29
 
calpine 10K_2006
calpine 10K_2006calpine 10K_2006
calpine 10K_2006finance29
 
universal helath services 2003Financials
universal helath services  2003Financialsuniversal helath services  2003Financials
universal helath services 2003Financialsfinance49
 
cit 2007_10-K
cit 2007_10-Kcit 2007_10-K
cit 2007_10-Kfinance28
 

Similar to reliance steel & aluminum 2006_Form_10K (20)

GPI2006AR_Form10K
GPI2006AR_Form10KGPI2006AR_Form10K
GPI2006AR_Form10K
 
tenet healthcare CY0810KFinal
tenet healthcare CY0810KFinaltenet healthcare CY0810KFinal
tenet healthcare CY0810KFinal
 
tenet healthcare CY0810KFinal
tenet healthcare CY0810KFinaltenet healthcare CY0810KFinal
tenet healthcare CY0810KFinal
 
starbucks 200710K
starbucks  200710Kstarbucks  200710K
starbucks 200710K
 
cit B6ECBCC8-387D-47CD-8386-D05A207C86FB_34562pr11clean
cit B6ECBCC8-387D-47CD-8386-D05A207C86FB_34562pr11cleancit B6ECBCC8-387D-47CD-8386-D05A207C86FB_34562pr11clean
cit B6ECBCC8-387D-47CD-8386-D05A207C86FB_34562pr11clean
 
cit B6ECBCC8-387D-47CD-8386-D05A207C86FB_34562pr11clean
cit B6ECBCC8-387D-47CD-8386-D05A207C86FB_34562pr11cleancit B6ECBCC8-387D-47CD-8386-D05A207C86FB_34562pr11clean
cit B6ECBCC8-387D-47CD-8386-D05A207C86FB_34562pr11clean
 
owens & minor FD57D1A1-8F5F-4464-AC94-EB65DE35BF6C_2008_10-K
owens & minor  FD57D1A1-8F5F-4464-AC94-EB65DE35BF6C_2008_10-Kowens & minor  FD57D1A1-8F5F-4464-AC94-EB65DE35BF6C_2008_10-K
owens & minor FD57D1A1-8F5F-4464-AC94-EB65DE35BF6C_2008_10-K
 
dish network annual reports 2000
dish network annual reports 2000dish network annual reports 2000
dish network annual reports 2000
 
REALOGY_10_filing_K3_19_08
REALOGY_10_filing_K3_19_08REALOGY_10_filing_K3_19_08
REALOGY_10_filing_K3_19_08
 
REALOGY_10_filing_K3_19_08
REALOGY_10_filing_K3_19_08REALOGY_10_filing_K3_19_08
REALOGY_10_filing_K3_19_08
 
dish network annual reports 2002
dish network annual reports 2002dish network annual reports 2002
dish network annual reports 2002
 
RR Donnelley 2002_Form_10K
RR Donnelley  2002_Form_10KRR Donnelley  2002_Form_10K
RR Donnelley 2002_Form_10K
 
Realogy10-KFiling22509
Realogy10-KFiling22509Realogy10-KFiling22509
Realogy10-KFiling22509
 
tenet healthcare CY0610KFINAL
tenet healthcare CY0610KFINALtenet healthcare CY0610KFINAL
tenet healthcare CY0610KFINAL
 
dish network annual reports 2001
dish network annual reports 2001dish network annual reports 2001
dish network annual reports 2001
 
dish network annual reports 1999
dish network annual reports 1999dish network annual reports 1999
dish network annual reports 1999
 
calpine 10K_2006
calpine 10K_2006calpine 10K_2006
calpine 10K_2006
 
calpine 10K_2006
calpine 10K_2006calpine 10K_2006
calpine 10K_2006
 
universal helath services 2003Financials
universal helath services  2003Financialsuniversal helath services  2003Financials
universal helath services 2003Financials
 
cit 2007_10-K
cit 2007_10-Kcit 2007_10-K
cit 2007_10-K
 

More from finance32

dole food div95a
dole food div95adole food div95a
dole food div95afinance32
 
dole food div95
dole food div95dole food div95
dole food div95finance32
 
dole food div96
dole food div96dole food div96
dole food div96finance32
 
dole food div97
dole food div97dole food div97
dole food div97finance32
 
dole food div98
dole food div98dole food div98
dole food div98finance32
 
dole food div99
dole food div99dole food div99
dole food div99finance32
 
dole food div2000
dole food div2000dole food div2000
dole food div2000finance32
 
dole food div01
dole food div01dole food div01
dole food div01finance32
 
dole food div02
dole food div02dole food div02
dole food div02finance32
 
dole food div03
dole food div03dole food div03
dole food div03finance32
 
dole food private_tax_info
dole food private_tax_infodole food private_tax_info
dole food private_tax_infofinance32
 
Dole1995 annual
Dole1995 annualDole1995 annual
Dole1995 annualfinance32
 
Dole 1996 annual
Dole 1996 annualDole 1996 annual
Dole 1996 annualfinance32
 
Dole 1997 annual
Dole 1997 annualDole 1997 annual
Dole 1997 annualfinance32
 
Dole1998 annual
Dole1998 annualDole1998 annual
Dole1998 annualfinance32
 
Dole 99 annrpt
Dole 99 annrptDole 99 annrpt
Dole 99 annrptfinance32
 
Dole 2000 Annual
Dole 2000 AnnualDole 2000 Annual
Dole 2000 Annualfinance32
 
Dole 2001 Annual
Dole 2001 AnnualDole 2001 Annual
Dole 2001 Annualfinance32
 
Dole 2002 Annual
Dole 2002 AnnualDole 2002 Annual
Dole 2002 Annualfinance32
 
Dole 2003 Annual
Dole 2003 AnnualDole 2003 Annual
Dole 2003 Annualfinance32
 

More from finance32 (20)

dole food div95a
dole food div95adole food div95a
dole food div95a
 
dole food div95
dole food div95dole food div95
dole food div95
 
dole food div96
dole food div96dole food div96
dole food div96
 
dole food div97
dole food div97dole food div97
dole food div97
 
dole food div98
dole food div98dole food div98
dole food div98
 
dole food div99
dole food div99dole food div99
dole food div99
 
dole food div2000
dole food div2000dole food div2000
dole food div2000
 
dole food div01
dole food div01dole food div01
dole food div01
 
dole food div02
dole food div02dole food div02
dole food div02
 
dole food div03
dole food div03dole food div03
dole food div03
 
dole food private_tax_info
dole food private_tax_infodole food private_tax_info
dole food private_tax_info
 
Dole1995 annual
Dole1995 annualDole1995 annual
Dole1995 annual
 
Dole 1996 annual
Dole 1996 annualDole 1996 annual
Dole 1996 annual
 
Dole 1997 annual
Dole 1997 annualDole 1997 annual
Dole 1997 annual
 
Dole1998 annual
Dole1998 annualDole1998 annual
Dole1998 annual
 
Dole 99 annrpt
Dole 99 annrptDole 99 annrpt
Dole 99 annrpt
 
Dole 2000 Annual
Dole 2000 AnnualDole 2000 Annual
Dole 2000 Annual
 
Dole 2001 Annual
Dole 2001 AnnualDole 2001 Annual
Dole 2001 Annual
 
Dole 2002 Annual
Dole 2002 AnnualDole 2002 Annual
Dole 2002 Annual
 
Dole 2003 Annual
Dole 2003 AnnualDole 2003 Annual
Dole 2003 Annual
 

Recently uploaded

Jual obat aborsi Jogja ( 085657271886 ) Cytote pil telat bulan penggugur kand...
Jual obat aborsi Jogja ( 085657271886 ) Cytote pil telat bulan penggugur kand...Jual obat aborsi Jogja ( 085657271886 ) Cytote pil telat bulan penggugur kand...
Jual obat aborsi Jogja ( 085657271886 ) Cytote pil telat bulan penggugur kand...Klinik kandungan
 
Benefits & Risk Of Stock Loans
Benefits & Risk Of Stock LoansBenefits & Risk Of Stock Loans
Benefits & Risk Of Stock LoansMartinRowse
 
Sonagachi % High Profile Call Girls in Kolkata Real photos of Female Escorts ...
Sonagachi % High Profile Call Girls in Kolkata Real photos of Female Escorts ...Sonagachi % High Profile Call Girls in Kolkata Real photos of Female Escorts ...
Sonagachi % High Profile Call Girls in Kolkata Real photos of Female Escorts ...soniyagrag336
 
Retail sector trends for 2024 | European Business Review
Retail sector trends for 2024  | European Business ReviewRetail sector trends for 2024  | European Business Review
Retail sector trends for 2024 | European Business ReviewAntonis Zairis
 
Famous Kala Jadu, Black magic expert in Faisalabad and Kala ilam specialist i...
Famous Kala Jadu, Black magic expert in Faisalabad and Kala ilam specialist i...Famous Kala Jadu, Black magic expert in Faisalabad and Kala ilam specialist i...
Famous Kala Jadu, Black magic expert in Faisalabad and Kala ilam specialist i...batoole333
 
Q1 2024 Conference Call Presentation vF.pdf
Q1 2024 Conference Call Presentation vF.pdfQ1 2024 Conference Call Presentation vF.pdf
Q1 2024 Conference Call Presentation vF.pdfAdnet Communications
 
MalaysianStates_AnalysisGDPandInvestment_web (1).pdf
MalaysianStates_AnalysisGDPandInvestment_web (1).pdfMalaysianStates_AnalysisGDPandInvestment_web (1).pdf
MalaysianStates_AnalysisGDPandInvestment_web (1).pdfJkJeeks
 
Certified Kala Jadu, Black magic specialist in Rawalpindi and Bangali Amil ba...
Certified Kala Jadu, Black magic specialist in Rawalpindi and Bangali Amil ba...Certified Kala Jadu, Black magic specialist in Rawalpindi and Bangali Amil ba...
Certified Kala Jadu, Black magic specialist in Rawalpindi and Bangali Amil ba...batoole333
 
Lion One Corporate Presentation May 2024
Lion One Corporate Presentation May 2024Lion One Corporate Presentation May 2024
Lion One Corporate Presentation May 2024Adnet Communications
 
TriStar Gold- 05-13-2024 corporate presentation
TriStar Gold- 05-13-2024 corporate presentationTriStar Gold- 05-13-2024 corporate presentation
TriStar Gold- 05-13-2024 corporate presentationAdnet Communications
 
Webinar on E-Invoicing for Fintech Belgium
Webinar on E-Invoicing for Fintech BelgiumWebinar on E-Invoicing for Fintech Belgium
Webinar on E-Invoicing for Fintech BelgiumFinTech Belgium
 
Black magic specialist in Canada (Kala ilam specialist in UK) Bangali Amil ba...
Black magic specialist in Canada (Kala ilam specialist in UK) Bangali Amil ba...Black magic specialist in Canada (Kala ilam specialist in UK) Bangali Amil ba...
Black magic specialist in Canada (Kala ilam specialist in UK) Bangali Amil ba...batoole333
 
Strategic Resources May 2024 Corporate Presentation
Strategic Resources May 2024 Corporate PresentationStrategic Resources May 2024 Corporate Presentation
Strategic Resources May 2024 Corporate PresentationAdnet Communications
 
Test bank for advanced assessment interpreting findings and formulating diffe...
Test bank for advanced assessment interpreting findings and formulating diffe...Test bank for advanced assessment interpreting findings and formulating diffe...
Test bank for advanced assessment interpreting findings and formulating diffe...robinsonayot
 
Certified Kala Jadu, Black magic specialist in Rawalpindi and Bangali Amil ba...
Certified Kala Jadu, Black magic specialist in Rawalpindi and Bangali Amil ba...Certified Kala Jadu, Black magic specialist in Rawalpindi and Bangali Amil ba...
Certified Kala Jadu, Black magic specialist in Rawalpindi and Bangali Amil ba...batoole333
 
20240419-SMC-submission-Annual-Superannuation-Performance-Test-–-design-optio...
20240419-SMC-submission-Annual-Superannuation-Performance-Test-–-design-optio...20240419-SMC-submission-Annual-Superannuation-Performance-Test-–-design-optio...
20240419-SMC-submission-Annual-Superannuation-Performance-Test-–-design-optio...Henry Tapper
 
Pitch-deck CopyFinancial and MemberForex.ppsx
Pitch-deck CopyFinancial and MemberForex.ppsxPitch-deck CopyFinancial and MemberForex.ppsx
Pitch-deck CopyFinancial and MemberForex.ppsxFuadS2
 
fundamentals of corporate finance 11th canadian edition test bank.docx
fundamentals of corporate finance 11th canadian edition test bank.docxfundamentals of corporate finance 11th canadian edition test bank.docx
fundamentals of corporate finance 11th canadian edition test bank.docxssuserf63bd7
 

Recently uploaded (20)

Jual obat aborsi Jogja ( 085657271886 ) Cytote pil telat bulan penggugur kand...
Jual obat aborsi Jogja ( 085657271886 ) Cytote pil telat bulan penggugur kand...Jual obat aborsi Jogja ( 085657271886 ) Cytote pil telat bulan penggugur kand...
Jual obat aborsi Jogja ( 085657271886 ) Cytote pil telat bulan penggugur kand...
 
Benefits & Risk Of Stock Loans
Benefits & Risk Of Stock LoansBenefits & Risk Of Stock Loans
Benefits & Risk Of Stock Loans
 
Sonagachi % High Profile Call Girls in Kolkata Real photos of Female Escorts ...
Sonagachi % High Profile Call Girls in Kolkata Real photos of Female Escorts ...Sonagachi % High Profile Call Girls in Kolkata Real photos of Female Escorts ...
Sonagachi % High Profile Call Girls in Kolkata Real photos of Female Escorts ...
 
Retail sector trends for 2024 | European Business Review
Retail sector trends for 2024  | European Business ReviewRetail sector trends for 2024  | European Business Review
Retail sector trends for 2024 | European Business Review
 
Famous Kala Jadu, Black magic expert in Faisalabad and Kala ilam specialist i...
Famous Kala Jadu, Black magic expert in Faisalabad and Kala ilam specialist i...Famous Kala Jadu, Black magic expert in Faisalabad and Kala ilam specialist i...
Famous Kala Jadu, Black magic expert in Faisalabad and Kala ilam specialist i...
 
Q1 2024 Conference Call Presentation vF.pdf
Q1 2024 Conference Call Presentation vF.pdfQ1 2024 Conference Call Presentation vF.pdf
Q1 2024 Conference Call Presentation vF.pdf
 
MalaysianStates_AnalysisGDPandInvestment_web (1).pdf
MalaysianStates_AnalysisGDPandInvestment_web (1).pdfMalaysianStates_AnalysisGDPandInvestment_web (1).pdf
MalaysianStates_AnalysisGDPandInvestment_web (1).pdf
 
Certified Kala Jadu, Black magic specialist in Rawalpindi and Bangali Amil ba...
Certified Kala Jadu, Black magic specialist in Rawalpindi and Bangali Amil ba...Certified Kala Jadu, Black magic specialist in Rawalpindi and Bangali Amil ba...
Certified Kala Jadu, Black magic specialist in Rawalpindi and Bangali Amil ba...
 
Lion One Corporate Presentation May 2024
Lion One Corporate Presentation May 2024Lion One Corporate Presentation May 2024
Lion One Corporate Presentation May 2024
 
TriStar Gold- 05-13-2024 corporate presentation
TriStar Gold- 05-13-2024 corporate presentationTriStar Gold- 05-13-2024 corporate presentation
TriStar Gold- 05-13-2024 corporate presentation
 
Webinar on E-Invoicing for Fintech Belgium
Webinar on E-Invoicing for Fintech BelgiumWebinar on E-Invoicing for Fintech Belgium
Webinar on E-Invoicing for Fintech Belgium
 
Black magic specialist in Canada (Kala ilam specialist in UK) Bangali Amil ba...
Black magic specialist in Canada (Kala ilam specialist in UK) Bangali Amil ba...Black magic specialist in Canada (Kala ilam specialist in UK) Bangali Amil ba...
Black magic specialist in Canada (Kala ilam specialist in UK) Bangali Amil ba...
 
Strategic Resources May 2024 Corporate Presentation
Strategic Resources May 2024 Corporate PresentationStrategic Resources May 2024 Corporate Presentation
Strategic Resources May 2024 Corporate Presentation
 
Test bank for advanced assessment interpreting findings and formulating diffe...
Test bank for advanced assessment interpreting findings and formulating diffe...Test bank for advanced assessment interpreting findings and formulating diffe...
Test bank for advanced assessment interpreting findings and formulating diffe...
 
DIGITAL COMMERCE SHAPE VIETNAMESE SHOPPING HABIT IN 4.0 INDUSTRY
DIGITAL COMMERCE SHAPE VIETNAMESE SHOPPING HABIT IN 4.0 INDUSTRYDIGITAL COMMERCE SHAPE VIETNAMESE SHOPPING HABIT IN 4.0 INDUSTRY
DIGITAL COMMERCE SHAPE VIETNAMESE SHOPPING HABIT IN 4.0 INDUSTRY
 
Certified Kala Jadu, Black magic specialist in Rawalpindi and Bangali Amil ba...
Certified Kala Jadu, Black magic specialist in Rawalpindi and Bangali Amil ba...Certified Kala Jadu, Black magic specialist in Rawalpindi and Bangali Amil ba...
Certified Kala Jadu, Black magic specialist in Rawalpindi and Bangali Amil ba...
 
20240419-SMC-submission-Annual-Superannuation-Performance-Test-–-design-optio...
20240419-SMC-submission-Annual-Superannuation-Performance-Test-–-design-optio...20240419-SMC-submission-Annual-Superannuation-Performance-Test-–-design-optio...
20240419-SMC-submission-Annual-Superannuation-Performance-Test-–-design-optio...
 
Pitch-deck CopyFinancial and MemberForex.ppsx
Pitch-deck CopyFinancial and MemberForex.ppsxPitch-deck CopyFinancial and MemberForex.ppsx
Pitch-deck CopyFinancial and MemberForex.ppsx
 
Abortion pills in Dammam Saudi Arabia | +966572737505 |Get Cytotec
Abortion pills in Dammam Saudi Arabia | +966572737505 |Get CytotecAbortion pills in Dammam Saudi Arabia | +966572737505 |Get Cytotec
Abortion pills in Dammam Saudi Arabia | +966572737505 |Get Cytotec
 
fundamentals of corporate finance 11th canadian edition test bank.docx
fundamentals of corporate finance 11th canadian edition test bank.docxfundamentals of corporate finance 11th canadian edition test bank.docx
fundamentals of corporate finance 11th canadian edition test bank.docx
 

reliance steel & aluminum 2006_Form_10K

  • 1. SECURITIES AND EXCHANGE COMMISSION Washington, D.C. 20549 FORM 10-K (Mark One) [ ] ANNUAL REPORT PURSUANT TO SECTION 13 OR 15(d) OF THE SECURITIES EXCHANGE ACT OF 1934 For the fiscal year ended December 31, 2006 OR [ ] TRANSITION REPORT PURSUANT TO SECTION 13 OR 15(d) OF THE SECURITIES EXCHANGE ACT OF 1934 For the transition period from ______ to ________ Commission file number: 001-13122 RELIANCE STEEL & ALUMINUM CO. (Exact name of registrant as specified in its charter) California 95-1142616 (State or other jurisdiction of (I.R.S. Employer incorporation or organization) Identification No.) 350 South Grand Avenue, Suite 5100 Los Angeles, California 90071 (213) 687-7700 (Address of principal executive offices and telephone number) Securities registered pursuant to Section 12(b) of the Act: Name of each exchange on Title of each class which registered Common Stock New York Stock Exchange Securities registered pursuant to Section 12(g) of the Act: None Indicate by check mark if the registrant is a well-known seasoned issuer, as defined in Rule 405 of the Securities Act. Yes No Indicate by check mark if the registrant is not required to file reports pursuant to Section 13 or Section 15(d) of the Act. Yes No Indicate by check mark whether the registrant (1) has filed all reports required to be filed by Section 13 or 15(d) of the Securities Exchange Act of 1934 during the preceding 12 months (or for such shorter period that the registrant was required to file such reports), and (2) has been subject to such filing requirements for the past 90 days. Yes No Indicate by check mark if disclosure of delinquent filers pursuant to Item 405 of Regulation S-K is not contained herein and will not be contained, to the best of the registrant’s knowledge, in definitive proxy or information statements incorporated by reference in Part III of this Form 10-K or any amendment to this Form 10-K. Indicate by check mark whether the registrant is a large accelerated filer, an accelerated filer, or a non-accelerated filer. See definition of “accelerated filer and large accelerated filer” in Rule 12b-2 of the Exchange Act. (Check one): Large accelerated filer Accelerated filer Non-accelerated filer Indicate by check mark whether the registrant is a shell company (as defined in Rule 12b-2 of the Act). Yes No The aggregate market value of the voting stock held by non-affiliates of the registrant, based on the closing price on the New York Stock Exchange on June 30, 2006 was $3,014,507,619. As of January 31, 2007, 75,849,932 shares of the registrant's common stock, no par value, were outstanding. DOCUMENTS INCORPORATED BY REFERENCE Portions of the registrant’s definitive Proxy Statement for the Annual Meeting of Shareholders to be held May 16, 2007 (the “Proxy Statement”) are incorporated by reference into Part III of this report.
  • 2. INDEX Page PART I Item 1. Business .................................................................................................................................. 1 Industry Overview................................................................................................................... 1 History of Reliance ................................................................................................................. 2 Customers ............................................................................................................................... 5 Suppliers ................................................................................................................................. 6 Backlog ................................................................................................................................... 7 Products and Processing Services ........................................................................................... 7 Marketing................................................................................................................................ 9 Industry and Market Cycles .................................................................................................... 9 Competition............................................................................................................................. 11 Quality Control ....................................................................................................................... 11 Systems ................................................................................................................................... 11 Government Regulation .......................................................................................................... 12 Environmental......................................................................................................................... 12 Employees............................................................................................................................... 12 Available Information ............................................................................................................. 12 Item 1A. Risk Factors ............................................................................................................................ 13 Item 1B. Unresolved Staff Comments ................................................................................................... 20 Item 2. Properties ................................................................................................................................ 20 Item 3. Legal Proceedings ................................................................................................................... 24 Item 4. Submission of Matters to a Vote of Security Holders............................................................. 24 PART II Item 5. Market for Registrant’s Common Equity, Related Stockholder Matters and Issuer 25 Purchases of Equity Securities ................................................................................................ Item 6. Selected Financial Data........................................................................................................... 27 Item 7. Management’s Discussion and Analysis of Financial Condition and Results of Operations.. 29 Item 7A. Quantitative and Qualitative Disclosures About Market Risk ................................................ 39 Item 8. Financial Statements and Supplementary Data ....................................................................... 40 Item 9. Changes in and Disagreements with Accountants on Accounting and Financial Disclosure ............................................................................................................................... 82 Item 9A. Controls and Procedures ......................................................................................................... 82 Item 9B. Other Information ................................................................................................................... 82 PART III Item 10. Directors and Executive Officers and Corporate Governance ................................................ 84 Item 11. Executive Compensation......................................................................................................... 84 Item 12. Security Ownership of Certain Beneficial Owners and Management and Related 84 Stockholder Matters ................................................................................................................ Item 13. Certain Relationships and Related Transactions ..................................................................... 84 Item 14. Principal Accountant Fees and Services ................................................................................. 84 PART IV Item 15. Exhibits, Financial Statement Schedules and Reports on Form 8-K....................................... 85 SIGNATURES ................................................................................................................................................ 87 i
  • 3. SAFE HARBOR STATEMENT UNDER THE PRIVATE SECURITIES LITIGATION REFORM ACT OF 1995 This Annual Report on Form 10-K and the documents incorporated by reference contain forward-looking statements within the meaning of the Private Securities Litigation Reform Act of 1995. Our forward-looking statements include discussions of our business strategies and our expectations concerning future operations, margins, profitability, liquidity and capital resources. In some cases, you can identify forward-looking statements by terminology such as “may,” “will,” “should,” “expects,” “intends,” “plans,” “anticipates,” “believes,” “thinks,” “estimates,” “seeks,” “predicts,” “potential” and similar expressions. These statements relate to future events or our future financial performance and involve known and unknown risks, uncertainties and other factors that may cause our actual results, levels of activity, performance or achievements to differ materially from those in the future that are implied by these forward-looking statements. These risks and other factors include those described under “Risk Factors” and elsewhere in this Annual Report on Form 10-K and the documents incorporated by reference. These factors, among others, could cause our actual results and performance to differ materially from the results and performance projected in, or implied by, the forward-looking statements. As you read and consider this Annual Report and the documents incorporated by reference, you should carefully understand that the forward-looking statements are not guarantees of performance or results. All future written and oral forward-looking statements attributable to us or to any person acting on our behalf are expressly qualified in their entirety by the cautionary statements contained or referred to in this section. New risks and uncertainties arise from time to time, and we cannot predict those events or how they may affect us. We assume no obligation to update any forward- looking statements after the date of this Annual Report as a result of new information, future events or developments, except as required by the federal securities laws. Forward-looking statements involve known and unknown risks and uncertainties. Various factors, such as the factors listed below and further discussed in detail in “Risk Factors” may cause our actual results, performance, or achievements to be materially different from those expressed or implied by any forward-looking statements. Among the factors that could cause our results to differ are the following: • The interest rates on our debt could change. The interest rates on our variable rate debt increased steadily during 2005 and 2006 and these rates may continue to increase through 2007. • Foreign currency exchange rates could change, which could affect the price we pay for certain metals and the results of our foreign operations, which have grown as a percentage of our total operations. • Our future operating results depend on a number of factors beyond our control, such as the prices for and the availability of metals, which could cause our results to fluctuate significantly over time. During periods of low customer demand it could be more difficult for us to pass through price increases to our customers, which could reduce our gross profit and net income. A significant or rapid increase or decrease in costs from current levels could also have a severe negative impact on our gross profit. • We service industries that are highly cyclical, and downturns in our customers’ industries could reduce our revenue and profitability. • The success of our business is affected by general economic conditions and, accordingly, our business was adversely impacted by the economic slowdown or recession in 2001, 2002 and 2003. This could occur in future periods. • We operate in a very competitive industry and increased competition could reduce our gross profit margins and net income. • As a decentralized business, we depend on both senior management and our operating employees; if we are unable to attract and retain these individuals, our results of operations may decline. • We may not be able to consummate future acquisitions, and those acquisitions that we do complete may be difficult to integrate into our business. • Our acquisitions might fail to perform as we anticipate. This could result in an impairment charge to write off some or all of the goodwill for that entity. Acquisitions may also result in our becoming responsible for unforeseen liabilities that may adversely affect our financial condition and liquidity. If our acquisitions do not perform as anticipated, our operating results also may be adversely affected. • We are subject to various environmental and other governmental regulations which may require us to expend significant capital and incur substantial costs. ii
  • 4. We may discover internal control deficiencies in our decentralized operations or in an acquisition that must be reported in our SEC filings, which may result in a negative impact on the market price of our common stock or the ratings of our debt. • If existing shareholders sell their shares, the market price of our common stock could decline. • Principal shareholders who own a significant number of our shares may have interests that conflict with yours. • We have implemented a staggered or classified Board that may adversely impact your rights as a shareholder. The foregoing factors are not exhaustive, and new factors may emerge or changes to the foregoing factors may occur that could impact our business. Although we believe the expectations reflected in the forward-looking statements are reasonable, we cannot guarantee future performance or results. We are not obligated to update or revise any forward-looking statements, whether as a result of new information, future events or otherwise. You should consider these risks when reading any forward-looking statements and review carefully the section captioned “Risk Factors” in this Annual Report on Form 10-K for a more complete discussion of the risks of an investment in the stock. This Annual Report on Form 10-K includes trademarks, trade names and service marks of the Company and its subsidiaries. iii
  • 5. PART I Item 1. Business We are one of the largest metals service center companies in the United States. Our network of 27 divisions, 25 operating subsidiaries and a 70%-owned company operates more than 180 locations in 37 states, Belgium, Canada, China and South Korea. Through this network, we provide metals processing services and distribute a full line of more than 100,000 metal products, including alloy, aluminum, brass, copper, carbon steel, titanium, stainless steel and specialty steel products, to more than 125,000 customers in a broad range of industries. Many of our metals service centers process and distribute only specialty metals. In addition to being diversified by product and customers, we are geographically diversified. We deliver products from facilities located across the United States. One of our subsidiaries has an international location in South Korea that serves the Asian semiconductor market. Another subsidiary has a metals service center in Belgium to service the European aerospace market. On March 1, 2006, our 70%-owned joint venture company, based in Singapore, acquired a metals service center company in China that mainly serves the electronics industry in China. We also entered the Canadian market in April 2006 through an acquisition and expanded our presence in Canada as a result of another acquisition in February 2007. Our primary business strategy is to enhance our operating results through strategic acquisitions, expansion of our existing operations and improved operating performance at our locations. We believe that our geographic, customer and product diversification also makes us less vulnerable to regional or industry specific economic volatility. Following the economic recession in 2001, 2002 and 2003, our industry experienced a broad-based significant and unprecedented upturn in 2004 that continued for many of our products throughout 2005 and 2006. In 2006, we achieved our highest ever levels of net sales of $5.74 billion and net income of $354.5 million. Industry Overview Metals service centers acquire products from primary metals producers and then process carbon steel, aluminum, stainless steel and other metals to meet customer specifications, using techniques such as blanking, leveling (or cutting-to-length), sawing, shape cutting, shearing and slitting. These processing services save our customers time, labor, and expense and reduce their overall manufacturing costs. Specialized equipment used to process the metals requires high-volume production to be cost effective. Many manufacturers are not able or willing to invest in the necessary technology, equipment, and inventory to process the metals for their own manufacturing operations. Accordingly, industry dynamics have created a niche in the market. Metals service centers purchase, process, and deliver metals to end-users in a more efficient and cost-effective manner than the end-user could achieve by dealing directly with the primary producer or with an intermediate steel processor. Service centers comprise the largest single customer group for North American mills, buying and reselling about 30% of all the carbon, alloy, stainless and specialty steels, aluminum, copper, brass and bronze, and superalloys produced in the U.S. and Canada each year (Purchasing magazine, May 2006). In May 2006, the magazine Purchasing also reported that the North American (U.S. and Canada) metals distribution industry was estimated to have generated record revenues of about $115 billion in 2005 (the latest year for which such information is available), up from $85 billion in 2004, with the increase being due to a revived metalworking economy that boosted the nation’s need for metals and increased prices for steel and nonferrous metals. The metals service center industry is highly fragmented and intensely competitive within localized areas or regions. Many of our competitors operate single stand-alone service centers. According to Purchasing, the number of intermediate steel processors and metal center facilities in North America has decreased from approximately 7,000 locations in 1980 to approximately 3,500 locations operated by more than 1,300 companies in 2003. This consolidation trend creates opportunities for us to make acquisitions. Metals service centers are generally less susceptible to market cycles than producers of the metals, because service centers are usually able to pass on all or a portion of increases in metal costs to their customers. In 2002 and 2003, it was more difficult for our industry to pass through price increases of certain carbon steel products as the increased costs resulted from supply constraints rather than customer demand, which is more typical. In 2004, these dynamics changed significantly as domestic mill shutdowns and increased global demand limited availability of several carbon steel products. This limited supply, along with somewhat improved U.S. demand, allowed service centers to increase their selling prices and pass these costs on to their customers. In 2005, although supply was not as limited as in 2004 and carbon steel prices had declined from 2004 levels, the consolidation at the carbon steel mill level resulted in a more stable pricing environment for carbon steel products. Demand and pricing for carbon steel products improved near the end of 2005 with this improvement continuing through most of 2006. Demand remained strong across most end markets in 2006, with the exception of the domestic auto market, although our exposure to this market is very limited. For the most part, pricing increased through the first nine months of 2006 but declined somewhat in the fourth quarter due to lower demand for some products and increased imports to the U.S. that resulted in higher 1
  • 6. inventory levels at distributors. Certain domestic mills reduced capacity in early 2007 which resulted in somewhat improved pricing. Aluminum and stainless steel pricing rose throughout 2005, with significant and rapid price and demand increases for aerospace-related products during 2005. In 2006, the prices of aluminum products, excluding specialty aerospace products, increased somewhat and were fairly steady at high levels. The prices of aerospace related aluminum products continued to increase in 2006, but at a slower rate than in 2005. In 2006, the prices of stainless steel products increased significantly to record levels, primarily due to increased nickel surcharges resulting from global nickel shortages. We expect that stainless steel prices will decline in the future if supply increases or demand declines, but we are uncertain as to when this may occur or how significant price declines may be. A rapid and significant decline could negatively impact our results of operations. We believe that service centers, like Reliance, with the most rapid inventory turnover are generally the least vulnerable to changing metals prices. Customers purchase from service centers to obtain value-added metals processing, readily available inventory, reliable and timely delivery, flexible minimum order size, and quality control. Many customers deal exclusively with service centers because the quantities of metal products that they purchase are smaller than the minimum orders specified by mills or because those customers require intermittent deliveries over long or irregular periods. Metals service centers respond to a niche market created because of the focus of the capital goods and related industries on just-in-time inventory management and materials management outsourcing, and because integrated mills have reduced in-house direct sales efforts to small sporadic purchasers to enhance their production efficiency. History of Reliance Reliance Steel & Aluminum Co. was organized as a California corporation on February 3, 1939, and commenced business in Los Angeles, California fabricating steel reinforcing bar. Within ten years, we had become a full-line distributor of steel and aluminum, operating a single metals service center in Los Angeles. In the early 1950’s, we automated our materials handling operations and began to provide processing services to meet our customers’ requirements. In the 1960’s, we began to acquire other companies to establish additional service centers, expanding into other geographic areas. In the mid-1970’s, we began to establish specialty metals centers stocked with inventories of selected metals such as aluminum, stainless steel, brass, and copper, and equipped with automated materials handling and precision cutting equipment. We have continued to expand our network, with a focus on servicing our customers as opposed to merely distributing metal. In 2003, we acquired a company that processes metal for a fee without taking ownership of the metal. In the past twelve months we have expanded our geographic and product base significantly through our acquisitions. We have not diversified outside of our core business and we strive to consistently perform as one of the best in our industry. We currently operate metals service centers under the following trade names: No. of Locations Trade Name Primary Products Processed & Distributed Reliance Divisions Affiliated Metals.................................................. 1 Plate and flat-rolled aluminum and stainless steel Bralco Metals...................................................... 6 Aluminum, brass, copper and stainless steel Central Plains Steel Co...................................... . 2 Carbon steel Engbar Pipe & Steel Co...................................... 1 Carbon steel bars, pipe and tubing MetalCenter ........................................................ 1 Flat-rolled aluminum and stainless steel Olympic Metals ................................................... 1 Aluminum, brass, copper and stainless steel Reliance Metalcenter .......................................... 9 Variety of carbon steel and non-ferrous metal products Reliance Steel Company ..................................... 2 Carbon steel Tube Service Co. ................................................. 6 Specialty tubing 1 Carbon steel Allegheny Steel Distributors, Inc. ........................ 2 Aluminum sheet, plate and bar Aluminum and Stainless, Inc. .............................. American Metals Corporation.............................. 3 Carbon steel American Steel, L.L.C.. ........................................ 2 Carbon steel AMI Metals, Inc. AMI Metals ........................................................ 6 Heat-treated aluminum sheet and plate AMI Metals Europe S.P.R.L............................... 1 Heat-treated aluminum sheet and plate CCC Steel, Inc. CCC Steel........................................................... 1 Structural steel IMS Steel............................................................ 1 Structural steel 5 Carbon steel plate Chapel Steel Corp. ................................................ 2
  • 7. 5 Full-line service centers Chatham Steel Corporation.................................. 2 Carbon steel flat-rolled, plate, bar and structurals Crest Steel Corporation ......................................... 1 Carbon steel plate, bar and structurals Durrett Sheppard Steel Co., Inc. ........................... Earle M. Jorgensen Company Earle M. Jorgensen............................................. 33 Specialty bar and tubing Earle M. Jorgensen (Canada) Inc....................... 5 Specialty bar and tubing Steel Bar.............................................................. 1 Carbon steel bars and tubing 1 Aluminum Plate and Bar Everest Metals (Suzhou) Co., Ltd.......................... Liebovich Bros., Inc. Liebovich Steel & Aluminum Company ............. 3 Full-line service centers Custom Fabricating Co...................................... 1 Tool and alloy steels Good Metals Company ...................................... 1 Plate and flat-rolled carbon steel Hagerty Steel & Aluminum Company ................ 1 Metal fabrication Lusk Metals.......................................................... . 1 Precision cut aluminum plate and aluminum sheet and extrusions 7 Aluminum and coated carbon steel Pacific Metal Company ........................................ 7 Carbon steel structurals and plate PDM Steel Service Centers, Inc ........................... Phoenix Corporation Phoenix Metals Company .................................. 7 Flat-rolled aluminum, stainless steel and coated carbon steel 10 Toll processing (slitting, leveling, blanking) of Precision Strip, Inc. .............................................. aluminum, stainless steel and carbon steel RSAC Canada Limited Encore Coils ...................................................... 4 Flat-rolled carbon steel Encore Metals .................................................... 4 Stainless and alloy bar, plate and tube Encore Metals (USA) Inc. ................................. 3 Stainless and alloy bar, plate and tube Team Tube Canada ............................................ 6 Alloy and carbon steel tubing Service Steel Aerospace Corp. Service Steel Aerospace ..................................... 2 Stainless and alloy specialty steels United Alloys Aircraft Metals ............................ 1 Titanium products Siskin Steel & Supply Company, Inc. Siskin Steel ......................................................... 4 Full-line service centers Athens Steel........................................................ 1 Carbon steel structurals, flat-rolled and ornamental iron East Tennessee Steel Supply .............................. 1 Carbon steel plate, bar and structurals Georgia Steel Supply Company ......................... 1 Full-line service center Industrial Metals and Surplus, Inc..................... 1 Carbon steel structurals, flat-rolled and ornamental iron 1 Stainless steel sheet and coil Toma Metals, Inc.................................................. Valex Corp. Valex .................................................................. 2 Electropolished stainless steel tubing and fittings Valex Korea Co., Ltd. ........................................ 1 Electropolished stainless steel tubing and fittings 2 Flat-rolled carbon steel Viking Materials, Inc............................................ 7 Stainless steel and aluminum plate, rod and bar Yarde Metals, Inc.................................................. We serve our customers primarily by providing quick delivery, metals processing and inventory management services. We purchase a variety of metals from primary producers and sell these products in small quantities based on our customers’ needs. In connection with approximately 40% of our sales orders in 2006, we performed metals processing services, or first-stage processing, before distributing the product to manufacturers and other end-users, often within 24 hours from receipt of an order, if the order does not require extensive or customized processing. These services save time, labor, and expense for our customers and reduce their overall manufacturing costs. During 2006, we handled approximately 17,275 transactions per business day, with an average price of approximately $1,320 per transaction. Our net sales were $5.74 billion for the 2006 year. We believe that our focus on small orders with quick turnaround differentiates us from many of the other large public metals service center companies and allows us to generate higher profits than those companies. Historically, we have expanded both through acquisitions and internal growth. Since our initial public offering in September 1994, we have successfully purchased more than 40 businesses. In 2006, we significantly increased the size of our company through acquisitions, primarily as a result of the Earle M. Jorgensen Company and Yarde Metals, Inc. acquisitions. From 1984 to September 1994, we acquired 20 businesses. We continue to evaluate acquisition opportunities and expect to continue to 3
  • 8. grow our business through acquisitions and internal growth initiatives, particularly those that will diversify our products, customer base and geographic locations. Acquisitions On August 1, 2006 we acquired Yarde Metals, Inc., a metals service center company headquartered in Southington, Connecticut. We paid $100 million in cash for all of the outstanding common stock of Yarde Metals and assumed approximately $101 million of its net debt. Yarde Metals was founded in 1976 and specializes in the processing and distribution of stainless steel and aluminum plate, rod and bar products. Yarde has additional metals service centers in Pelham, New Hampshire; East Hanover, New Jersey; Hauppauge, New York; High Point, North Carolina; Streetsboro, Ohio; and Limerick, Pennsylvania and a sales office in Ft. Lauderdale, Florida. Yarde’s net sales for the five months ended December 31, 2006 were approximately $181.7 million. On April 3, 2006 we completed the acquisition of Earle M. Jorgensen Company (“EMJ”) which was our first acquisition of a public company. EMJ, headquartered in Lynwood, California, is one of the largest distributors of metal products in North America with 40 service and processing centers. The transaction was valued at approximately $984 million, including the assumption of EMJ’s net debt. We paid $6.50 in cash and issued .1784 of a share (split adjusted) of Reliance common stock for each share of EMJ common stock outstanding. This also was the first acquisition where we used our stock as consideration. EMJ’s net sales for the nine months ended December 31, 2006 were approximately $1.45 billion. On March 27, 2006, through Precision Strip, Inc. (“Precision Strip”), a wholly-owned subsidiary, we completed the acquisition of certain assets and business of Flat Rock Metal Processing, LLC. (“Flat Rock”). The Flat Rock toll processing businesses in Perrysburg, Ohio and Portage, Indiana, are operated by Precision Strip. In January 2006, we purchased the remaining 49.5% of American Steel, L.L.C. From its inception on July 1, 1995 through April 30, 2002, we owned a 50% interest in the Membership Units of American Steel, which operates metals service centers in Portland, Oregon and Kent, Washington and processes and distributes primarily carbon steel products. We retained operating control over the assets and operations of American Steel. American Industries, Inc. owned the other 50% interest. Effective May 1, 2002, we increased our ownership to 50.5% of the outstanding Membership Units of American Steel and began consolidating its financial results. We purchased American Industries’ 49.5% interest on January 3, 2006 and eliminated the related minority interest expense. In October 2005, we formed Reliance Pan Pacific Pte., Ltd. (“RPP”) with our joint venture partner Manufacturing Network Pte. Ltd. (“MNPL”). We own 70% of RPP and MNPL owns the remaining 30%. On March 1, 2006, RPP acquired 100% of the outstanding equity interest in Everest Metals (Suzhou) Co., Ltd. (“Everest Metals”), a metals service center company near Shanghai, People’s Republic of China. Everest Metals was previously wholly owned by MNPL. Everest Metals sells aluminum products to the Chinese electronics market and had sales for the ten months ended December 31, 2006 of approximately $5.8 million. On July 1, 2005, we acquired all of the outstanding capital stock of Chapel Steel Corp. (“Chapel Steel”), a privately held metals service center company founded in 1972 that processes and distributes carbon and alloy steel plate products from five facilities in Pottstown (Philadelphia), Pennsylvania; Bourbonnais (Chicago), Illinois; Houston, Texas; Birmingham, Alabama; and Portland, Oregon. Chapel Steel also warehouses and distributes its products in Cincinnati, Ohio and Hamilton, Ontario, Canada. Chapel Steel is headquartered in Spring House (Philadelphia), Pennsylvania. We paid approximately $94.2 million in cash for the equity of Chapel Steel and assumed approximately $16.8 million of Chapel Steel’s debt. Chapel Steel’s net sales for 2006 were approximately $341.9 million. Recent Developments As of February 1, 2007 we acquired the net assets and business of the Encore Group of metals service center companies (Encore Metals, Encore Metals (USA), Inc., Encore Coils, and Team Tube in Canada) headquartered in Edmonton, Alberta, Canada. Encore was organized in 2004 in connection with the buyout by management and a private equity fund managed by HSBC Capital (Canada) Inc. of certain former Corus CIC and Corus America businesses. Encore specializes in the processing and distribution of alloy and carbon bar and tube, as well as stainless steel sheet, plate and bar and carbon steel flat-rolled products, through its 17 facilities located mainly in Western Canada. Encore’s unaudited net sales for the year ended December 31, 2006 were approximately C$259 million. We acquired the Encore Group assets through RSAC Canada Limited, our wholly- owned Canadian subsidiary, and RSAC Canada (Tube) ULC, its wholly-owned subsidiary. 4
  • 9. On January 2, 2007, we acquired Crest Steel Corporation (“Crest”), a metals service center company headquartered in Carson, California with facilities in Riverside, California and Phoenix, Arizona. Crest was founded in 1963 and specializes in the processing and distribution of carbon steel products including flat-rolled, plate, bars and structurals. Crest’s unaudited net sales for the year ended December 31, 2006 were approximately $133 million. Also, on January 2, 2007, our wholly-owned subsidiary, Siskin Steel & Supply Company, Inc., based in Chattanooga, Tennessee, acquired Industrial Metals and Surplus, Inc. (“Industrial Metals”) a metals service center company headquartered in Atlanta, Georgia and a related company, Athens Steel, Inc. located in Athens, Georgia. Industrial Metals was founded in 1978 and specializes in the processing and distribution of carbon steel structurals, flat-rolled and ornamental iron products. Industrial Metals’ unaudited net sales (including Athens Steel) for the year ended December 31, 2006 were approximately $105 million. Athens Steel, Inc. was merged with and into Industrial Metals which now operates as a wholly-owned subsidiary of Siskin. Siskin’s Georgia Steel Supply Company division located in Atlanta will be combined with the Industrial Metals operation in 2007. Other Developments In 2006, we experienced substantial organic growth by opening new facilities, building or expanding facilities and adding processing equipment. In 2006, Liebovich Bros. opened a new location near Green Bay, Wisconsin to further penetrate that geographic area and expanded its Cedar Rapids, Iowa location. Phoenix Metals Company opened a new location near Philadelphia, Pennsylvania in 2006 as a new entry into that geographic region. Phoenix Metals also relocated an existing operation to a new, larger more efficient facility in Birmingham, Alabama; is building a new facility for its Charlotte, North Carolina operation; and is adding processing equipment in both of these locations to better support its customers in those areas. Allegheny Steel Distributors expanded its Indianola, Pennsylvania facility to make room for additional equipment to help support its increased business. Siskin Steel & Supply Company is expanding its Chattanooga, Tennessee warehouse. Precision Strip is expanding its Talladega, Alabama facility and added processing equipment in its Talladega and Bowling Green, Kentucky locations in 2006. Also in 2006, Toma Metals, Inc. expanded its Johnstown, Pennsylvania facility and Service Steel Aerospace relocated its United Alloys Aircraft Metals division to a larger facility near Los Angeles, California. Earle M. Jorgensen Company opened a satellite location in Lafayette, Louisiana in April 2006 and relocated its Portland, Oregon operation to a new, larger more efficient facility in early 2007. EMJ also expanded its Kansas City facility in 2006. AMI Metals Europe, S.P.R.L., expanded its warehouse facility in Belgium to better service its increased share of the European aerospace business. In 2006, Valex Korea Co., Ltd., a 99%-owned subsidiary of Valex Corp., based near Seoul, South Korea, expanded its facility. The current environment supports strong organic growth and we expect to continue to expand our business in 2007 by continuing to build and expand facilities and add processing equipment. Due to the increased size of our company, late in 2006 we recapitalized the Company by issuing $600 million of debt securities, increasing the availability of our credit facility to $1.1 billion, and repurchasing approximately $250 million of outstanding 9.75% senior secured notes of EMJ. These activities lowered our cost of capital and provide for our future growth. We formed RSAC Management Corp., a California corporation, in 1999 to operate as a holding company for our subsidiaries and to provide administrative and management services to our metals service centers. Our executive officers maintain a control environment that is focused on integrity and ethical behavior, establish general policies and operating guidelines and monitor adherence to proper financial controls, while our division managers and subsidiary officers have virtual autonomy with respect to day-to-day operations. This balanced, yet entrepreneurial, management style has enabled us to improve the productivity and profitability both of acquired businesses and of our own expanded operations. Division managers and other management personnel are eligible for incentive compensation based, in part, on the profitability of their particular division or subsidiary and, in part, on the Company’s overall profitability. We seek to increase our profitability by expanding our existing operations and acquiring businesses that diversify or enhance our customer base, product range, processing services and geographic coverage. We have developed and maintained an excellent reputation in the industry for our integrity and the quality and timeliness of our service to customers. Customers Our customers purchase from us and other metals service centers to obtain value-added metals processing, readily available inventory, reliable and timely delivery, flexible minimum order size and quality control. Many of our customers deal exclusively with service centers because the quantities of metal products that they purchase are smaller than the minimum orders specified by mills, because those customers require intermittent deliveries over long or irregular periods, or because those customers require specialized processing services. We believe that metals service centers have also enjoyed an increasing share of total metal shipments due to the focus of the capital goods and other manufacturing industries on just-in-time inventory management 5
  • 10. and materials management outsourcing, and because metal producers have reduced in-house direct sales efforts to small sporadic purchasers in order to enhance their production efficiency. We have more than 125,000 metals service center customers in various industries. In 2006, no single customer accounted for more than 1.5% of our sales, and approximately 80% of our orders were from repeat customers. Our customers are manu- facturers and end-users in the general manufacturing, construction (mainly non-residential), transportation (rail, truck trailer and shipbuilding), aerospace, energy, electronics and semiconductor fabrication and related industries. In 2003, many of our suppliers also became our customers as a result of our purchase of Precision Strip, which typically sells processing services, but not metal, to larger customers, such as mills and original equipment manufacturers (OEM’s), and in larger annual volumes than we have experienced historically. Precision Strip has also indirectly increased our participation in the auto and appliance end markets. Our metals service centers wrote and delivered over 4,095,000 orders during 2006 at an average price of approximately $1,320. Most of our metals service center customers are located within a 200-mile radius of the metals service center serving them. The proximity of our centers to our customers helps us provide just-in-time delivery to our customers. With our fleet of approximately 1,265 trucks (some of which are leased), we are able to service many smaller customers. Moreover, our computerized order entry system and flexible production scheduling enable us to meet customer requirements for short lead times and just-in-time delivery. In 2006, our international presence increased significantly through the Canadian service centers of EMJ. Approximately 5% of our sales were to international customers in 2006, with approximately 62% of these sales to Canadian customers. Approximately 57% of our Canadian sales were made by our EMJ Canada locations. We believe that our long-term relationships with many of our customers significantly contribute to the success of our business. Providing prompt and efficient services and quality products at reasonable prices are important factors in maintaining these relationships. Customer demand may change from time to time based on, among other things, general economic conditions and industry capacity. Many of the industries in which our customers compete are cyclical in nature. Because we sell to a wide variety of customers in several industries, we believe that the effect of such changes on us is significantly reduced. However, from 2001 through August 2003, we experienced lower sales levels due to a broad-based economic downturn that affected all industries. We experienced lower demand in each successive year from 2000 until September 2003 when we experienced an improvement in our customer demand, as well as pricing, for most of the products we sell. Customer demand levels continued to increase in 2004. In 2005, demand rose for some of our products (primarily those related to aerospace) and for other products was fairly steady with 2004 levels, until late 2005 when we saw significant increases in many markets, especially the non-residential construction market. The improved demand levels continued through 2006, with strength in almost all of our end markets. Pricing for carbon steel products increased to record highs in 2004, primarily due to raw material shortages for the mills which increased their costs, and due to reduced supply resulting from the shutdown of some domestic capacity and from increased global demand that reduced the amount of import material available in the U.S. as it was re-routed to strong foreign markets such as China. Although carbon steel prices declined during most of 2005, they rebounded slightly in late 2005 and continued to increase through the first half of 2006, and then prices for certain products began to decline. The range of volatility in carbon steel prices has moderated and pricing is at relatively high levels. Pricing for aluminum and stainless steel products increased steadily throughout 2005 as demand increased, especially for aerospace products. There were significant and rapid increases for both pricing and demand of aerospace products throughout 2005, with increases continuing into 2006 but at a lesser rate than in 2005. Pricing for stainless steel products increased significantly throughout 2006, mainly because of global nickel shortages, and are at historical highs. California was our largest market for many years, but we have expanded our geographic coverage in recent years and the Midwest region of the United States has become our largest market followed closely by the Southeast region. Although our sales dollars in each of these regions have increased, the percent of total sales in each region has changed due to our growth. California represented 17% of our 2006 sales, which was a significant decrease from 45% of our 1997 sales. The Southeast region of the United States represented 20% of our 2006 sales compared to 18% of our 1997 sales, and the Midwest region, which we entered in 1999 and is now our largest market, represented 23% of our 2006 sales. Our 2006 acquisitions continued our geographic diversification, especially in the Midwest, and facilitated our entry into the Northeast. The geographic breakout of our sales for 2006 was as follows: Midwest – 23%; Southeast – 20%; California – 17%; West/Southwest – 15%; Pacific Northwest – 9%; Mountain – 5%; Mid-Atlantic – 4%; International – 4%; Northeast – 3%. Suppliers We purchase our inventory from the major metals mills, both domestic and foreign, and have multiple suppliers for all of our product lines. Our major suppliers of domestic carbon steel products include California Steel Industries, Inc., Chaparral Steel Company, IPSCO, Inc., Mittal Steel, Nucor Corporation, Oregon Steel Mills, Steel Dynamics, Inc. and United States Steel Corporation. Allegheny Technologies Incorporated, AK Steel, and North American Stainless supply stainless steel products. 6
  • 11. We are a recognized distributor for various major aluminum companies, including Alcoa Inc, Alcan Aluminum Limited, Aleris International, Inc. (formerly Commonwealth Aluminum Corp.) and Kaiser Aluminum Corp. During 2001 through 2003, many domestic steel mills entered bankruptcy proceedings and certain of those mills temporarily closed a portion of their production capacity. Beginning in 2003 and continuing into 2004, many of the bankrupt mill facilities were acquired and some production was re-started. Mill pricing for steel products stabilized in mid-2003 mainly because of the consolidation that occurred at the mill level that improved capacity and mill-pricing discipline. Beginning in late 2003, steel mills began to experience significant increases in their raw material costs due to shortages caused by increased global demand. In 2004 they instituted surcharges on top of base price increases and consistently implemented significant increases through most of 2004. In 2005 and 2006, the domestic mills exercised pricing discipline by shutting down excess capacity, when appropriate, which has provided a more stable pricing environment, and at relatively high levels, than our industry has experienced historically. Costs for aluminum and stainless steel products continued to increase steadily throughout 2004 and 2005. Aluminum prices continued to increase somewhat in 2006 and then leveled off at relatively high levels. Costs for specialty aluminum and stainless steel products sold to the aerospace industry increased significantly in 2005 and 2006 due to limited supply caused by strong demand, and due to increased raw material costs. Stainless steel costs increased significantly in 2006, primarily due to the global shortage of nickel that is used in stainless steel production. The nickel shortage is due to various factors, including the closure of mines due to strikes and fires, some of which is expected to be temporary. Because of our total volume of purchases and our long-term relationships with our suppliers, we believe that we are generally able to purchase inventory at the best prices offered by the suppliers, given the order size. We believe that we are not dependent on any one of our suppliers for metals. In 2004, when carbon steel supply was tight, we believe that these relationships provided an advantage to us in our ability to source product and have it available for our customers. Also, mill consolidation has somewhat reduced the number of suppliers. The favorable market conditions being experienced in the U.S. could cause new capacity to be built or could cause foreign mills to increase their exports to the U.S. In 2006, China became a net exporter of metals which caused concern about the impact on the U.S. and other markets. We have not seen a significant disruption in the U.S. market because of this; however, continued and increased imports of Chinese metals into the U.S. market could negatively impact pricing. Backlog Because of the just-in-time delivery policy and the short lead-time nature of our business, we do not believe the information on backlog of orders is material to an understanding of our metals service center business. Products and Processing Services We provide a wide variety of processing services to meet each customer’s specifications and deliver products to fabricators, manufacturers and other end users. We maintain a wide variety of products in inventory. Flat-rolled carbon steel products are generally the most volatile and competitive products in terms of pricing and account for only about 10% of our 2006 sales. For orders other than those requiring extensive or specialized processing, we often deliver to the customer within 24 hours after receiving the order. Our 2006 sales were comprised of the following approximate percentages of products or services: • 13% carbon steel plate • 10% carbon steel tubing • 9% carbon steel bar • 7% carbon steel structurals • 5% galvanized steel sheet and coil • 3% hot rolled steel sheet and coil • 2% cold rolled steel sheet and coil Carbon 49% • heat-treated aluminum plate 6% • aluminum bar and tube 6% • common alloy aluminum sheet and coil 4% • common alloy aluminum plate 1% • heat-treated aluminum sheet and coil 1% Aluminum 18% 7
  • 12. stainless steel bar and tube 8% • stainless steel sheet and coil 6% • stainless steel plate 3% • electropolished stainless steel tubing and fittings 1% Stainless 18% • 5% alloy bar and tube • 1% alloy plate, sheet and coil Alloy 6% • 2% toll processing of aluminum, carbon steel and stainless steel • 7% miscellaneous, including brass, copper and titanium We do not depend on any particular customer group or industry because we process a variety of metals. Because of this diversity of product type and material, we believe that we are less exposed to fluctuations or other weaknesses in the financial or economic stability of particular customers or industries. We also are less dependent on particular suppliers. For sheet and coil products, we purchase coiled metal from primary producers in the form of a continuous sheet, typically 36 to 60 inches wide, between .015 and .25 inches thick, and rolled into 3- to 20-ton coils. The size and weight of these coils require specialized equipment to move and process the coils into smaller sizes and various products. Many of the other products that we carry also require specialized equipment. Few of our customers have the capability to process the metal into the desired products. After receiving an order, we enter it into our computerized order entry system, select appropriate inventory and schedule the processing to meet the specified delivery date. In 2006, we delivered more than 40% of our orders within 24 hours. We attempt to maximize the yield from the various metals that we process by combining customer orders to use each product that we purchase to the fullest extent practicable. Few metals service centers offer the full scope of processing services and metals that we provide. In 2006, we performed processing services for approximately 40% of our sales orders. Our primary processing services are described below: • Bar turning involves machining a metal bar into a smaller diameter. • Bending is the forming of metals into various angles. • Blanking is the cutting of metals into close-tolerance square or rectangular shapes. • Deburring is the process used to smooth the sharp, jagged edges of a cut piece of metal. • Electropolishing is the process used on stainless steel tubing and fittings to simultaneously smooth, brighten, clean and passivate the interior surfaces of these components. Electropolishing is an electrochemical removal process that selectively removes a thin layer of metal, including surface flaws and imbedded impurities. Electropolishing is a required surface treatment for all ultra high-purity components used in the gas distribution systems of semiconductor manufacturers worldwide and many sterile water distribution systems of pharmaceutical and biotechnology companies. • Fabricating includes performing second- and/or third-stage processing per customer specifications, typically to provide a part, casing or kit which is used in the customer’s end product. • Forming involves bending and forming plate or sheet products into customer-specified shapes and sizes with press brakes. • Grinding or blanchard grinding involves grinding the top and/or bottom of carbon or alloy steel plate or bars into close tolerance. • Leveling (cutting-to-length) involves cutting metal along the width of a coil into specified lengths of sheets or plates. • Machining refers to performing multiple processes to a piece of metal to produce a customer-specified component part. • Oscillate slitting involves slitting the metal into specified widths and then oscillating the slit coil when it is wound. The oscillated coil winds the strip metal similar to the way fishing line is wound on a reel rather than standard ribbon winding. An oscillate coil can typically hold five to six times more metal than a standard coil, which allows 8
  • 13. customers to achieve longer production run times by reducing the number of equipment shut-downs to change coils. • Pipe threading refers to the cutting of threads around the circumference of the pipe. • Polishing changes the texture of the surface of the metal to specific finishes in accordance with customer specifications. • Precision plate sawing involves sawing plate (primarily aluminum plate products) into square or rectangular shapes to tolerances as close as 0.003 of an inch. • Punching is the cutting of holes into carbon steel beams or plates by pressing or welding per customer speci- fications. • Routing produces various sizes and shapes of aluminum plate according to customer-supplied drawings through the use of CNC controlled machinery. • Sawing involves cutting metal into customer-specified lengths, shapes or sizes. • Shape cutting, or burning, can produce various shapes according to customer-supplied drawings through the use of CNC controlled machinery. This procedure can include the use of oxy-fuel, plasma, high-definition plasma, laser burning or water jet cutting for carbon, aluminum and stainless steel sheet and plate. • Shearing is the cutting of metal into small, precise square or rectangular pieces. • Skin milling grinds the top and/or bottom of a large aluminum plate into close tolerance. • Slitting involves cutting metal to specified widths along the length of the coil. • Tee splitting involves splitting metal beams. Tee straightening is the process of straightening split beams. • Twin milling grinds one or all six sides of a small square or rectangular piece of aluminum plate into close tolerance. • Welding is the joining of one or more pieces of metal. • Wheelabrating, shotblasting and bead-blasting involve pressure blasting metal grid onto carbon steel products to remove rust and scale from the surface. We generally process specific metals to non-standard sizes only at the request of customers pursuant to purchase orders. We do not maintain a significant inventory of finished products, but we carry a wide range of metals to meet the short lead time and just-in-time delivery requirements of our customers. Our metals service centers maintain inventory and equipment selected to meet the needs of that facility’s customers. Marketing As of year-end 2006, we had approximately 1,300 sales personnel located in 41 states, Belgium, Canada, China, France, South Korea and the United Kingdom that provide marketing services throughout each of those areas, as well as nearby locations. The sales personnel are organized by division or subsidiary among our profit centers and are divided into two groups. Our outside sales personnel are considered those personnel who travel throughout a specified geographic territory to maintain relationships with our existing customers and develop new customers. Those sales personnel who remain at the facilities to write and price orders are our inside sales personnel. The inside sales personnel generally receive incentive compensation, in addition to their base salary, based on the gross profit or pretax profit of their particular profit center. The outside sales personnel generally receive incentive compensation based on the gross profit from their particular geographic territories. Industry and Market Cycles We distribute metal products to our customers in a variety of industries, including construction, manufacturing, trans- portation, aerospace, energy and semiconductor fabrication. Many of the industries in which our customers compete are cyclical in nature and are subject to changes in demand based on general economic conditions. We sell to a wide variety of customers in diverse industries to reduce the effect of changes in these cyclical industries on our results. During 2001 and 2002 and until August 2003, all of the industries to which we sell experienced low demand levels due to the poor economic conditions in the U.S. Demand for most of our products improved beginning in September 2003 and the improvement continued through most of 2004 and 2005 for some of our products. In late 2005, we saw improvement in demand for most products that we sell, especially for non-residential construction, which we believe is our largest end market measured by our net sales to this market. The improved demand levels continued through 2006. Our results were significantly impacted by the economic downturn from 2001 through 2003, but reacted positively to the favorable pricing environment that began in 2004 and has continued. This environment, combined with our acquisitions, has resulted in record profitability levels for us in each year since 2004. A significant drop in current pricing levels or demand could result in a negative impact to our financial results. However, if current pricing levels do not change significantly and demand improves, our financial results could be positively impacted. 9
  • 14. The semiconductor fabrication industry, aerospace industry, energy (oil and gas), and truck trailer and rail car industries have historically experienced cycles that may have an impact on our results if they repeat in the future. The semiconductor fabrication industry is highly cyclical in nature and is subject to changes in demand based on, among other things, general economic conditions and industry capacity. There has been a substantial shift in this market, with many U.S. companies moving their semiconductor fabrication operations to Asia. We are participating in the Asian market through our Valex Korea subsidiary. In 2003, aerospace demand remained fairly consistent with the low levels experienced in 2002, but in 2004 we experienced steady improvement throughout the year. Aerospace demand, as well as pricing, increased rapidly and significantly throughout 2005. Demand remained strong through 2006 and pricing continued to increase, although at a more moderate rate than in 2005. With our acquisition of EMJ in April 2006, we gained exposure to the oil and gas market, which is a volatile industry. Demand and pricing are currently at high levels which has favorably impacted our 2006 financial results. Our acquisition of Encore in early 2007 increases our exposure to the oil and gas industry. The heavy truck, truck trailer and rail car industries experienced a substantial slowing in demand beginning in 2000 that continued through 2002, which materially impacted our operations in the Pacific Northwest. We did experience some improvement for short periods during 2003 and saw significant improvements in truck trailer demand throughout 2004 that continued at healthy levels in 2005 and 2006. Fluctuations in the cost of our materials also affect the prices we can charge to our customers. By selling a diverse product mix, we are able to somewhat offset fluctuations in our costs of materials. However, because of weak demand and overcapacity at the producer level in both domestic and foreign markets in 2001, the costs of most metal products reached their lowest levels experienced in over 20 years. Due to the continued low demand, costs of most metals remained at or near the 2001 levels throughout 2002 and most of 2003. However, costs of carbon steel flat-rolled products increased significantly in the second half of 2002 due to supply constraints as a result of certain producers reducing capacity and government restrictions on foreign imports. These increased costs began to decline slightly near the end of 2002 and early 2003 because of the continued low end- user demand. In the second half of 2003, costs for carbon steel products again increased significantly and rapidly due to improved demand and increased scrap, raw material and energy costs for steel producers. This trend continued through most of 2004 with pricing at all time highs. Increased global demand limited availability of many of these products in the U.S. allowing the significant increases in prices. During the fourth quarter of 2004, increased amounts of import material arrived in the U.S. putting some downward pressure on pricing for carbon steel products. In the first eight months of 2005, there was downward pressure on carbon steel prices which we believe was mainly due to excess inventory in the supply chain. Pricing for carbon steel products improved in late 2005 in part due to increased end user demand. Prices for carbon steel products remained at high levels, and experienced some increases, in 2006, until the latter part of the year when lower demand along with increased imports resulted in high inventory levels at distributors causing pricing pressures. However, pricing remains at strong levels and certain domestic mills reduced capacity in early 2007 and pricing improved somewhat. Costs for aluminum and stainless steel products increased in the second half of 2003 and throughout 2004 and 2005 due to supply constraints and improved customer demand. Aluminum costs increased somewhat in 2006 and have leveled off at relatively high prices. Pricing for aerospace related aluminum, stainless steel and titanium products experienced significant cost increases in 2005 which we believe was due to improved demand and supply constraints that continued into 2006 although the increases were more moderate than in 2005 except for stainless steel products. Stainless steel costs increased significantly in 2006 due to nickel shortages. Overall, most products that we sell are at or near historically high price levels due to supply issues and strong end market demand. We have historically been able to pass increases in metal costs on to our customers as costs typically increase due to strong demand. In 2004, supply limitations for carbon steel products allowed us to pass through significant cost increases well in advance of our receipt of the higher cost material, which resulted in significantly higher gross profit margins in 2004, especially in the 2004 second quarter. Our gross profit margins declined somewhat from 2004 levels in 2005 because of declining costs during the first eight months of 2005. Our gross profit margins in 2006 were fairly consistent with 2005 levels until the end of the year when increased supply in the U.S. caused some pressure on pricing. Due to supply limitations in 2005, we were able to increase our selling prices for aerospace products more than our costs increased, raising our 2005 gross profit margins for these products. Our margins on aerospace products continued at strong levels in 2006. We cannot guarantee that the margin between our metal costs and selling prices will remain at the levels experienced during 2006, especially if demand declines or if costs of domestic metals decline due to increased availability or reduced global demand. If metals costs and related selling prices remain at current levels or increase, we should be able to record consistent or increased revenue and gross profit dollars on a consistent volume basis. 10
  • 15. Competition The metals distribution industry is highly fragmented and competitive. We have numerous competitors in each of our product lines and geographic locations, although competition is most frequently local or regional. Most of our competitors are smaller than we are, but we still face strong competition from national, regional and local independent metals distributors and the producers themselves, some of which have greater resources than we do. As reported in the May 2003 issue of Purchasing magazine, it is estimated that there were approximately 3,500 intermediate steel processors and metals service center facilities in North America in 2003. Purchasing magazine has identified us as the second largest metals service center company in North America (based upon 2005 revenue). According to the May 2006 issue of the magazine Purchasing, the 2005 revenues for the five largest North American metals service center companies ranged from $2.1 billion to $5.8 billion for total revenues of $16.3 billion, which represents approximately 14% of the estimated $115 billion of total revenue for the metals service center industry in 2005. Reliance’s 2005 sales of $3.4 billion represented approximately 3% of the estimated $115 billion industry total. Because of the significant acquisitions that we have made in 2006, beginning with the second quarter of 2006, we are now the largest North American metals service center company based on quarterly revenues (as reported in SEC filings). We compete with other companies on price, service, quality and availability of products. We maintain centralized relationships with our major suppliers and a decentralized operational structure. We believe that this division of responsibility has increased our ability to obtain competitive prices of metals and to provide more responsive service to our customers. In addition, we believe that the size of our inventory, the different metals and products we have available, and the wide variety of processing services we provide, distinguish us from our competition. We believe that we have increased our market share during recent years due to our strong financial condition, our high quality of service, our acquisitions and opportunities created by activities of certain of our competitors. Quality Control Procuring high quality metal from suppliers on a consistent basis is critical to our business. We have instituted strict quality control measures to assure that the quality of purchased raw materials will enable us to meet our customers’ specifications and to reduce the costs of production interruptions. We perform physical and chemical analyses on selected raw materials to verify that their mechanical and dimensional properties, cleanliness and surface characteristics meet our requirements. We conduct similar analyses on selected processed metal before delivery to the customer. We believe that maintaining high standards for accepting metals ultimately results in reduced return rates from our customers. In 2006, 22 divisions and eight subsidiaries of Reliance, at a total of 73 facilities, have maintained ISO 9002 certifications and were certified for ISO 9001-2000, but we do not expect to obtain the certification for any additional facilities at this time. As of December 15, 2003, ISO 9001-2000 replaced ISO 9002. The ISO 9001-2000 quality standard added a matrix to record and review customer satisfaction and reorganized the requirements for the quality standard from 20 elements to eight elements. The certification takes approximately one year to obtain. Each facility seeking ISO certification is required to establish a quality system that is documented in a quality control manual and that affects all aspects of the facility's operations, including sales, product inspections, product storage, delivery and documentation. A certifying agent performs a physical audit of each facility every six months to determine that the facility is in fact following the procedures set forth in the quality control manual. A recertification is required for each facility every three years. Initially in 1996, when we first began the certification process, we expected that more customers would require such certification, but we have learned that for the types of products and services which most of our facilities provide, very few of our customers require such certification and most of our customers have responded that they would purchase products from Reliance or its subsidiaries regardless of such certification. However, we believe that going through the certification process allowed our facilities to improve their efficiency and the quality of products and services provided to our customers. In addition, our subsidiary Precision Strip maintains ISO/TS 16949:2002 certifications at eight of its ten facilities. The two facilities acquired in 2006 are in the process of becoming ISO/TS 16949:2002 certified. ISO/TS 16949:2002 is an ISO Technical Specification, which aligns existing American (QS-9000), German (VDA6.1), French (EAQF) and Italian (AVSQ) automotive quality systems standards within the global automotive industry. Quality System Requirements QS-9000 (“QS-9000”) is the common quality standard for automotive suppliers and is based upon the 1994 edition of ISO 9001, with additional requirements specific to the automotive industry. The International Automotive Sector Group is an international ad hoc working group that monitors interpretation issues related to the standard. Systems We have converted our Reliance divisions and certain of our subsidiaries from various software programs to the Stelplan™ manufacturing and distribution information system. Stelplan™ is a registered trademark of Invera, Inc. Stelplan™ is an 11
  • 16. integrated business application system with functions ranging from order entry to the generation of financial statements. Stelplan™ was developed specifically for the metals service center and processor industry. Stelplan™ also provides information in real time, such as inventory availability, location and cost. With this information, our marketing and sales personnel can respond to our customers’ needs more efficiently and more effectively. Certain of our subsidiaries use other vendor or in-house developed systems to support their operations, including EMJ that has 41 locations. The basic functionality of the software is similar to Stelplan™ but in many instances has been designed specifically for each of their operations with features to accommodate the products that they carry, automated equipment interfaces, or other specialized needs. These systems are included in our internal control testing. A common financial reporting system is used company-wide. Government Regulation Our metals service centers are subject to many foreign, federal, state and local requirements to protect the environment, including hazardous waste disposal and underground storage tank regulations. The only hazardous substances that we generally use in our operations are lubricants, cleaning solvents and petroleum for fueling our trucks. We pay state-certified private companies to haul and dispose of our hazardous waste. Our operations are also subject to laws and regulations relating to workplace safety and worker health, principally the Occupational Health and Safety Act and related regulations, which, among other requirements, establish noise, dust and safety standards. We maintain comprehensive health and safety policies and encourage our employees to follow established safety practices. We do not anticipate that future compliance with such laws and regulations will have a material adverse effect on our results of operations or financial condition. Environmental Some of the properties we own or lease are located in industrial areas with histories of heavy industrial use. We may incur some environmental liabilities because of the location of these properties. In addition, we are currently investigating and remediating contamination at certain properties we have acquired or that acquired subsidiaries previously owned, but we do not expect that these liabilities would have a material adverse impact on our results of operations. All scrap metal produced by our operations is sold to independent scrap metal companies and we believe is recycled. Employees As of December 31, 2006, we had approximately 8,600 employees. Approximately 15% of the employees are covered by collective bargaining agreements, which expire at various times over the next four years. We have entered into collective bargaining agreements with 30 union locals at 34 of our locations. These collective bargaining agreements have not had a material impact either favorably or unfavorably on our revenues or profitability at our various locations. We have always maintained excellent relations with our employees. In 2005, we experienced a work stoppage by our drivers at one of our locations, but it did not have a material impact on our operations at that location. This contract expired and the drivers at that location are now non-union employees. We have never experienced a significant work stoppage. Available Information We file annual, quarterly and current reports, proxy statements and other documents with the Securities and Exchange Commission (“SEC”) under the Securities Exchange Act of 1934, as amended (“the Exchange Act”). The public may read and copy any materials that we file with the SEC at the SEC’s Public Reference Room at 450 Fifth Street, N.W., Washington, DC 20549. The public may obtain information on the operation of the Public Reference Room by calling the SEC at 1-800-SEC- 0330. Also, the SEC maintains a Website that contains reports, proxy information statements and other information regarding issuers, including our Company, that file electronically with the SEC. The public can obtain any documents that we file with the SEC at http://www.sec.gov. We also make available free of charge on or through our Internet Website (http://www.rsac.com) our Annual Report on Form 10-K, Quarterly Reports on Form 10-Q, Current Reports on Form 8-K and, if applicable, amendments to those reports filed or furnished pursuant to Section 13(a) of the Exchange Act as soon as reasonably practicable after we electronically file such material with, or furnish it to, the SEC. Reference to our Website is not intended to incorporate anything on the Website into this report. 12
  • 17. Item 1A. Risk Factors Set forth below are the risks that we believe are material to our investors. Our business, results of operations and financial condition may be materially adversely affected due to any of the following risks. The risks described below are not the only ones we face. Additional risks of which we are not presently aware or that we currently believe are immaterial may also harm our business. This section contains forward-looking statements. You should refer to the explanation of the qualifications and limitations on forward-looking statements set forth at the beginning of this Report. Risks Related to Our Business and Industry Our indebtedness could impair our financial condition and reduce the funds available to us for other purposes and our failure to comply with the covenants contained in our debt instruments could result in an event of default that could adversely affect our operating results. We have substantial debt service obligations. As of December 31, 2006, we had aggregate outstanding indebtedness of approximately $1.1 billion, with a significant increase in 2006 that is attributable to our 2006 acquisitions. This indebtedness could adversely affect us in the following ways: • our ability to obtain additional financing in the future for working capital, capital expenditures, acquisitions, general corporate purposes or other purposes may be impaired; • a significant portion of our cash flow from operations must be dedicated to the payment of interest and principal on our debt, which reduces the funds available to us for our operations or other purposes; • some of the interest on debt is, and will continue to be, accrued at variable rates, which may result in higher interest expense in the event of increases in interest rates, which may occur in 2007; • because we may be more leveraged than some of our competitors, our debt may place us at a competitive disadvantage; • our leverage may increase our vulnerability to economic downturns and limit our ability to withstand adverse events in our business by limiting our financial alternatives; and • our ability to capitalize on significant business opportunities, including potential acquisitions, and to plan for, or respond to, competition and changes in our business may be limited. Our existing debt agreements contain, and our future debt agreements may contain, financial and restrictive covenants that limit our ability to incur additional debt, including to finance future operations or other capital needs, and to engage in other activities that we may believe are in our long-term best interests, including to dispose of or acquire assets or other companies or to pay dividends to our shareholders. Our failure to comply with these covenants may result in an event of default which, if not cured or waived, could accelerate the maturity of our indebtedness or prevent us from accessing availability under our credit facility. If our indebtedness is accelerated, we may not have sufficient cash resources to satisfy our debt obligations and we may not be able to continue our operations as planned. We may not be able to generate sufficient cash flow to meet our existing debt service obligations. Our annual debt service obligations until November 8, 2011, when our revolving credit facility is scheduled to mature, will be primarily limited to interest and principal payments on multiple series of privately placed senior notes and our outstanding debt securities with an aggregate principal amount of $898 million, and on borrowings under our $1.1 billion credit facility. Our ability to generate sufficient cash flow from operations to make scheduled payments on our debt obligations will depend on our future financial performance, which will be affected by a range of economic, competitive and business factors, many of which are outside of our control. For example, we may not generate sufficient cash flow from our operations or new acquisitions to repay amounts drawn under our credit facility when it matures in 2011, our private notes when they mature on various dates between 2007 and 2013, our debt securities when they mature in 2016 and 2036 or our industrial revenue bonds when they mature in 2009 and 2014. If we do not generate sufficient cash flow from operations to satisfy our debt obligations, we expect to undertake alternative financing plans, such as refinancing or restructuring our debt, selling assets, reducing or delaying capital investments or seeking to raise additional capital. We may not be able to consummate any such transaction at all or on a timely basis or on terms, and for proceeds, that are acceptable to us. These transactions may not be permitted under the terms of our various debt instruments then in effect, however, our inability to generate sufficient cash flow to satisfy our debt obligations, or 13
  • 18. to timely refinance our obligations on acceptable terms, could adversely affect our ability to serve our customers and could cause us to reduce or discontinue our planned operations. The costs that we pay for metals fluctuate due to a number of factors beyond our control, and such fluctuations could adversely affect our operating results, particularly if we cannot pass on higher metal prices to our customers. We purchase large quantities of carbon, alloy and stainless steel, aluminum and other metals, which we sell to a variety of end-users. In 2004 the costs for carbon steel increased significantly and rapidly from historically low levels. Although these costs declined somewhat through mid-2005, the costs increased in the fourth quarter of 2005, with moderate increases in 2006. Overall carbon steel costs remain at relatively high levels. Costs for aluminum products, excluding aerospace-related products, rose steadily in 2004 with continued increases in 2005 and 2006. Costs for stainless steel products rose steadily in 2004 and increased more rapidly in 2005 and 2006. Stainless steel costs are currently at unprecedented high levels, primarily due to the high nickel surcharges resulting from low global nickel supply. Costs for aerospace-related products increased significantly beginning in late 2004 and continued to increase through all of 2005 and into 2006, although at a slower rate than in 2005. We attempt to pass these cost increases on to our customers with higher selling prices but we may not always be able to do so. The costs to us for these metals and the prices that we charge customers for our products may change depending on many factors outside of our control, including general economic conditions (both domestic and international), competition, production levels, customer demand levels, import duties and other trade restrictions, currency fluctuations and surcharges imposed by our suppliers. We maintain substantial inventories of metal to accommodate the short lead times and delivery requirements of our customers. Our customers typically purchase products from us pursuant to purchase orders and typically do not enter into long- term purchase agreements or arrangements with us. Accordingly, we purchase metal in quantities we believe to be appropriate to satisfy the anticipated needs of our customers based on information derived from customers, market conditions, historic usage and industry research. Commitments for metal purchases are generally at prevailing market prices in effect at the time orders are placed or at the time of shipment. During periods of rising prices for metal, we may be negatively impacted by delays between the time of increases in the cost of metals to us and increases in the prices that we charge for our products if we are unable to pass these increased costs on to our customers immediately. In addition, when metal prices decline, customer demand for lower prices could result in lower sale prices for our products and, as we use existing inventory that we purchased at higher metal prices, lower margins. Consequently, during periods in which we use this existing inventory, the effects of changing metal prices could adversely affect our operating results. Our business could be adversely affected by economic downturns. Demand for our products is affected by a number of general economic factors. A decline in economic activity in the U.S. and other markets in which we operate could materially affect our financial condition and results of operation. The prices of metals are subject to fluctuations in the supply and demand for metals worldwide and changes in the worldwide balance of supply and demand could negatively impact our revenues, gross profit and net income. Metal prices are volatile due to, among other things, fluctuations in foreign and domestic production capacity, raw material availability, metals consumption and foreign currency rates. For example, in the past few years, China has significantly increased both its consumption and production of metals and metal products. Initially, China’s large and growing demand for metals significantly affected the metals industry by diverting supply to China and contributing to the global increases in metal prices. With China’s increased production of metals, it has recently become a net exporter of certain metals and this has somewhat reduced metal prices both within and outside of China. While this development can affect global pricing, it has yet to have a significant impact on U.S. pricing or the pricing for our products. Any future downturn in China’s general economic conditions or increases in its export of metals could cause a reduction in metal prices globally, which could adversely affect our revenues, gross profit and net income. Additionally, significant currency fluctuations in the United States or abroad could negatively impact our cost of metals and the pricing of our products. The decline in the dollar relative to foreign currencies in recent years has resulted in increased prices for metals and metal products in the United States as imported metals have become relatively more expensive. If, in the future, the dollar increases in value relative to foreign currencies, the U.S. market may be more attractive to foreign producers, resulting in increased supply that could cause decreased metal prices and adversely affect our revenues, gross profit and net income. We operate in an industry that is subject to cyclical fluctuations and any downturn in general economic conditions or in our customers’ specific industries could negatively impact our revenues, gross profit and net income. The metals service center industry is cyclical and impacted by both market demand and metals supply. Periods of economic slowdown or recession in the United States or other countries, or the public perception that these may occur, could decrease the 14