SlideShare a Scribd company logo
Investment Facts(As of September 30, 2016, unless noted)
Company Description
Realty Income, The Monthly Dividend Company®
, is an S&P 500 company. For 47 years our investors
have enjoyed monthly dividends, which have
steadily increased over time. The monthly
dividend is supported by over 4,700 freestanding
commercial properties that generate
rental revenue from long-term net lease
agreements. Realty Income was founded in
1969 and became a NYSE public company in
October 1994. NYSE Ticker Symbol: “O”.
AT A GLANCE:
Dividend
Increases
ANNUALIZED DIVIDENDS AND DIVIDEND INCREASES
(AS OF OCTOBER 26, 2016)
>	88 DIVIDEND INCREASES SINCE 1994
>	76 CONSECUTIVE QUARTERLY INCREASES
>	COMPOUND AVERAGE ANNUAL GROWTH RATE OF APPROXIMATELY 4.6%
>	555 CONSECUTIVE MONTHLY DIVIDENDS PAID FOR 47 YEARS
	REPRESENTING OVER $4.3 BILLION
$0.93
1995
1
$0.90
1994
$0.945
1996
1
$0.96
1997
1
$1.02
1998
4
$1.08
1999
4
$1.11
2000
4
$1.14
2001
4
$1.17
2002
4
$1.20
2003
4
$1.32
2004
5
$1.395
2005
5
$1.518
2006
5
$1.641
2007
5
$1.701
2008
5
$1.716
2009
4
$1.731
2010
4
$1.746
2011
4
$1.754
2012
5
$2.186
2013
5
$2.201
2014
4
$2.292
2015
5
$2.424*
2016
5
YTD
*Annualized dividend amount reflects the December declared dividend rate per share multiplied by twelve with the exception
of the 2016 column which reflects the current declared dividend rate per share multiplied by twelve.
The “Magic” of Rising Dividends Over Time
Increased Income = Increased investment return potential over time. The longer shareholders own Realty Income, the higher their “yield on
cost potential,” the greater the increase in dividend income, and the greater the potential for enhanced returns.
Example: Investors who purchased Realty Income shares on 12/31/2005 and collect their dividends have received (as of 9/30/2016):
> 11.2% yield on cost
> 210% increase in the value
of the original investment
> 74% increase in the amount
of annual dividend income
> 92% of the original investment
paid back as dividend income
Dividends
Received
Through
9/30/2016
$19,992
% of Original
Investment
Received in
Dividends
92%
Investment
Value as of
9/30/2016
$66,930
1,000 Shares
Purchased on
12/31/05
Original
Investment
$21,620
Original
Annual
Dividend
Income
$1,395
Original
Yield
6.5%
Current
Annual
Dividend
Income
$2,424
Current
Yield on
Cost at
9/30/2016
11.2%
Stock Information (as of October 26, 2016)
Ticker Symbol: “O” - NYSE
52-Week High/Low: $72.30 / $45.98
Dividend Information (as of October 26, 2016)
Annualized Dividend Amount: $2.424
Monthly Dividend Amount: $0.202
Dividend Yield: 4.0%
Investment Highlights: (since 1994 NYSE listing)
•	 Compound average annual return of 17.9%
•	 Compound average annual dividend growth
rate of approximately 4.6%
•	 Dividend growth of 169.3%
(as of October 26, 2016)
•	 Over $4.3 billion in dividends paid
(as of October 26, 2016)
•	 88 dividend increases
(as of October 26, 2016)
•	 Approximately $11.3 billion in real estate
	 investments since 2010 (including 2013 acquisition of ARCT)
•	 Total capitalization of $23.0 billion
•	Total equity market capitalization of $17.3 billion
•	 Total preferred capitalization of $408.8 million
•	 Total debt outstanding of approximately $5.28 billion
•	 Baa1 / BBB+ / BBB+ corporate debt ratings from 			
	 Moody’s / Standard & Poor’s / Fitch
•	 Member of S&P 500 index
•	 Member of S&P High Yield Dividend Aristocrats®
index(1)
David Butterfield
Director, Investor Relations
dbutterfield@realtyincome.com
Jim Thomson
Manager, Financial Relations
jthomson@realtyincome.com
Jonathan Pong, CFA, CPA
VP, Capital Markets
jpong@realtyincome.com
Note: Past performance doesn’t guarantee future performance.
In addition, dividends are paid only when declared by our Board of Directors
Top 20 Tenant Diversification
Walgreens* 	 7.3%
FedEx* 	 5.7%
Dollar General* 	 4.3%
LA Fitness 	 4.0%
Dollar Tree / Family Dollar	 4.0%
Circle K (Couche-Tard)*	 2.8%
AMC Theatres	 2.7%
BJ’s Wholesale Club	 2.5%
Diageo* 	 2.3%
CVS Pharmacy* 	 2.1%
Super America / Western Refining	 2.0%
GPM Investments / Fas Mart	 2.0%
Regal Cinemas 	 2.0%
Rite Aid 	 1.9%
Life Time Fitness	 1.9%
Walmart / Sam’s Club*	 1.8%
TBC Corporation (Sumitomo)* 	 1.6%
FreedomRoads / Camping World	 1.2%
NPC International	 1.1%
Smart & Final	 1.1%
*Tenants with investment-grade credit rating, including
subsidiaries of investment-grade rated companies
Realty Income Corporation
11995 El Camino Real
San Diego, CA 92130
800-375-6700
www.realtyincome.com
Realty Income Performance vs. Major Stock Indices
Dividend Reinvestment Can Potentially Enhance
Investment Returns
Company Highlights
> Focus on paying monthly rather than quarterly
dividends
> Track record of regularly increasing the
dividend
> Long-term real estate leases provide
dependable revenue from which we pay
dividends
> Conservative capital structure
> 20+ years trading on the New York Stock
Exchange
> Diversified sources of lease revenue–tenant,
industry, geography and property type
	• 247 commercial tenants
	• 47 industries
	• 49 states and Puerto Rico
> Member of S&P High Yield Dividend
Aristocrats®
index(1)
> Asset growth from 630 properties in 1994
	 to 4,703 properties
Realty Income Corporation
Equity REIT Index
Dow Jones Industrial Avg
Standard & Poor’s 500
NASDAQ Composite
Comparison of $100 Invested in Realty Income in 1994 vs. Major Stock Indices
100
300
500
700
900
1,100
1,300
1,500
1,700
1,900
2,100
2,300
2,500
2,700
2,900
3,100
3,300
1994 1995 1996 1997 1998 1999 2000 2001 2002 2003 2004 2005 2006 2007 2008 2009 2010 2011 2012 2013 2014 2015 Q3
2016
Realty
Income
Equity REIT
Index(2)
Dow Jones
Industrial Average S&P 500
NASDAQ
Composite
Dividend
Yield
Total
Return(3)
Dividend
Yield
Total
Return(4)
Dividend
Yield
Total
Return(4)
Dividend
Yield
Total
Return(4)
Dividend
Yield
Total
Return(5)
2004 5.2% 32.7% 4.7% 31.6% 2.2% 5.6% 1.8% 10.9% 0.6% 8.6%
2005 6.5% (9.2%) 4.6% 12.2% 2.6% 1.7% 1.9% 4.9% 0.9% 1.4%
2006 5.5% 34.8% 3.7% 35.1% 2.5% 19.0% 1.9% 15.8% 0.8% 9.5%
2007 6.1% 3.2% 4.9% (15.7%) 2.7% 8.8% 2.1% 5.5% 0.8% 9.8%
2008 7.3% (8.2%) 7.6% (37.7%) 3.6% (31.8%) 3.2% (37.0%) 1.3% (40.5%)
2009 6.6% 19.3% 3.7% 28.0% 2.6% 22.6% 2.0% 26.5% 1.0% 43.9%
2010 5.1% 38.6% 3.5% 27.9% 2.6% 14.0% 1.9% 15.1% 1.2% 16.9%
2011 5.0% 7.3% 3.8% 8.3% 2.8% 8.3% 2.3% 2.1% 1.3% (1.8%)
2012 4.5% 20.1% 3.5% 19.7% 3.0% 10.2% 2.5% 16.0% 2.6% 15.9%
2013 5.8% (1.8%) 3.9% 2.9% 2.3% 29.6% 2.0% 32.4% 1.4% 38.3%
2014 4.6% 33.7% 3.6% 28.0% 2.3% 10.0% 2.0% 13.7% 1.3% 13.4%
2015 4.4% 13.0% 3.9% 2.8% 2.6% 0.2% 2.2% 1.4% 1.4% 5.7%
Q3 YTD
2016
3.6% 33.1% 3.7% 12.3% 2.6% 7.2% 2.1% 7.8% 1.2% 6.1%
Compound Average
Annual Total Return(6) 17.9% 11.2% 9.8% 9.3% 9.2%
Note: All of these dividend yields are calculated as annualized dividends based on the last dividend paid in applicable time period divided by the closing price as of
period end.
Dividend yield sources: NAREIT website and Bloomberg, except for the 1994 NASDAQ dividend yield which was sourced from Datastream / Thomson Financial.
(1) The S&P High Yield Dividend Aristocrats® index is designed to measure the performance of companies within the S&P Composite 1500® that have followed a
managed-dividends policy of consistently increasing dividends every year for at least 20 years.		
(2) FTSE NAREIT US Equity REIT Index, as per NAREIT website.
(3) Calculated as the difference between the closing stock price as of period end less the closing stock price as of previous period, plus dividends paid in
period, divided by closing stock price as of end of previous period. Does not include reinvestment of dividends for the annual percentages.
(4) Includes reinvestment of dividends. Source: NAREIT website and Factset.
(5) Price only index, does not include dividends. Source: Factset.
(6) All of these Compound Average Annual Total Return rates are calculated in the same manner: from Realty Income’s NYSE listing on October 18, 1994
through September 30, 2016, and (except for NASDAQ) assuming reinvestment of dividends. Past performance does not guarantee future performance.
Realty Income presents this data for informational purposes only and makes no representation about its future performance or how it will compare in
performance to other indices in the future.

More Related Content

Similar to Realty Income Fact Sheet 3q 2016

Realty income-investor-presentation-4 q16
Realty income-investor-presentation-4 q16Realty income-investor-presentation-4 q16
Realty income-investor-presentation-4 q16
realtyincome2016
 
Alhuda CIBE - Presentation on Boardwalk real estate investment trust
Alhuda CIBE - Presentation on Boardwalk real estate investment trustAlhuda CIBE - Presentation on Boardwalk real estate investment trust
Alhuda CIBE - Presentation on Boardwalk real estate investment trust
Alhuda Centre of Islamic Banking & Economics
 
REIT Overview
REIT Overview REIT Overview
REIT Overview
Robert Scholem
 
Getting Through a Volatile Market
Getting Through a Volatile MarketGetting Through a Volatile Market
Getting Through a Volatile Market
JLinneman
 
slate-office-reit-q2-2022.pdf
slate-office-reit-q2-2022.pdfslate-office-reit-q2-2022.pdf
slate-office-reit-q2-2022.pdf
MichaelMarquina
 
Q4 2016 Final
Q4 2016 FinalQ4 2016 Final
Q4 2016 Final
morningstar2016ir
 
Temasek Review 2006 - Managing for Value
Temasek Review 2006 - Managing for ValueTemasek Review 2006 - Managing for Value
Temasek Review 2006 - Managing for Value
Temasek
 
sbi_dividend_yield_fund-ppt.pdf
sbi_dividend_yield_fund-ppt.pdfsbi_dividend_yield_fund-ppt.pdf
sbi_dividend_yield_fund-ppt.pdf
Kshitij Saxena
 
DSP Global Allocation Fund
DSP Global Allocation FundDSP Global Allocation Fund
DSP Global Allocation Fund
DSP Mutual Fund
 
Investor presentation
Investor presentationInvestor presentation
Investor presentation
rmrsir
 
Earnings 4Q15 Presentation
Earnings 4Q15 PresentationEarnings 4Q15 Presentation
Earnings 4Q15 Presentation
ir_digitalrealty
 
L Pch6
L Pch6L Pch6
L Pch6
Nguyen Thuy
 
Lehman Brothers Annual Report 2007
Lehman Brothers Annual Report 2007Lehman Brothers Annual Report 2007
Lehman Brothers Annual Report 2007
QuarterlyEarningsReports3
 
Long Term Investment Performance
Long Term Investment PerformanceLong Term Investment Performance
Long Term Investment Performance
Greg Ferguson
 
Brookfield Asset Management Corporate Profile
Brookfield Asset Management Corporate ProfileBrookfield Asset Management Corporate Profile
Brookfield Asset Management Corporate Profile
Haroon Rashid
 
Q1 2017 presentation deck
Q1 2017 presentation deckQ1 2017 presentation deck
Q1 2017 presentation deck
Masco_Investors
 
Best mutual funds for 2018
Best mutual funds for 2018Best mutual funds for 2018
Best mutual funds for 2018
Carla Olson
 
Financial ratios
Financial ratiosFinancial ratios
Financial ratios
elthea18
 
Barclays reit conf (12 11 13)
Barclays reit conf (12 11 13)Barclays reit conf (12 11 13)
Barclays reit conf (12 11 13)
IronMInc
 
Sir investor presentation sept 2015 final
Sir investor presentation sept 2015 finalSir investor presentation sept 2015 final
Sir investor presentation sept 2015 final
rmrsir
 

Similar to Realty Income Fact Sheet 3q 2016 (20)

Realty income-investor-presentation-4 q16
Realty income-investor-presentation-4 q16Realty income-investor-presentation-4 q16
Realty income-investor-presentation-4 q16
 
Alhuda CIBE - Presentation on Boardwalk real estate investment trust
Alhuda CIBE - Presentation on Boardwalk real estate investment trustAlhuda CIBE - Presentation on Boardwalk real estate investment trust
Alhuda CIBE - Presentation on Boardwalk real estate investment trust
 
REIT Overview
REIT Overview REIT Overview
REIT Overview
 
Getting Through a Volatile Market
Getting Through a Volatile MarketGetting Through a Volatile Market
Getting Through a Volatile Market
 
slate-office-reit-q2-2022.pdf
slate-office-reit-q2-2022.pdfslate-office-reit-q2-2022.pdf
slate-office-reit-q2-2022.pdf
 
Q4 2016 Final
Q4 2016 FinalQ4 2016 Final
Q4 2016 Final
 
Temasek Review 2006 - Managing for Value
Temasek Review 2006 - Managing for ValueTemasek Review 2006 - Managing for Value
Temasek Review 2006 - Managing for Value
 
sbi_dividend_yield_fund-ppt.pdf
sbi_dividend_yield_fund-ppt.pdfsbi_dividend_yield_fund-ppt.pdf
sbi_dividend_yield_fund-ppt.pdf
 
DSP Global Allocation Fund
DSP Global Allocation FundDSP Global Allocation Fund
DSP Global Allocation Fund
 
Investor presentation
Investor presentationInvestor presentation
Investor presentation
 
Earnings 4Q15 Presentation
Earnings 4Q15 PresentationEarnings 4Q15 Presentation
Earnings 4Q15 Presentation
 
L Pch6
L Pch6L Pch6
L Pch6
 
Lehman Brothers Annual Report 2007
Lehman Brothers Annual Report 2007Lehman Brothers Annual Report 2007
Lehman Brothers Annual Report 2007
 
Long Term Investment Performance
Long Term Investment PerformanceLong Term Investment Performance
Long Term Investment Performance
 
Brookfield Asset Management Corporate Profile
Brookfield Asset Management Corporate ProfileBrookfield Asset Management Corporate Profile
Brookfield Asset Management Corporate Profile
 
Q1 2017 presentation deck
Q1 2017 presentation deckQ1 2017 presentation deck
Q1 2017 presentation deck
 
Best mutual funds for 2018
Best mutual funds for 2018Best mutual funds for 2018
Best mutual funds for 2018
 
Financial ratios
Financial ratiosFinancial ratios
Financial ratios
 
Barclays reit conf (12 11 13)
Barclays reit conf (12 11 13)Barclays reit conf (12 11 13)
Barclays reit conf (12 11 13)
 
Sir investor presentation sept 2015 final
Sir investor presentation sept 2015 finalSir investor presentation sept 2015 final
Sir investor presentation sept 2015 final
 

Recently uploaded

Cyberagent_For New Investors_EN_240424.pdf
Cyberagent_For New Investors_EN_240424.pdfCyberagent_For New Investors_EN_240424.pdf
Cyberagent_For New Investors_EN_240424.pdf
CyberAgent, Inc.
 
Collective Mining | Corporate Presentation - June 2024
Collective Mining  | Corporate Presentation - June 2024Collective Mining  | Corporate Presentation - June 2024
Collective Mining | Corporate Presentation - June 2024
CollectiveMining1
 
一比一原版(UAL毕业证)伦敦艺术大学毕业证如何办理
一比一原版(UAL毕业证)伦敦艺术大学毕业证如何办理一比一原版(UAL毕业证)伦敦艺术大学毕业证如何办理
一比一原版(UAL毕业证)伦敦艺术大学毕业证如何办理
nupyb
 
mba project CRED.docx report for students final year
mba project CRED.docx report for students final yearmba project CRED.docx report for students final year
mba project CRED.docx report for students final year
JyothisaiBhavya4
 
Osisko Gold Royalties Ltd - Corporate Presentation, June 12, 2024
Osisko Gold Royalties Ltd - Corporate Presentation, June 12, 2024Osisko Gold Royalties Ltd - Corporate Presentation, June 12, 2024
Osisko Gold Royalties Ltd - Corporate Presentation, June 12, 2024
Osisko Gold Royalties Ltd
 
ZKsync airdrop of 3.6 billion ZK tokens is scheduled by ZKsync for next week.pdf
ZKsync airdrop of 3.6 billion ZK tokens is scheduled by ZKsync for next week.pdfZKsync airdrop of 3.6 billion ZK tokens is scheduled by ZKsync for next week.pdf
ZKsync airdrop of 3.6 billion ZK tokens is scheduled by ZKsync for next week.pdf
SOFTTECHHUB
 
一比一原版(uvic毕业证书)加拿大维多利亚大学毕业证如何办理
一比一原版(uvic毕业证书)加拿大维多利亚大学毕业证如何办理一比一原版(uvic毕业证书)加拿大维多利亚大学毕业证如何办理
一比一原版(uvic毕业证书)加拿大维多利亚大学毕业证如何办理
ufomhev
 
Cove Multifamily Income Fund 28 LLC IOI 3.3.2021 (1).pdf
Cove Multifamily Income Fund 28 LLC IOI 3.3.2021 (1).pdfCove Multifamily Income Fund 28 LLC IOI 3.3.2021 (1).pdf
Cove Multifamily Income Fund 28 LLC IOI 3.3.2021 (1).pdf
kboyd6
 
Corporate Presentation Probe June 2024.pdf
Corporate Presentation Probe June 2024.pdfCorporate Presentation Probe June 2024.pdf
Corporate Presentation Probe June 2024.pdf
Probe Gold
 
UnityNet World Environment Day Abraham Project 2024 Press Release
UnityNet World Environment Day Abraham Project 2024 Press ReleaseUnityNet World Environment Day Abraham Project 2024 Press Release
UnityNet World Environment Day Abraham Project 2024 Press Release
LHelferty
 
Methanex Investor Presentation - April 2024
Methanex Investor Presentation - April 2024Methanex Investor Presentation - April 2024
Methanex Investor Presentation - April 2024
Methanex Corporation
 
Mandalay Resouces June 2024 Investor Relations PPT
Mandalay Resouces June 2024 Investor Relations PPTMandalay Resouces June 2024 Investor Relations PPT
Mandalay Resouces June 2024 Investor Relations PPT
MandalayResources
 
Cleades robinson:The Diplomat is Blue
Cleades robinson:The Diplomat is BlueCleades robinson:The Diplomat is Blue
Cleades robinson:The Diplomat is Blue
Cleades Robinson
 
一比一原版(Carleton毕业证)加拿大卡尔顿大学毕业证如何办理
一比一原版(Carleton毕业证)加拿大卡尔顿大学毕业证如何办理一比一原版(Carleton毕业证)加拿大卡尔顿大学毕业证如何办理
一比一原版(Carleton毕业证)加拿大卡尔顿大学毕业证如何办理
ybjk9iyd
 
AGM Presentation Probe June 11 Final.pdf
AGM Presentation Probe June 11 Final.pdfAGM Presentation Probe June 11 Final.pdf
AGM Presentation Probe June 11 Final.pdf
Probe Gold
 
一比一原版格罗宁根大学毕业证(RUG毕业证书)学历如何办理
一比一原版格罗宁根大学毕业证(RUG毕业证书)学历如何办理一比一原版格罗宁根大学毕业证(RUG毕业证书)学历如何办理
一比一原版格罗宁根大学毕业证(RUG毕业证书)学历如何办理
gyucof
 
Voyager Space_Management Presentation_Final
Voyager Space_Management Presentation_FinalVoyager Space_Management Presentation_Final
Voyager Space_Management Presentation_Final
kboyd6
 

Recently uploaded (17)

Cyberagent_For New Investors_EN_240424.pdf
Cyberagent_For New Investors_EN_240424.pdfCyberagent_For New Investors_EN_240424.pdf
Cyberagent_For New Investors_EN_240424.pdf
 
Collective Mining | Corporate Presentation - June 2024
Collective Mining  | Corporate Presentation - June 2024Collective Mining  | Corporate Presentation - June 2024
Collective Mining | Corporate Presentation - June 2024
 
一比一原版(UAL毕业证)伦敦艺术大学毕业证如何办理
一比一原版(UAL毕业证)伦敦艺术大学毕业证如何办理一比一原版(UAL毕业证)伦敦艺术大学毕业证如何办理
一比一原版(UAL毕业证)伦敦艺术大学毕业证如何办理
 
mba project CRED.docx report for students final year
mba project CRED.docx report for students final yearmba project CRED.docx report for students final year
mba project CRED.docx report for students final year
 
Osisko Gold Royalties Ltd - Corporate Presentation, June 12, 2024
Osisko Gold Royalties Ltd - Corporate Presentation, June 12, 2024Osisko Gold Royalties Ltd - Corporate Presentation, June 12, 2024
Osisko Gold Royalties Ltd - Corporate Presentation, June 12, 2024
 
ZKsync airdrop of 3.6 billion ZK tokens is scheduled by ZKsync for next week.pdf
ZKsync airdrop of 3.6 billion ZK tokens is scheduled by ZKsync for next week.pdfZKsync airdrop of 3.6 billion ZK tokens is scheduled by ZKsync for next week.pdf
ZKsync airdrop of 3.6 billion ZK tokens is scheduled by ZKsync for next week.pdf
 
一比一原版(uvic毕业证书)加拿大维多利亚大学毕业证如何办理
一比一原版(uvic毕业证书)加拿大维多利亚大学毕业证如何办理一比一原版(uvic毕业证书)加拿大维多利亚大学毕业证如何办理
一比一原版(uvic毕业证书)加拿大维多利亚大学毕业证如何办理
 
Cove Multifamily Income Fund 28 LLC IOI 3.3.2021 (1).pdf
Cove Multifamily Income Fund 28 LLC IOI 3.3.2021 (1).pdfCove Multifamily Income Fund 28 LLC IOI 3.3.2021 (1).pdf
Cove Multifamily Income Fund 28 LLC IOI 3.3.2021 (1).pdf
 
Corporate Presentation Probe June 2024.pdf
Corporate Presentation Probe June 2024.pdfCorporate Presentation Probe June 2024.pdf
Corporate Presentation Probe June 2024.pdf
 
UnityNet World Environment Day Abraham Project 2024 Press Release
UnityNet World Environment Day Abraham Project 2024 Press ReleaseUnityNet World Environment Day Abraham Project 2024 Press Release
UnityNet World Environment Day Abraham Project 2024 Press Release
 
Methanex Investor Presentation - April 2024
Methanex Investor Presentation - April 2024Methanex Investor Presentation - April 2024
Methanex Investor Presentation - April 2024
 
Mandalay Resouces June 2024 Investor Relations PPT
Mandalay Resouces June 2024 Investor Relations PPTMandalay Resouces June 2024 Investor Relations PPT
Mandalay Resouces June 2024 Investor Relations PPT
 
Cleades robinson:The Diplomat is Blue
Cleades robinson:The Diplomat is BlueCleades robinson:The Diplomat is Blue
Cleades robinson:The Diplomat is Blue
 
一比一原版(Carleton毕业证)加拿大卡尔顿大学毕业证如何办理
一比一原版(Carleton毕业证)加拿大卡尔顿大学毕业证如何办理一比一原版(Carleton毕业证)加拿大卡尔顿大学毕业证如何办理
一比一原版(Carleton毕业证)加拿大卡尔顿大学毕业证如何办理
 
AGM Presentation Probe June 11 Final.pdf
AGM Presentation Probe June 11 Final.pdfAGM Presentation Probe June 11 Final.pdf
AGM Presentation Probe June 11 Final.pdf
 
一比一原版格罗宁根大学毕业证(RUG毕业证书)学历如何办理
一比一原版格罗宁根大学毕业证(RUG毕业证书)学历如何办理一比一原版格罗宁根大学毕业证(RUG毕业证书)学历如何办理
一比一原版格罗宁根大学毕业证(RUG毕业证书)学历如何办理
 
Voyager Space_Management Presentation_Final
Voyager Space_Management Presentation_FinalVoyager Space_Management Presentation_Final
Voyager Space_Management Presentation_Final
 

Realty Income Fact Sheet 3q 2016

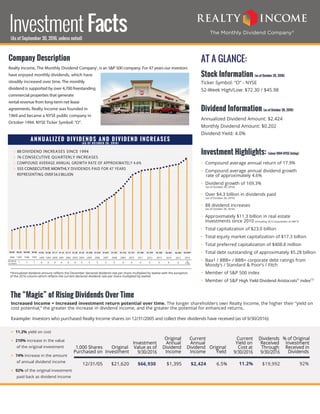
  • 1. Investment Facts(As of September 30, 2016, unless noted) Company Description Realty Income, The Monthly Dividend Company® , is an S&P 500 company. For 47 years our investors have enjoyed monthly dividends, which have steadily increased over time. The monthly dividend is supported by over 4,700 freestanding commercial properties that generate rental revenue from long-term net lease agreements. Realty Income was founded in 1969 and became a NYSE public company in October 1994. NYSE Ticker Symbol: “O”. AT A GLANCE: Dividend Increases ANNUALIZED DIVIDENDS AND DIVIDEND INCREASES (AS OF OCTOBER 26, 2016) > 88 DIVIDEND INCREASES SINCE 1994 > 76 CONSECUTIVE QUARTERLY INCREASES > COMPOUND AVERAGE ANNUAL GROWTH RATE OF APPROXIMATELY 4.6% > 555 CONSECUTIVE MONTHLY DIVIDENDS PAID FOR 47 YEARS REPRESENTING OVER $4.3 BILLION $0.93 1995 1 $0.90 1994 $0.945 1996 1 $0.96 1997 1 $1.02 1998 4 $1.08 1999 4 $1.11 2000 4 $1.14 2001 4 $1.17 2002 4 $1.20 2003 4 $1.32 2004 5 $1.395 2005 5 $1.518 2006 5 $1.641 2007 5 $1.701 2008 5 $1.716 2009 4 $1.731 2010 4 $1.746 2011 4 $1.754 2012 5 $2.186 2013 5 $2.201 2014 4 $2.292 2015 5 $2.424* 2016 5 YTD *Annualized dividend amount reflects the December declared dividend rate per share multiplied by twelve with the exception of the 2016 column which reflects the current declared dividend rate per share multiplied by twelve. The “Magic” of Rising Dividends Over Time Increased Income = Increased investment return potential over time. The longer shareholders own Realty Income, the higher their “yield on cost potential,” the greater the increase in dividend income, and the greater the potential for enhanced returns. Example: Investors who purchased Realty Income shares on 12/31/2005 and collect their dividends have received (as of 9/30/2016): > 11.2% yield on cost > 210% increase in the value of the original investment > 74% increase in the amount of annual dividend income > 92% of the original investment paid back as dividend income Dividends Received Through 9/30/2016 $19,992 % of Original Investment Received in Dividends 92% Investment Value as of 9/30/2016 $66,930 1,000 Shares Purchased on 12/31/05 Original Investment $21,620 Original Annual Dividend Income $1,395 Original Yield 6.5% Current Annual Dividend Income $2,424 Current Yield on Cost at 9/30/2016 11.2% Stock Information (as of October 26, 2016) Ticker Symbol: “O” - NYSE 52-Week High/Low: $72.30 / $45.98 Dividend Information (as of October 26, 2016) Annualized Dividend Amount: $2.424 Monthly Dividend Amount: $0.202 Dividend Yield: 4.0% Investment Highlights: (since 1994 NYSE listing) • Compound average annual return of 17.9% • Compound average annual dividend growth rate of approximately 4.6% • Dividend growth of 169.3% (as of October 26, 2016) • Over $4.3 billion in dividends paid (as of October 26, 2016) • 88 dividend increases (as of October 26, 2016) • Approximately $11.3 billion in real estate investments since 2010 (including 2013 acquisition of ARCT) • Total capitalization of $23.0 billion • Total equity market capitalization of $17.3 billion • Total preferred capitalization of $408.8 million • Total debt outstanding of approximately $5.28 billion • Baa1 / BBB+ / BBB+ corporate debt ratings from Moody’s / Standard & Poor’s / Fitch • Member of S&P 500 index • Member of S&P High Yield Dividend Aristocrats® index(1)
  • 2. David Butterfield Director, Investor Relations dbutterfield@realtyincome.com Jim Thomson Manager, Financial Relations jthomson@realtyincome.com Jonathan Pong, CFA, CPA VP, Capital Markets jpong@realtyincome.com Note: Past performance doesn’t guarantee future performance. In addition, dividends are paid only when declared by our Board of Directors Top 20 Tenant Diversification Walgreens* 7.3% FedEx* 5.7% Dollar General* 4.3% LA Fitness 4.0% Dollar Tree / Family Dollar 4.0% Circle K (Couche-Tard)* 2.8% AMC Theatres 2.7% BJ’s Wholesale Club 2.5% Diageo* 2.3% CVS Pharmacy* 2.1% Super America / Western Refining 2.0% GPM Investments / Fas Mart 2.0% Regal Cinemas 2.0% Rite Aid 1.9% Life Time Fitness 1.9% Walmart / Sam’s Club* 1.8% TBC Corporation (Sumitomo)* 1.6% FreedomRoads / Camping World 1.2% NPC International 1.1% Smart & Final 1.1% *Tenants with investment-grade credit rating, including subsidiaries of investment-grade rated companies Realty Income Corporation 11995 El Camino Real San Diego, CA 92130 800-375-6700 www.realtyincome.com Realty Income Performance vs. Major Stock Indices Dividend Reinvestment Can Potentially Enhance Investment Returns Company Highlights > Focus on paying monthly rather than quarterly dividends > Track record of regularly increasing the dividend > Long-term real estate leases provide dependable revenue from which we pay dividends > Conservative capital structure > 20+ years trading on the New York Stock Exchange > Diversified sources of lease revenue–tenant, industry, geography and property type • 247 commercial tenants • 47 industries • 49 states and Puerto Rico > Member of S&P High Yield Dividend Aristocrats® index(1) > Asset growth from 630 properties in 1994 to 4,703 properties Realty Income Corporation Equity REIT Index Dow Jones Industrial Avg Standard & Poor’s 500 NASDAQ Composite Comparison of $100 Invested in Realty Income in 1994 vs. Major Stock Indices 100 300 500 700 900 1,100 1,300 1,500 1,700 1,900 2,100 2,300 2,500 2,700 2,900 3,100 3,300 1994 1995 1996 1997 1998 1999 2000 2001 2002 2003 2004 2005 2006 2007 2008 2009 2010 2011 2012 2013 2014 2015 Q3 2016 Realty Income Equity REIT Index(2) Dow Jones Industrial Average S&P 500 NASDAQ Composite Dividend Yield Total Return(3) Dividend Yield Total Return(4) Dividend Yield Total Return(4) Dividend Yield Total Return(4) Dividend Yield Total Return(5) 2004 5.2% 32.7% 4.7% 31.6% 2.2% 5.6% 1.8% 10.9% 0.6% 8.6% 2005 6.5% (9.2%) 4.6% 12.2% 2.6% 1.7% 1.9% 4.9% 0.9% 1.4% 2006 5.5% 34.8% 3.7% 35.1% 2.5% 19.0% 1.9% 15.8% 0.8% 9.5% 2007 6.1% 3.2% 4.9% (15.7%) 2.7% 8.8% 2.1% 5.5% 0.8% 9.8% 2008 7.3% (8.2%) 7.6% (37.7%) 3.6% (31.8%) 3.2% (37.0%) 1.3% (40.5%) 2009 6.6% 19.3% 3.7% 28.0% 2.6% 22.6% 2.0% 26.5% 1.0% 43.9% 2010 5.1% 38.6% 3.5% 27.9% 2.6% 14.0% 1.9% 15.1% 1.2% 16.9% 2011 5.0% 7.3% 3.8% 8.3% 2.8% 8.3% 2.3% 2.1% 1.3% (1.8%) 2012 4.5% 20.1% 3.5% 19.7% 3.0% 10.2% 2.5% 16.0% 2.6% 15.9% 2013 5.8% (1.8%) 3.9% 2.9% 2.3% 29.6% 2.0% 32.4% 1.4% 38.3% 2014 4.6% 33.7% 3.6% 28.0% 2.3% 10.0% 2.0% 13.7% 1.3% 13.4% 2015 4.4% 13.0% 3.9% 2.8% 2.6% 0.2% 2.2% 1.4% 1.4% 5.7% Q3 YTD 2016 3.6% 33.1% 3.7% 12.3% 2.6% 7.2% 2.1% 7.8% 1.2% 6.1% Compound Average Annual Total Return(6) 17.9% 11.2% 9.8% 9.3% 9.2% Note: All of these dividend yields are calculated as annualized dividends based on the last dividend paid in applicable time period divided by the closing price as of period end. Dividend yield sources: NAREIT website and Bloomberg, except for the 1994 NASDAQ dividend yield which was sourced from Datastream / Thomson Financial. (1) The S&P High Yield Dividend Aristocrats® index is designed to measure the performance of companies within the S&P Composite 1500® that have followed a managed-dividends policy of consistently increasing dividends every year for at least 20 years. (2) FTSE NAREIT US Equity REIT Index, as per NAREIT website. (3) Calculated as the difference between the closing stock price as of period end less the closing stock price as of previous period, plus dividends paid in period, divided by closing stock price as of end of previous period. Does not include reinvestment of dividends for the annual percentages. (4) Includes reinvestment of dividends. Source: NAREIT website and Factset. (5) Price only index, does not include dividends. Source: Factset. (6) All of these Compound Average Annual Total Return rates are calculated in the same manner: from Realty Income’s NYSE listing on October 18, 1994 through September 30, 2016, and (except for NASDAQ) assuming reinvestment of dividends. Past performance does not guarantee future performance. Realty Income presents this data for informational purposes only and makes no representation about its future performance or how it will compare in performance to other indices in the future.