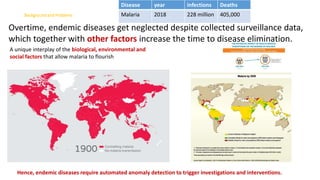
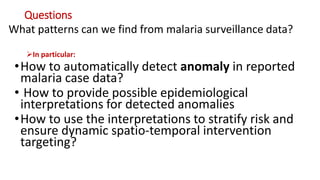
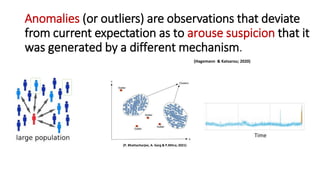
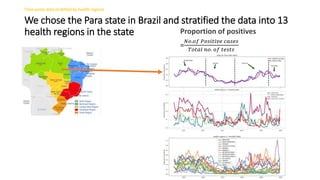
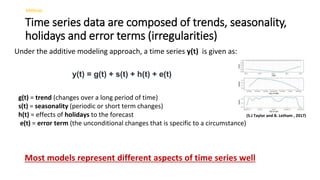
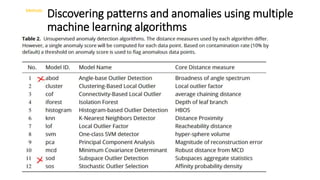
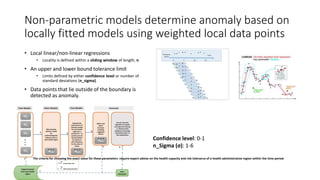
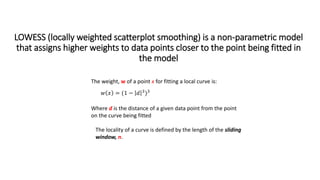
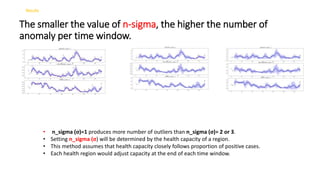
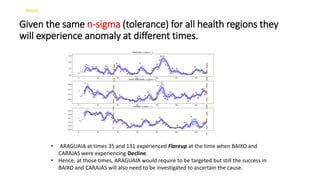
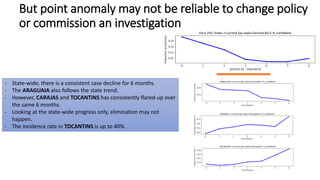
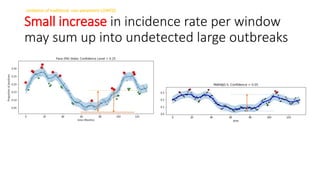
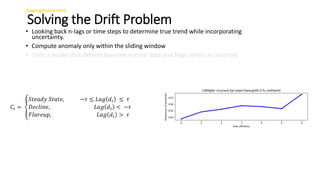
Real-time anomaly detection in disease surveillance data
Dr. Peter Eze
Peter.eze@unimelb.edu.au
(with Ivo Mueller, Nic Geard and Iadine Chades)
Research Fellow, AI for Decision Support
School of Computing and Information Systems
Faculty of Engineering and Engineering Technology
University of Melbourne, Australia
23rd May, 2022
Background and Problems
Overtime, endemic diseases get neglected despite collected surveillance data,
which together with other factors increase the time to disease elimination.
Hence, endemic diseases require automated anomaly detection to trigger investigations and interventions.
A unique interplay of the biological, environmental and
social factors that allow malaria to flourish
Disease year infections Deaths
Malaria 2018 228 million 405,000
Questions
In particular:
•How to automatically detect anomaly in reported
malaria case data?
• How to provide possible epidemiological
interpretations for detected anomalies
•How to use the interpretations to stratify risk and
ensure dynamic spatio-temporal intervention
targeting?
What patterns can we find from malaria surveillance data?
Anomalies (or outliers) are observations that deviate
from current expectation as to arouse suspicion that it
was generated by a different mechanism.
(Hagemann & Katsarou; 2020)
(P. Bhattacharjee, A. Garg & P.Mitra; 2021)
Time
We transformed the Brazilian Amazon malaria time series data to
help detect anomalies in testing and incident rate
• Proportion of positives
• Positive cases
• Number of tests
• negatives
Source of Dataset: https://www.synapse.org/##!Synapse:syn21555933
Data source and features for anomaly detection
We chose the Para state in Brazil and stratified the data into 13
health regions in the state Proportion of positives
=
𝑁𝑜.𝑜𝑓 𝑃𝑜𝑠𝑖𝑡𝑖𝑣𝑒 𝑐𝑎𝑠𝑒𝑠
𝑇𝑜𝑡𝑎𝑙 𝑛𝑜. 𝑜𝑓 𝑡𝑒𝑠𝑡𝑠
Time series data stratified by health regions
Time series data are composed of trends, seasonality,
holidays and error terms (irregularities)
y(t) = g(t) + s(t) + h(t) + e(t)
g(t) = trend (changes over a long period of time)
s(t) = seasonality (periodic or short term changes)
h(t) = effects of holidays to the forecast
e(t) = error term (the unconditional changes that is specific to a circumstance)
Under the additive modeling approach, a time series y(t) is given as:
(S.J Taylor and B. Letham , 2017)
Most models represent different aspects of time series well
Methods
Discovering patterns and anomalies using multiple
machine learning algorithms
Facebook Prophet LSTM
Methods
Non-parametric models determine anomaly based on
locally fitted models using weighted local data points
• Local linear/non-linear regressions
• Locality is defined within a sliding window of length, n.
• An upper and lower bound tolerance limit
• Limits defined by either confidence level or number of
standard deviations (n_sigma).
• Data points that lie outside of the boundary is
detected as anomaly.
Confidence level: 0-1
n_Sigma (σ): 1-6
The criteria for choosing the exact value for these parameters require expert advise on the health capacity and risk tolerance of a health administrative region within the time period
LOWESS (locally weighted scatterplot smoothing) is a non-parametric model
that assigns higher weights to data points closer to the point being fitted in
the model
𝑤 𝑥 = (1 − 𝑑 3
)3
Where d is the distance of a given data point from the point
on the curve being fitted
The weight, w of a point x for fitting a local curve is:
The locality of a curve is defined by the length of the sliding
window, n.
The smaller the value of n-sigma, the higher the number of
anomaly per time window.
• n_sigma (σ)=1 produces more number of outliers than n_sigma (σ)= 2 or 3.
• Setting n_sigma (σ) will be determined by the health capacity of a region.
• This method assumes that health capacity closely follows proportion of positive cases.
• Each health region would adjust capacity at the end of each time window.
Results
Given the same n-sigma (tolerance) for all health regions they
will experience anomaly at different times.
• ARAGUAIA at times 35 and 131 experienced Flareup at the time when BAIXO and
CARAJAS were experiencing Decline.
• Hence, at those times, ARAGUAIA would require to be targeted but still the success in
BAIXO and CARAJAS will also need to be investigated to ascertain the cause.
Results
But point anomaly may not be reliable to change policy
or commission an investigation
- State-wide, there is a consistent case decline for 6 months.
- The ARAGUAIA also follows the state trend.
- However, CARAJAS and TOCANTINS has consistently flared-up over
the same 6 months.
- Looking at the state-wide progress only, elimination may not
happen.
- The incidence rate in TOCANTINS is up to 40%.
Limitation of traditional non-parametric LOWESS
Small increase in incidence rate per window
may sum up into undetected large outbreaks
Solving the Drift Problem
• Looking back n-lags or time steps to determine true trend while incorporating
uncertainty.
• Compute anomaly only within the sliding window
• Train a model that detects baseline normal data and flags others as anomaly.
𝐶𝑖 =
𝑆𝑡𝑒𝑎𝑑𝑦 𝑆𝑡𝑎𝑡𝑒, −𝜏 ≤ 𝐿𝑎𝑔 𝑑𝑖 ≤ 𝜏
𝐷𝑒𝑐𝑙𝑖𝑛𝑒, 𝐿𝑎𝑔 𝑑𝑖 < −𝜏
𝐹𝑙𝑎𝑟𝑒𝑢𝑝, 𝐿𝑎𝑔 𝑑𝑖 > 𝜏
Ongoing/Future Work
» With the rising threats of pandemics and climate change, global
attention and funding for mitigating the inequitable burden of
malaria is more necessary than ever.
» Because data for endemic diseases such as malaria are not
analysed by humans on daily basis, automated methods can
help to provide proactive decision support.
» We have developed a tool to help identify appropriate anomaly
thresholds for health regions:
https://github.com/KingPeter2014/Anomaly_in_malaria_surveillance_data
Summary
» T. Hagemann and K. Katsarou. A Systematic Review on Anomaly Detection for Cloud Computing
Environments.2020. doi: https://doi.org/10.1145/3442536.3442550
» Understanding LSTMs. https://colah.github.io/posts/2015-08-Understanding-LSTMs/
» B. Agrawal, T. Wiktorski & C. Rong. Adaptive Real-Time Anomaly Detection in Cloud Infrastructures. 2018 1st
International Conference on Data Intelligence and Security (ICDIS).
» J. Clark, Z. Liu and N. Japkowicz, "Adaptive Threshold for Outlier Detection on Data Streams," 2018 IEEE 5th
International Conference on Data Science and Advanced Analytics (DSAA), 2018, pp. 41-49, doi:
10.1109/DSAA.2018.00014.
» S.J Taylor and B. Letham . Forecasting at Scale. https://peerj.com/preprints/3190.pdf , 2017.
» SIVEP-Malaria database. IntegratedDataset.csv: Derived from Brazilian epidemiological surveillance system of
malaria (2020). https://www.synapse.org/##!Synapse:syn21555933.
References

Realtime anomaly detection in surveillance data.pptx

  • 1.
    Real-time anomaly detectionin disease surveillance data Dr. Peter Eze Peter.eze@unimelb.edu.au (with Ivo Mueller, Nic Geard and Iadine Chades) Research Fellow, AI for Decision Support School of Computing and Information Systems Faculty of Engineering and Engineering Technology University of Melbourne, Australia 23rd May, 2022
  • 2.
    Background and Problems Overtime,endemic diseases get neglected despite collected surveillance data, which together with other factors increase the time to disease elimination. Hence, endemic diseases require automated anomaly detection to trigger investigations and interventions. A unique interplay of the biological, environmental and social factors that allow malaria to flourish Disease year infections Deaths Malaria 2018 228 million 405,000
  • 3.
    Questions In particular: •How toautomatically detect anomaly in reported malaria case data? • How to provide possible epidemiological interpretations for detected anomalies •How to use the interpretations to stratify risk and ensure dynamic spatio-temporal intervention targeting? What patterns can we find from malaria surveillance data?
  • 4.
    Anomalies (or outliers)are observations that deviate from current expectation as to arouse suspicion that it was generated by a different mechanism. (Hagemann & Katsarou; 2020) (P. Bhattacharjee, A. Garg & P.Mitra; 2021) Time
  • 5.
    We transformed theBrazilian Amazon malaria time series data to help detect anomalies in testing and incident rate • Proportion of positives • Positive cases • Number of tests • negatives Source of Dataset: https://www.synapse.org/##!Synapse:syn21555933 Data source and features for anomaly detection
  • 6.
    We chose thePara state in Brazil and stratified the data into 13 health regions in the state Proportion of positives = 𝑁𝑜.𝑜𝑓 𝑃𝑜𝑠𝑖𝑡𝑖𝑣𝑒 𝑐𝑎𝑠𝑒𝑠 𝑇𝑜𝑡𝑎𝑙 𝑛𝑜. 𝑜𝑓 𝑡𝑒𝑠𝑡𝑠 Time series data stratified by health regions
  • 7.
    Time series dataare composed of trends, seasonality, holidays and error terms (irregularities) y(t) = g(t) + s(t) + h(t) + e(t) g(t) = trend (changes over a long period of time) s(t) = seasonality (periodic or short term changes) h(t) = effects of holidays to the forecast e(t) = error term (the unconditional changes that is specific to a circumstance) Under the additive modeling approach, a time series y(t) is given as: (S.J Taylor and B. Letham , 2017) Most models represent different aspects of time series well Methods
  • 8.
    Discovering patterns andanomalies using multiple machine learning algorithms Facebook Prophet LSTM Methods
  • 9.
    Non-parametric models determineanomaly based on locally fitted models using weighted local data points • Local linear/non-linear regressions • Locality is defined within a sliding window of length, n. • An upper and lower bound tolerance limit • Limits defined by either confidence level or number of standard deviations (n_sigma). • Data points that lie outside of the boundary is detected as anomaly. Confidence level: 0-1 n_Sigma (σ): 1-6 The criteria for choosing the exact value for these parameters require expert advise on the health capacity and risk tolerance of a health administrative region within the time period
  • 10.
    LOWESS (locally weightedscatterplot smoothing) is a non-parametric model that assigns higher weights to data points closer to the point being fitted in the model 𝑤 𝑥 = (1 − 𝑑 3 )3 Where d is the distance of a given data point from the point on the curve being fitted The weight, w of a point x for fitting a local curve is: The locality of a curve is defined by the length of the sliding window, n.
  • 11.
    The smaller thevalue of n-sigma, the higher the number of anomaly per time window. • n_sigma (σ)=1 produces more number of outliers than n_sigma (σ)= 2 or 3. • Setting n_sigma (σ) will be determined by the health capacity of a region. • This method assumes that health capacity closely follows proportion of positive cases. • Each health region would adjust capacity at the end of each time window. Results
  • 12.
    Given the samen-sigma (tolerance) for all health regions they will experience anomaly at different times. • ARAGUAIA at times 35 and 131 experienced Flareup at the time when BAIXO and CARAJAS were experiencing Decline. • Hence, at those times, ARAGUAIA would require to be targeted but still the success in BAIXO and CARAJAS will also need to be investigated to ascertain the cause. Results
  • 13.
    But point anomalymay not be reliable to change policy or commission an investigation - State-wide, there is a consistent case decline for 6 months. - The ARAGUAIA also follows the state trend. - However, CARAJAS and TOCANTINS has consistently flared-up over the same 6 months. - Looking at the state-wide progress only, elimination may not happen. - The incidence rate in TOCANTINS is up to 40%.
  • 14.
    Limitation of traditionalnon-parametric LOWESS Small increase in incidence rate per window may sum up into undetected large outbreaks
  • 15.
    Solving the DriftProblem • Looking back n-lags or time steps to determine true trend while incorporating uncertainty. • Compute anomaly only within the sliding window • Train a model that detects baseline normal data and flags others as anomaly. 𝐶𝑖 = 𝑆𝑡𝑒𝑎𝑑𝑦 𝑆𝑡𝑎𝑡𝑒, −𝜏 ≤ 𝐿𝑎𝑔 𝑑𝑖 ≤ 𝜏 𝐷𝑒𝑐𝑙𝑖𝑛𝑒, 𝐿𝑎𝑔 𝑑𝑖 < −𝜏 𝐹𝑙𝑎𝑟𝑒𝑢𝑝, 𝐿𝑎𝑔 𝑑𝑖 > 𝜏 Ongoing/Future Work
  • 16.
    » With therising threats of pandemics and climate change, global attention and funding for mitigating the inequitable burden of malaria is more necessary than ever. » Because data for endemic diseases such as malaria are not analysed by humans on daily basis, automated methods can help to provide proactive decision support. » We have developed a tool to help identify appropriate anomaly thresholds for health regions: https://github.com/KingPeter2014/Anomaly_in_malaria_surveillance_data Summary
  • 18.
    » T. Hagemannand K. Katsarou. A Systematic Review on Anomaly Detection for Cloud Computing Environments.2020. doi: https://doi.org/10.1145/3442536.3442550 » Understanding LSTMs. https://colah.github.io/posts/2015-08-Understanding-LSTMs/ » B. Agrawal, T. Wiktorski & C. Rong. Adaptive Real-Time Anomaly Detection in Cloud Infrastructures. 2018 1st International Conference on Data Intelligence and Security (ICDIS). » J. Clark, Z. Liu and N. Japkowicz, "Adaptive Threshold for Outlier Detection on Data Streams," 2018 IEEE 5th International Conference on Data Science and Advanced Analytics (DSAA), 2018, pp. 41-49, doi: 10.1109/DSAA.2018.00014. » S.J Taylor and B. Letham . Forecasting at Scale. https://peerj.com/preprints/3190.pdf , 2017. » SIVEP-Malaria database. IntegratedDataset.csv: Derived from Brazilian epidemiological surveillance system of malaria (2020). https://www.synapse.org/##!Synapse:syn21555933. References

Editor's Notes

  • #2 The complexity of both natural and technological systems has reduced the ability of humans to monitor, detect and fix anomalies before they occur and in real-time. In this talk, I examine types of anomalies and the different machine learning methods that can be applied to detect the anomalies in time series signals. Further, I present results in detecting anomaly in epidemiological data with noise and uncertainties. I then extend the discussions of the methods and results to performance and security anomaly detection in cloud computing environments. I conclude that despite the source of a signal that is being analysed for anomaly detection, the concept of outliers, weak signals and noisy signal processing can be combined with different model ensembles to achieve timely and robust detection of abnormal signal changes just before they occur.
  • #3 https://sph.umich.edu/pursuit/2021posts/risk-of-neglecting-malaria-in-the-age-of-covid.html https://www.weforum.org/agenda/2020/04/malaria-treatment-rise-africa-coronavirus/ How to trade-off between false alarms (alarm fatigue) and late detection of case flare-ups. Pandemics exacerbate the problem: Malaria, Measles and Polio vaccine programs are being postponed. A unique interplay of the biological, environmental and social factors that allow malaria to flourish in the poorest countries in the world
  • #4 How to trade-off between false alarms (alarm fatigue) and late detection of case flare-ups.
  • #12 LOESS (locally estimated scatterplot smoothing) and LOWESS (locally weighted scatterplot smoothing)
  • #13 LOESS (locally estimated scatterplot smoothing) and LOWESS (locally weighted scatterplot smoothing)
  • #15 Gradual increase , in case numbers may creep into undetected large outbreaks as the data distribution within the sliding window could remain constant. The drift problem can still occur irrespective of the value of uncertainty thresholds.