1. www.citycraftventures.com
August 2013 - Initial assessment and analysis for City of
Reading to identify network of cross sector organizations and
individuals necessary to implement long term city revitalization
strategy. Provided preliminary road map and recommendations
for planning and implementation needs.
CityCraft conducted sessions with representatives from
developers, development agencies, community leaders, labor
leaders, religious leaders, local foundations, non-profits, city
leadership and others.
For many years, Reading had been a shadow of its former,
industrious self, but its economic and social systems
deteriorated rapidly. In 2012, the New York Times called
Reading “the nation’s poorest city”. The struggling city earned
the unwelcome distinction by having the largest share of its
residents living in poverty for U.S. cities with populations over
65,000. Recent attempts at revitalization proved unsuccessful
as 1,000,000 sf of downtown office space remained vacant and
tens of millions of dollars in public subsidies were expended
with very little overall impact for the city.
Challenges included addressing needs of education, jobs,
and attracting investment to the area. The Mayor’s leadership
inspired a vision for “shared prosperity among all who live,
work, learn, and visit here through a thriving local economy,
broad cultural diversity, and a healthy natural environment.”
The Mayor’s Five Goals for the City included:
• Safer and Cleaner Neighborhoods
• Economic Development and Job Creation
• Sound Fiscal Management
• Open and Transparent Government
• High Quality of Life
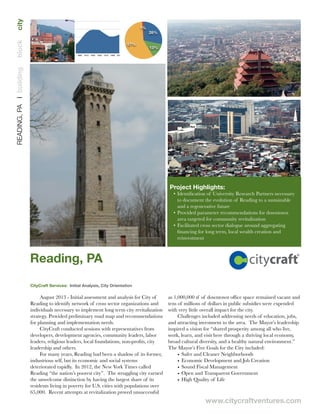
Reading, PA
Project Highlights:
• Identification of University Research Partners necessary
to document the evolution of Reading to a sustainable
and a regenerative future
• Provided parameter recommendations for downtown
area targeted for community revitalization
• Facilitated cross sector dialogue around aggregating
financing for long term, local wealth creation and
reinvestment
READING,PA❘buildingblockcity
CityCraft Services: Initial Analysis, City Orientation
1%
57%
13%
28%
0
37500
75000
112500
150000
1790 1810 1830 1850 1870 1890 1910 1930 1950 1970 1990 2010