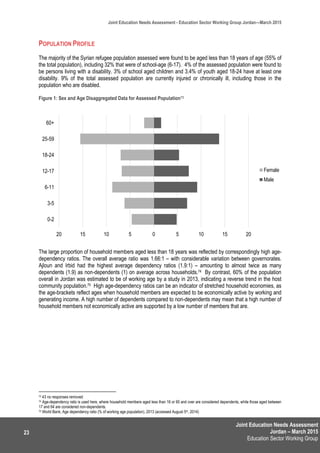
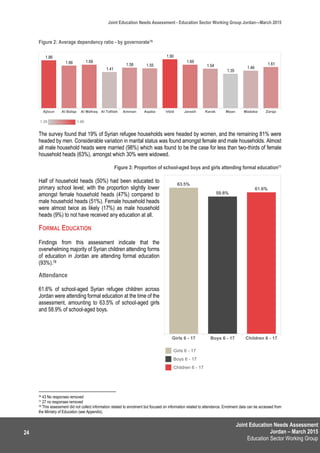
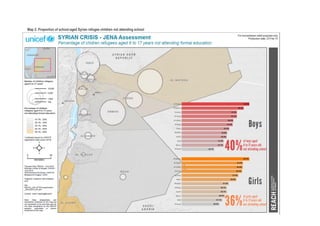
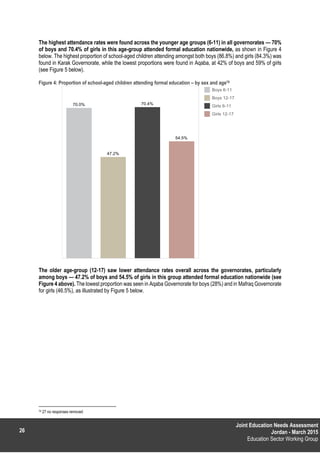
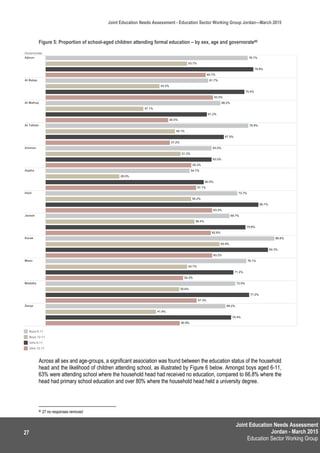
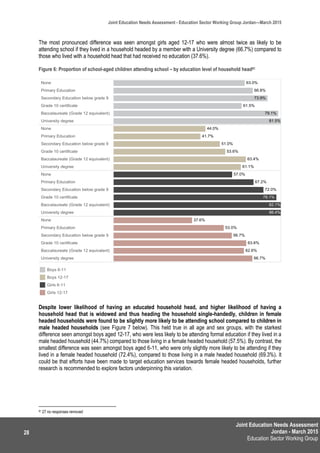
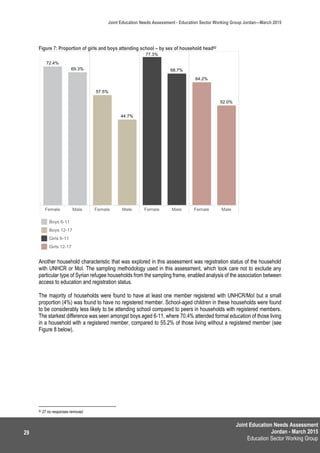
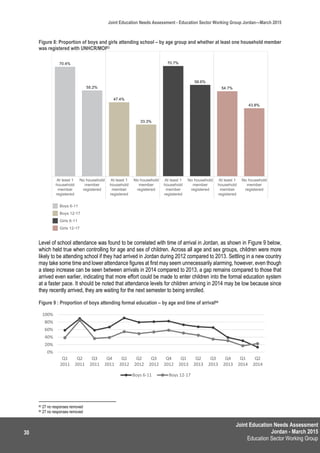
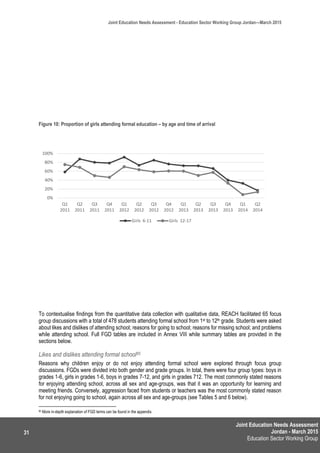
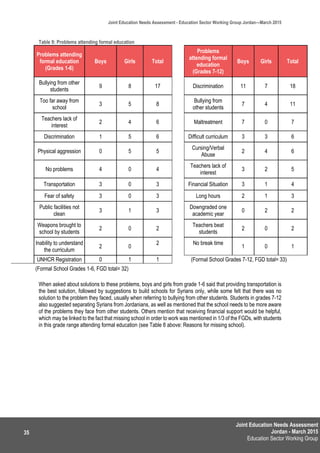
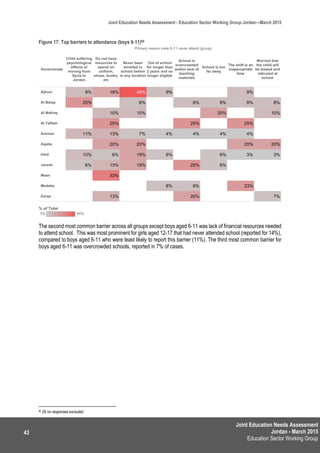
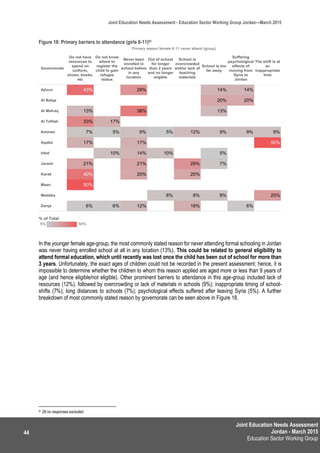
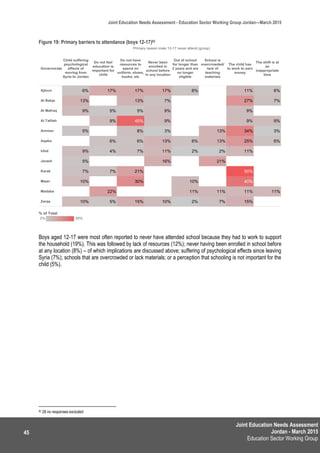
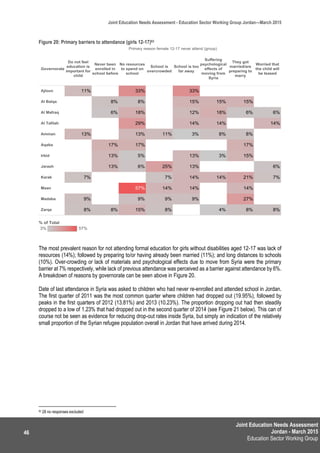
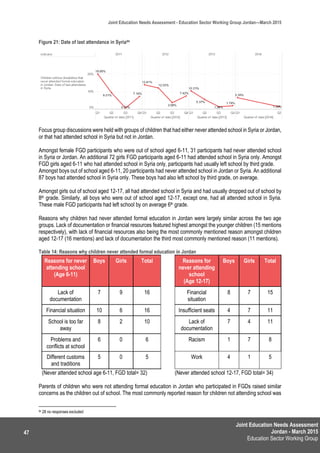
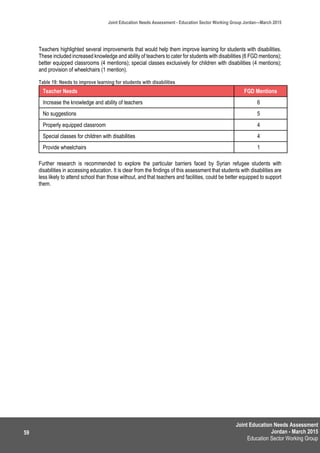
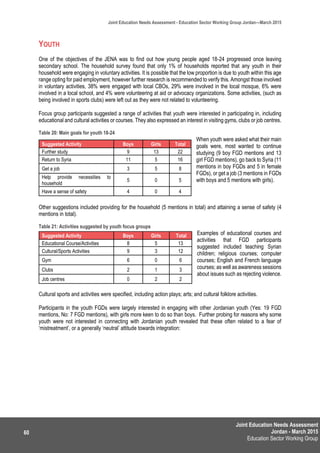
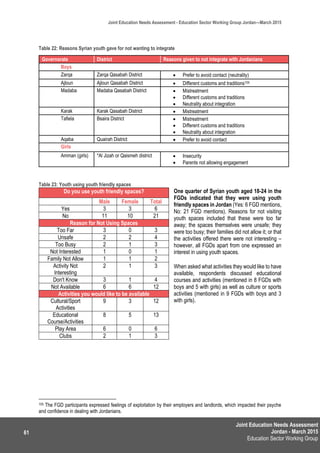
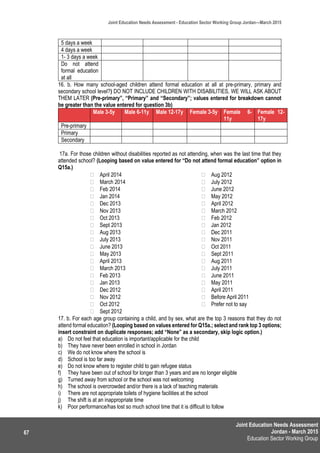
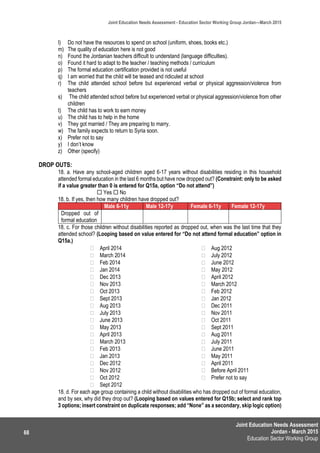
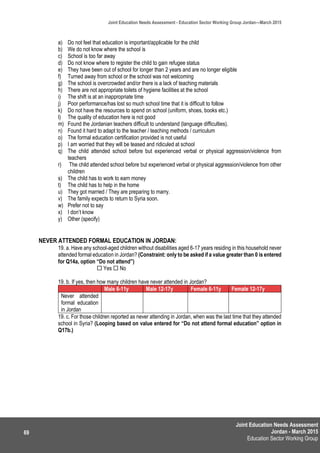
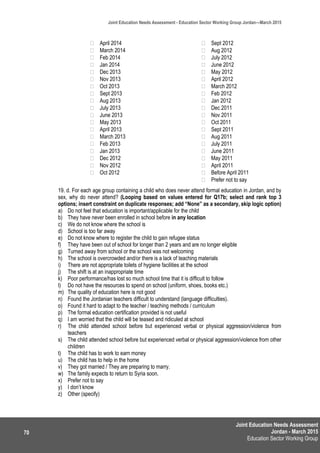
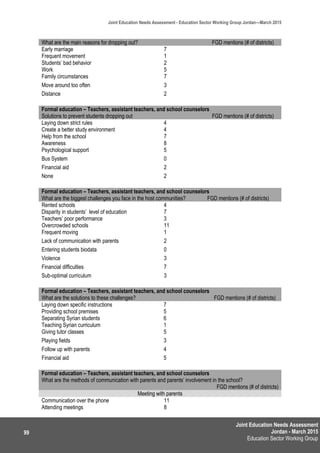
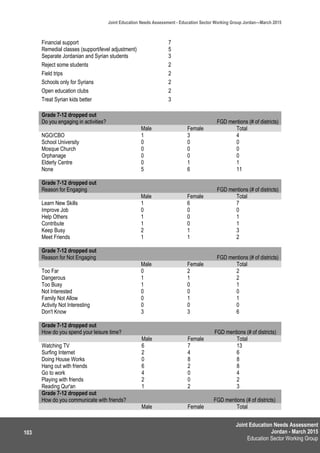
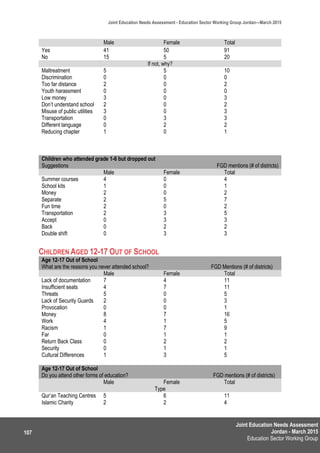
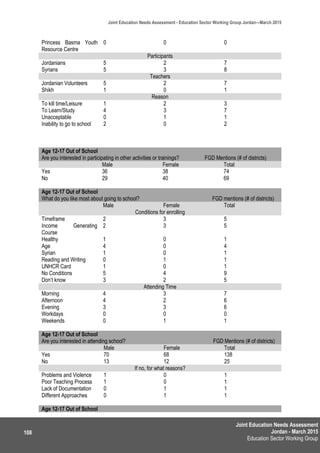
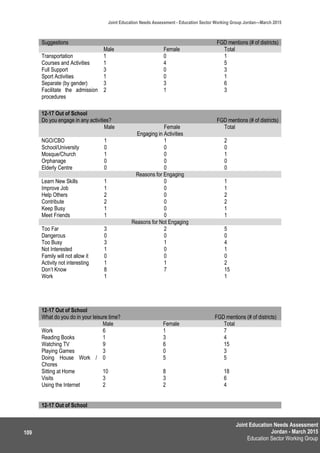
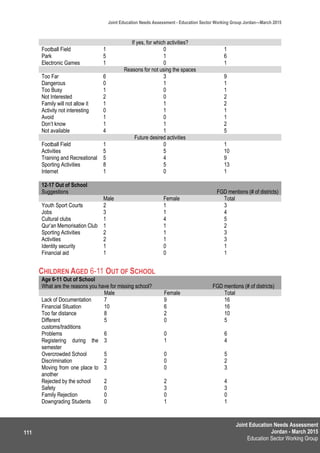
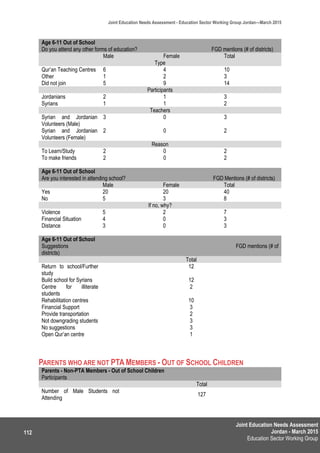
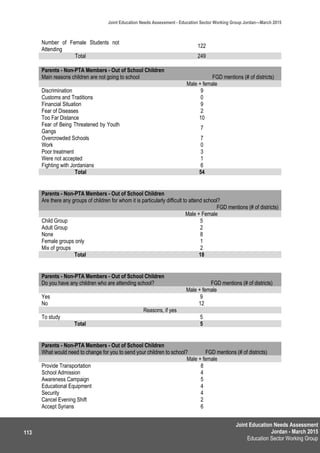
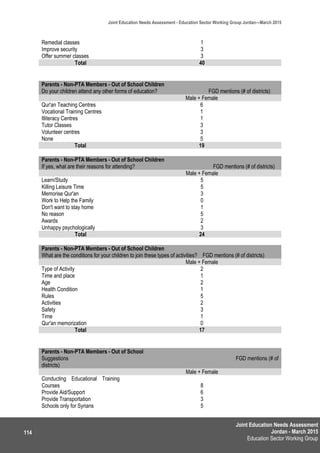
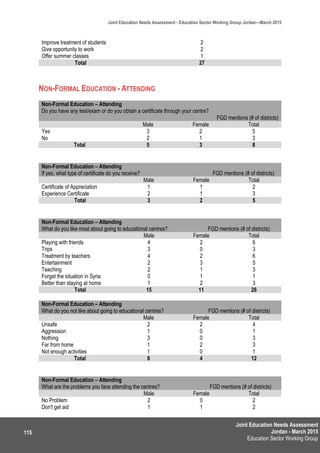
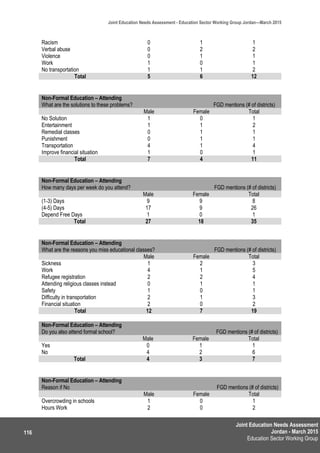
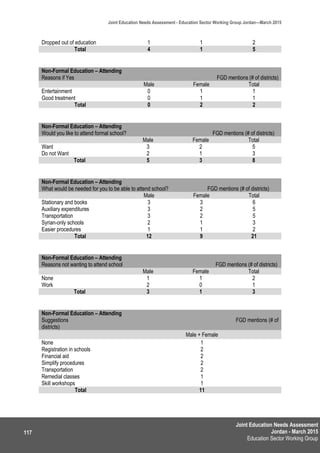
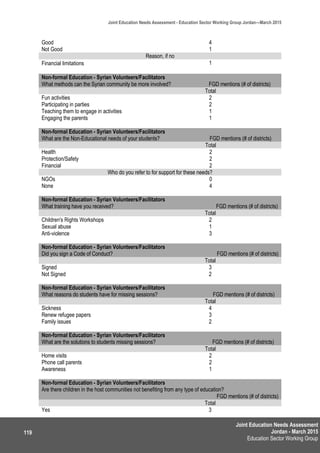
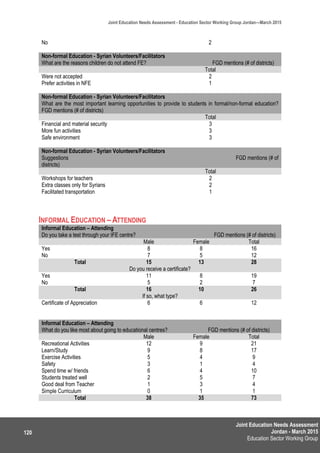
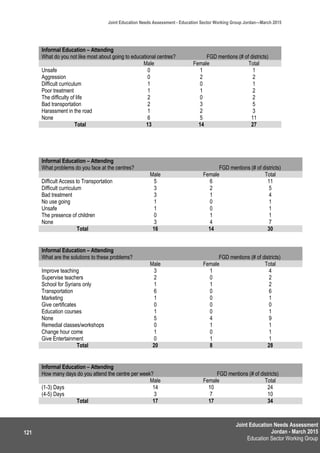
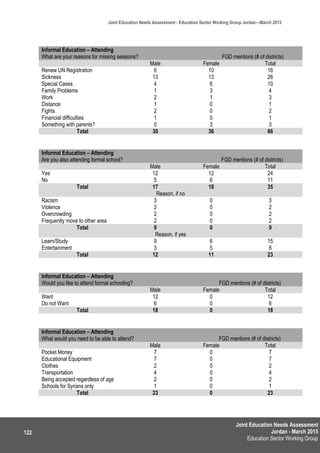
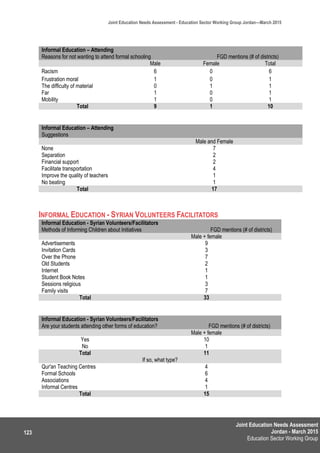
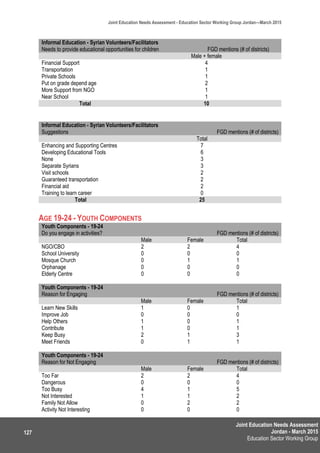
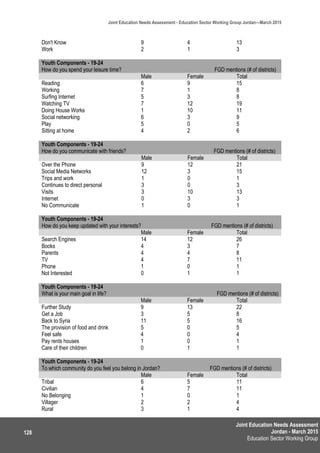
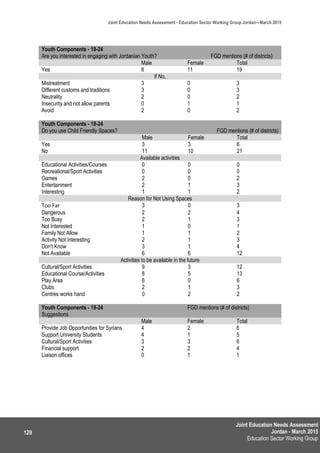
More than half of surveyed Syrian refugee households in Jordan had members under 18 years old. Around 61.6% of school-aged Syrian refugee children were attending formal education in Jordan, with attendance rates highest for younger children aged 6-11. Barriers to attendance included lack of resources to pay for schooling, needing to work, and lack of documentation. Non-formal and informal education programs were positively viewed but faced challenges like safety issues and lack of transportation. Only 46% of children with disabilities attended formal school, with physical accessibility being a key barrier. The assessment recommends improving awareness of education options, increasing accessibility, and addressing safety concerns to boost Syrian refugee children's access to education in Jordan.
This document summarizes key findings from a baseline study conducted by GAGE and UNICEF Jordan on adolescent capabilities and the impacts of UNICEF's Makani program. Some key points:
- Adolescents in Jordan have high educational aspirations but access to schooling varies significantly based on factors like gender, location, and disability status. Educational quality is generally poor.
- Boys face greater disadvantages like missing more school days and facing more corporal punishment.
- The Makani program aims to improve access to education, learning outcomes, and leadership skills. Preliminary findings show Makani is associated with higher school enrollment rates, improved math skills, and more adolescents taking on leadership roles.
- Further scaling
The document provides an overview of findings from the Gender and Adolescence: Global Evidence (GAGE) baseline study in Jordan. Some key findings include:
- Participation in formal education is lower for older adolescents, especially Syrian refugees. Gender disparities favor girls' enrollment.
- Learning outcomes are below grade level, with older adolescents and boys performing worse. Refugees have fewer years of schooling.
- Access to vocational training is limited, especially for refugees. Such programs are seen as valuable but poorly targeted.
- Most adolescents can access basic health services, but transportation barriers, discrimination, and costs pose challenges. Specialized care is difficult to access.
International Journal of Humanities and Social Science Invention (IJHSSI)inventionjournals
International Journal of Humanities and Social Science Invention (IJHSSI) is an international journal intended for professionals and researchers in all fields of Humanities and Social Science. IJHSSI publishes research articles and reviews within the whole field Humanities and Social Science, new teaching methods, assessment, validation and the impact of new technologies and it will continue to provide information on the latest trends and developments in this ever-expanding subject. The publications of papers are selected through double peer reviewed to ensure originality, relevance, and readability. The articles published in our journal can be accessed online
Assessment of Premarital Sexual Practices and Associated Factors among Privat...AI Publications
Background Sexual activity among adolescent has been reported to be on the increasing worldwide. Globally, puberty is occurring earlier for both boys and girls, and the age at which people marry is rising. These leave a widening gap of time during which young adults can potentially engaged in premarital sexual activity. Therefore this study was done to assess pre-marital sexual practices and associated factors among private college students in Bahir Dar city, Northwest Ethiopia.
Method: An institution based cross-sectional study was employed in private college, Bahr Dar, North west Amhara, Ethiopia from July to December 2016. The sample size to each college was allocated using probability proportional to size (number of student) allocation, and study participants were selected by systematic sampling technique. A total of 402 students were included in the study. Pre-testing of the questionnaire was undertaken. Data was collected using a pre-tested structured questionnaire through self administration. Data entry and analyses were performed using SPSS statistical packages (version 20 for Windows). Bivariate and Multivariable analysis were computed.
Result: : A total of 344 students took part in the survey. More than one fifth of survey respondents (23.3%) reported that they have had premarital sex. Multi--‐variate logistic regression analysis showed that male respondents were two times more likely to be have premarital sexual intercourse as compared to female respondents (AOR: 2.3,95% CI:1.4-4.1). Students who watch video, movies or other entertainment programs were more than five times more likely to start pre-marital sexual debut than those not watching video, movies or other entertainment programs (AOR: 5.5, 95%CI: 2.7-11.2).similarly work to earn money was found to be positively associated with premarital sex in this study (AOR: 3.2, 95% CI:1.8-5.7).
Conclusion and recommendation: A significant number of students had started pre marital sexual activity that might predispose them to varied sexual and reproductive health problems. Hence, sex education & targeted behavioural change interventions are recommended.
The Perception of Stakeholders’ on Academic Performance of Junior high Schoo...AI Publications
The study investigated stakeholders’ perception and academic performance of students in Junior High Schools (JHS), with hard evidence from the Choggu Circuit in the Sanarigu District. Simple stratified, proportional random sampling was used to select a sample size of 191, representing 20 percent of the total population of 36 teachers and the entire seven member School Management Committee (SMC) and Parent Teachers Association (PTA) executives of the schools involved. Questionnaire and interview schedule were the main instruments used to elicit responses. Data analysis and interpretation indicated that academic performance of JHS is perceived by stakeholders to be hampered by quality teacher delivery and inadequate / unavailability of educational resources. In the light of these findings, suggestions for improvement in the quality of teaching and learning were made.
This document discusses issues facing adolescents and young people in developing countries across several areas:
1) Employment and health challenges like malnutrition, mental illness, violence and HIV prevalence are high among youth.
2) Access to quality education remains a challenge, especially for girls and marginalized groups in parts of Africa, Middle East, and Eastern Europe.
3) Access to sexual and reproductive health information and services is limited. Comprehensive sexuality education is not widely available, and contraceptive use and access to safe abortion is low for adolescents. Adolescent birth rates are highest in Africa and parts of Asia.
This document provides an outline and overview of the Gender and Adolescence: Global Evidence (GAGE) baseline findings in Jordan. Some key points:
- GAGE is a longitudinal research program studying adolescents in low and middle-income countries to understand their transitions and evaluate programming. In Jordan, it surveyed 4,000 10-17 year olds.
- The baseline findings show educational aspirations are high but financial constraints, lack of opportunities, and gender norms truncate many aspirations. Participation declines with age, and is lower for refugees.
- Disparities exist between Syrians, Palestinians, and Jordanians in access, participation, and educational attainment, partly driven by displacement status. Older Syrian adolescents
- Child marriage is common in South Asia, Africa, and Latin America, with high rates in Nepal. It occurs most in poor, marginalized communities.
- The main causes of child marriage are poverty, the need to reinforce social ties, and the belief it offers protection. It results in girls dropping out of school and takes a toll on their health.
- The consequences of child marriage include negative health impacts on girls like increased risk of sexually transmitted infections, cervical cancer, and maternal and child mortality. It also results in isolation, depression, and domestic violence for the girls.
Including all children in quality learning - The call to action ‘Education Equity Now!’ supported by the Government of Turkey and UNICEF, will call on 20 governments in Central and Eastern Europe and Central Asia to put education reform measures in place so that all children, particularly the most vulnerable and excluded, are reached.
Impact of mother’s education on family sizeMahmood Sambou
The document discusses the relationship between education levels and family size. It finds:
- Women with no/little education generally married younger (average age 17-18) and had more children (average 5-6) compared to more educated women.
- Higher levels of education, especially secondary education or above, were associated with older average ages of first marriage (21-23 years old) and fewer children (average 3-4).
- Minimum periods of schooling, such as 4-6 years, were required before education began impacting fertility levels and reproductive behaviors.
- Religious education alone did not reduce fertility in the same way as formal education. Overall, increased education was strongly correlated with
Understanding adolescent vulnerabilities in LMICs through an intersectional lens: launch of a new European Journal of Development Research Special Issue
Background and objectives
This event will showcase a new EJDR special issue that explores adolescent experiences across diverse LMICs, including conflict-affected contexts, drawing on unique mixed-methods data from the GAGE longitudinal study. It will highlight why an intersectional approach is critical to capture adolescents’ diverse and dynamic capabilities, and what the policy and programming implications are to ensure no adolescent is left behind.
Achieving gender parity in enrollment through capitation grant and school fee...Alexander Decker
The document discusses strategies used by the Ghanaian government to improve enrollment and attendance in basic schools, including the Capitation Grant and School Feeding Programme. It analyzes whether these programs have addressed disparities in enrollment and attendance between rural boys and girls in the Northern Region of Ghana. The study found that while overall enrollment has increased for both sexes, girls' enrollment exceeds boys' and boys' attendance rates are higher than girls'. It concludes that achieving parity in enrollment and attendance through these programs alone is a myth rather than a reality due to challenges in rural communities.
Global Initiative on Out-of-School Children - South AsiaUNICEF Education
17 million primary school-age children who are not in school in Bangladesh, India, Pakistan and Sri Lanka. Another 9.9 million lower secondary school-age children are also not attending school bringing the total to 27 million. This study provides insight into the profiles of these out-of-school children, which is crucial for making informed policies and decisions to reach these excluded children.
Executive Summary: Global Initiative on Out-of-School Children in South AsiaUNICEF Education
EXECUTIVE SUMMARY: 17 million primary school-age children who are not in school in Bangladesh, India, Pakistan and Sri Lanka. Another 9.9 million lower secondary school-age children are also not attending school bringing the total to 27 million. This study provides insight into the profiles of these out-of-school children, which is crucial for making informed policies and decisions to reach these excluded children.
An Essential Package of School-Based Interventions
`
For more information, Please see websites below:
`
Organic Edible Schoolyards & Gardening with Children
http://scribd.com/doc/239851214
`
Double Food Production from your School Garden with Organic Tech
http://scribd.com/doc/239851079
`
Free School Gardening Art Posters
http://scribd.com/doc/239851159`
`
Companion Planting Increases Food Production from School Gardens
http://scribd.com/doc/239851159
`
Healthy Foods Dramatically Improves Student Academic Success
http://scribd.com/doc/239851348
`
City Chickens for your Organic School Garden
http://scribd.com/doc/239850440
`
Simple Square Foot Gardening for Schools - Teacher Guide
http://scribd.com/doc/239851110
This fact sheet provides data and analysis on adolescent and young people's sexual and reproductive health and rights in Sub-Saharan Africa. It finds that while the region is growing economically, socioeconomic and health indicators for youth have not improved. Access to education is limited with high dropout rates, especially for girls. Contraceptive use is low among married adolescents. Adolescent fertility and pregnancy rates are highest in the region. Access to comprehensive sexuality education and abortion services is limited due to legal restrictions and social norms. HIV prevalence is disproportionately high among young women. Harmful traditional practices like female genital mutilation also negatively impact girls' health and rights.
UNESCO has six main goals for world education by 2015: 1) expanding early childhood education, 2) ensuring free primary education, 3) meeting the learning needs of youth and adults, 4) achieving a 50% improvement in adult literacy, 5) eliminating gender disparities, and 6) improving education quality. Progress has been made in many areas but challenges remain, especially in improving early childhood programs, youth/adult education, adult literacy, and achieving gender parity at all levels. Quality also remains low in some regions.
Promoting affirmative action in higher education a case study of the universi...Alexander Decker
The document summarizes a case study on the University for Development Studies' Bridging Programme for girls in Ghana, which aims to promote gender equity in higher education. Some key points:
1) Before the program, there was a large gender gap in university enrollment favoring males; after the program was implemented, the gender gap was reduced.
2) The program provides admissions to female students from poorer backgrounds and rural areas who have weaker academic qualifications than normal admissions requirements.
3) Once enrolled through the program, the female students were able to compete favorably with students admitted through the normal process.
4) The program has helped increase female representation in university enrollment, but support from local governments could help sponsor
The document discusses factors that influence female education in Ghana from basic to tertiary levels. It identifies key challenges such as poverty, adolescent pregnancy, sexual harassment, and balancing family/work responsibilities. Educating females contributes to improved individual and societal outcomes including health, empowerment, and national development. While interventions have aimed to improve female enrolment, disparities with males remain. Flexible policies and community support are recommended to further enhance female education.
Adult learners dropout from literacy programmes in gombe state, nigeriaAlexander Decker
The document discusses adult learner dropout from literacy programs in Gombe State, Nigeria. It notes that while literacy programs see high initial enrollment, completion rates are often disappointing due to dropout. The study examines causes of dropout in Gombe State's literacy programs in 2011. Through a survey of 542 past learners, it finds that gender roles and instructor incompetence were key reasons for dropout. It also identifies inadequate instructional materials and quality as additional factors. The document recommends building more literacy centers, equipping them properly, and establishing more female-centered programs to address dropout issues.
The document provides an overview of menstrual health challenges facing girls in Kenya. It finds that 65% of women and girls cannot afford sanitary pads, just 32% of rural schools have private places for girls to change, and 2 out of 3 pad users receive them from sexual partners. However, evidence directly linking poor menstrual health to outcomes is limited. While programs aim to improve education, research found pads did not reduce absenteeism. More research is needed to understand the impacts of menstrual health programs on empowerment and life outcomes for girls in Kenya.
Global Initiative on Out-of-school children: Central and Eastern Europe/ CISUNICEF Education
Despite high enrollment rates, many children in the region of Central and Eastern Europe and the Commonwealth of Independent States (CEE/CIS), drop out of school early and many graduate without learning basic literacy and numeracy skills. According to the latest study published by the Out of School Children Initiative, 2.5 million children of basic school age and 1.6 million children of pre-primary school age are out of school in the region. Additionally, many more children from the most marginalized communities are excluded from national data collection procedures and thus are invisible.
Being socially responsible means that people & organization must behave ethically & with sensitivity towards social, cultural, economic and environmental issues which will create a positive impact on development, business, and society.
State of the Ugandan Child Data Presentation_20150909USAIDPCM
- The document provides statistics on the population, social protection, health, education, and status of children in Uganda. It notes that 20% of the population is under 5, primary enrollment is 95.5%, and only 12% complete secondary school. Budgets for social protection, health, and education have been declining as a percentage of the national budget.
- Rates of child poverty, mortality, stunting, sexual abuse in schools, HIV prevalence, and teenage pregnancy are high. Factors negatively impacting girls include sexual violence, domestic responsibilities, and high vulnerability rates.
- The national child forum aims to improve well-being in education, health and social protection through an action plan and regional events. Target
A presentation by Dr Nicola Jones, Expert Workshop organised by UNU-Merit.
https://www.gage.odi.org/event/social-protection-in-the-context-of-forced-displacement-programming-promoting-young-peoples-resilience-in-general-and-during-covid-19/?fbclid=IwAR1krlZWPD992qz1brdyKOK0-CskvbYxXaYdbAF5dG805xdw077RI6BYKuI
A presentation by Sarah Baird to 'RECOVR Webinar Series, Covid-19 and Forced Displacement in the Global South, The Syrian Refugee Crisis: a View from Jordan', Innovations for Poverty Action, December 2020
This document summarizes research on youth economic security, skills, and empowerment among displaced youth in Jordan. It finds that while youth aspirations are high, their access to education, skills training, work, and social protection is limited due to poverty, gender norms, conflict, and discrimination. However, some youth are able to overcome obstacles through individual commitment, family support, inspiring teachers, and empowerment programs. Such programs provide new skills, role models, mindsets, and social networks that transform outcomes, especially for girls. Ongoing challenges include lack of funding, discrimination, and restrictive gender norms. The research implications call for supporting education, skills training, livelihoods programs, and changing social norms.
a study on cause of primary school dropouts by Peer zada Aneespeer zada Anees
This document discusses a study on the causes of primary school dropouts in Karnataka, India. It provides background on efforts to expand primary education access over the past few decades but notes that dropout rates remain high. The study found that the highest dropout rates in Karnataka are in Gulbarga district, followed by Belgaum. Migration is a major reason for children dropping out. Girls have higher dropout rates than boys. The document also reviews national trends, finding that over 40% of students drop out between classes 1-5, with economic factors and lack of interest being top reasons.
Prevalence of malnutrition among under five children of RukaminiNagar, BelgaumSawan Kumar
synopsis of prevalence of malnutrition among under five years children in Rukmini Nagar, Belgaum
Reaserche:- Mr. Sawan Kumar Yadav
Guide:- Dr. Mubashir Angolkar,
Coordinator and Assistant Professor
Department of Public Health,
J.N. Medical college, Belgaum, Karnataka, India
Determinants of Adolescent Fertility in GhanaSamuel Nyarko
1) The study examined determinants of adolescent fertility in Ghana using data from the 2008 Ghana Demographic and Health Survey.
2) Binary logistic regression revealed that adolescent fertility was significantly influenced by the level of education of the female adolescent and her partner, the work status of the female adolescent, and the wealth status.
3) Adolescents with higher education and partners with higher education were less likely to have given birth, while adolescents not working and from poorer households were more likely to have given birth.
Determinants of adolescent fertility in GhanaSamuel Nyarko
1. The study examined determinants of adolescent fertility in Ghana using data from the 2008 Ghana Demographic and Health Survey.
2. Binary logistic regression revealed that adolescent fertility was significantly influenced by the level of education of the female adolescent and her partner, the work status of the female adolescent, and the wealth status.
3. Adolescents with higher education levels and partners with higher education levels were less likely to have given birth, while adolescents not working and from poorer households were more likely to have given birth.
This brief outlines key findings of a study conducted in late 2016 and early 2017, though a partnership between the Bangladesh Bureau of Statistics (BBS) and Handicap International, with technical oversight from the Nossal Institute for Global Health, University of Melbourne, Australia.
Children Missing Education Protocol Nov 2015KingstonVA
The document outlines the procedures for identifying and supporting children who are missing education or at risk of missing education in Kingston and Richmond. It defines key terms and describes the national and local context. It discusses governance arrangements and the roles of various service areas, including Admissions, Education Welfare, Education Inclusion, SEND, and Youth Offending in identifying and supporting these children. Key principles are established, such as maintaining a register of children missing education and ensuring a minimum of 25 hours of suitable education for all children.
The document summarizes key findings from a study on education access and learning outcomes for adolescents in Jordan. It finds that while educational aspirations are generally high, realities often differ. School enrollment varies significantly based on factors like age, gender, nationality and location. Barriers to education include a lack of schools initially for refugees, child marriage for girls, demands for boys' labor, and lack of transportation. Daily attendance and educational quality are also poor. Parents generally support education but have limited ability to provide practical guidance.
Gender parity in education means that equal proportions of girls and boys enter and complete schooling. However, large gender gaps still exist globally with fewer girls than boys receiving education in many areas. Achieving gender parity is an important goal but by itself does not ensure equality, as other issues like poverty, violence, and social attitudes also impact education outcomes. Recent data shows that in some countries like the Philippines, girls now outperform boys in educational indicators, highlighting the need to address challenges facing boys' education as well. International agreements like the SDGs and EFA movement aim to promote inclusive, quality education for all as a way to achieve greater gender equality.
Concept note community capacity buildingGharib Hamad
The document discusses strengthening community child protection systems in Zanzibar to address violence against children and gender-based violence. It notes that the Zanzibar Violence against Children Study found high rates of sexual violence against children and low rates of support services utilization. It proposes building the capacity of community structures and the formal child protection system to prevent and respond to abuse cases through activities like training, advocacy, and developing intervention programs. The overall goal is to reduce child abuse in the community by improving protection mechanisms at both the community and government levels.
Young women in South Africa are disproportionately affected by HIV/AIDS, with infection rates four times higher than young men. Researchers conducted a study examining how poverty, orphanhood, and social isolation relate to risky sexual behaviors. They developed a pilot intervention program to enhance life options for at-risk youth through safe social spaces, financial literacy training, and HIV/AIDS education. Preliminary findings show the intervention was associated with improved knowledge, attitudes, and behaviors regarding self-esteem, finances, and HIV prevention among participants.
National Forum on the State of the Ugandan ChildUSAIDPCM
- 20% of Ugandan females and 13% of males over age 6 have never had formal education, and only 12% complete secondary school. Child vulnerability rates are high.
- Health indicators show high rates of stunting, HIV, and adolescent pregnancy. The education system struggles with low literacy and high dropout rates.
- The Uganda Child Forum is a national movement to improve child wellbeing through coordinated action on education, health, and social protection, guided by data and aimed at reducing vulnerabilities, violence, and improving outcomes for girls. Illustrative targets include reducing stunting and teenage pregnancy by specific percentages by 2017.
The document summarizes key findings from a pilot study conducted by the Gender and Adolescence: Global Evidence (GAGE) program in Rwanda. GAGE conducted surveys and interviews with over 200 adolescents and caregivers to examine issues related to education, economic empowerment, health, violence, and empowerment. Key findings include the financial barriers to schooling, limited knowledge around contraception, high rates of violence in schools and homes, and the promise of programs like 12+ in developing skills and empowering adolescents. Going forward, GAGE plans to partner with Investing in Adolescent Girls Rwanda and continue longitudinal research to evaluate programs supporting adolescents.
The Chambersburg Area School District seeks funding for an after-school and summer program to support at-risk students. Four elementary schools have high percentages of students below the poverty line and not meeting state standards in math and reading. Survey data also shows many students engage in risky behaviors like fighting, drinking, and skipping school. The proposed program would provide academic support, youth activities, and family programming in the afternoons and summer to improve student achievement and reduce risky behaviors through collaboration between the school, students, parents, and community organizations.
Bantwana Child Profiling Report SZ FINAL Aug 2010Mavis Vilane
This document is a child profiling report prepared by Ivelina Borisova and Mavis Vilane in September 2009. It summarizes the results of a survey of vulnerable children in South Africa. The survey looked at children's demographic information, basic needs, health, psychosocial well-being, education, risks, and relationship to caregivers. Key findings included issues with food security, healthcare access, and psychosocial well-being for many children. The report provides detailed data on children's challenges and needs to help organizations better assist vulnerable youth.
1. ACCESS TO EDUCATION FOR SYRIAN REFUGEE
CHILDREN AND YOUTH IN JORDAN HOST COMMUNITIES
JOINT EDUCATION NEEDS ASSESSMENT REPORT
EDUCATION SECTOR WORKING GROUP
MARCH 2015
2. Joint Education Needs Assessment
Jordan - March 2015
Education Sector Working Group
Joint Education Needs Assessment - Education Sector Working Group Jordan—March 2015
2
SUMMARY
More than three years on from the start of the crisis, Syrian refugees continue to flee their homes and seek safety
in neighbouring countries. UNHCR Jordan had registered 605,719 Syrian refugees in Jordan at the time of data
collection for this report,1 with approximately 80% of the population residing in host communities according to
estimations from the sixth Syria Regional Response Plan (RRP6). While pre-conflict figures once put Syrian child
enrolment in formal school at over 95%2, strong evidence suggest that this proportion was reduced drastically due
to the conflict.
While the Jordanian government has taken considerable measures to accommodate the Syrian refugee influx, it
has become clear to key stakeholders that Syrian refugee children are experiencing many barriers in accessing
education, which are not fully understood. To address this gap in information, the Education Sector Working Group
(ESWG) initiated a joint education needs assessment (JENA), with funding from UNICEF and technical support
from REACH — the first to be undertaken in the Jordanian host community since the beginning of the Syrian crisis.
The Education Sector Working Group (ESWG) in Jordan is a coordination forum in which all relevant stakeholders
collaborate to support the public education system in current and future emergencies. The main priority of the
group is to plan and implement a response strategy which ensures continued access to quality public education,
in a safe and protective environment, for all vulnerable children.
This nationwide3 assessment was designed by the ESWG, in close collaboration with the Ministry of Education
JENA taskforce and the REACH/ACTED team to identify immediate priorities, challenges, needs and mitigation
measures, with a particular focus on capacities and needs of Syrian refugee children aged 6-174, as well as
exploring issues facing youth aged 18 to 24. A nationwide household survey was conducted to achieve a
statistically significant sample of Syrian refugee households. In addition, 24 categories of key community
stakeholder populations were identified and interviewed through focus group discussions (FGDs).
KEY FINDINGS
Formal education and population profile
More than half of household members were aged less than 18 years (55%), which was reflected by a
correspondingly high age-dependency ratio — with on average 1.66 dependents for every non-
dependent.
19% of households were headed by women, who were almost twice as likely (17%) as male household
heads (9%) to not have received any education at all.
61.6% of school-aged Syrian refugee children across Jordan were attending formal education, amounting
to 63.5% of school-aged girls and 59.8% of school-aged boys.5
The highest attendance rates were found across the younger age groups (6-11) in all governorates —
70% of boys and 70.4% of girls, compared to 47.2% of boys and 54.5% of girls aged 12-17.
Both boys and girls had the highest attendance rates in Karak governorate (86.8% of boys aged 6-11,
84.3% of girls aged 6-11, and 65.9% of boys aged 12-17) except for girls aged 12-17 who had the highest
attendance rates in Balqa governorate (63.5%).
Both boys and girls had the lowest attendance rates in Aqaba governorate (54.7% of boys aged 6-11,
60% of girls aged 6-11, and 28% of boys aged 12-17) except for girls aged 12-17 who had the lowest
attendance rates in Mafraq governorate (46.5%).
The three most common reasons why children were not attending school were: never having attended
school (which could render older children ineligible for formal schooling); not having resources to pay for
1 UNHCR Syria Regional Refugee Response Information Sharing Portal: http://data.unhcr.org/syrianrefugees/regional.php (accessed 9th July 2014).
2 Ministry of Planning (MoP) and International Cooperation, Jordan, Needs Assessment Review of the Impact of the Syrian Crisis on Jordan, 2013.
3 A full sample could not be achieved in Ma’an governorate due to insecurity which limited access for data collection teams.
4 Unless otherwise specified, all ages throughout this study are reported in completed years, i.e. a child aged 6 years and 11 months would here be counted
as 6 years of age.
5 Attendance rates were calculated from the questionnaire, question 16b: “How many school-aged children attend formal education at all at pre-primary,
primary and secondary school level?” Answers were recorded into gender and age groups.
3. Joint Education Needs Assessment
Jordan - March 2015
Education Sector Working Group
Joint Education Needs Assessment - Education Sector Working Group Jordan—March 2015
3
school materials; and having to work to earn money for the household. Lack of appropriate documentation
was also raised as a barrier during focus group discussions.
Children in female headed households were found more likely to be attending school (70.4%) compared
to children in male headed households (61%).The starkest difference was seen amongst boys aged 12-
17, where only 44.7% of those who lived in a male headed household were attending school compared
to 57.5% of those who lived in a female headed households. The smallest difference was found amongst
boys aged 6-11, where 72.4% of those living in female headed households were attending school,
compared to 69.3% of those living in a female headed household.
Across all sex and age-groups, a positive association was found between the education status of the
household head and the likelihood of children attending school.
The later households arrived in Jordan, the less likely children were to be currently attending formal
education, across all age groups.
Non-formal education6
Children spoke positively about non-formal education centres in focus group discussions. Specifically
boys highlighted how well they are treated by teachers and the flexibility of schedules while girls in
particular highlighted the wide variety of activities.
Safety is the largest concern for non-formal education students, with both boys and girls reporting facing
harassment outside the centres, usually on their way to the NFE centres
Informal education7
Most children interviewed in informal education settings reported that they attended informal education
centres to complement formal education.
Access to transportation to and from centres was the key issue raised by informal education students.
Safety concerns did not feature as strongly here, with FGD participants largely reporting that they faced
no particular safety and security issues when attending informal education.
Inclusive education – children with disabilities
3% of school-aged children sampled had at least one disability.
Less than half (46%) of children with disabilities were attending formal education, with girls aged 6-11
twice as likely to be receiving a formal education (65%) compared to boys aged 12-17 (33%).8
The most common disabilities were physical disabilities (36% of total disabilities), followed by visual
disabilities (25%) and mental disabilities (19%).
The most commonly stated reason for not attending formal education across all age-groups was that the
school was not physically accessible.
Youth
The main desires for the future expressed by youth (aged 18-24) in FGDs were to continue studying (9
mentions in boy FGDs and 13 in girl FGDs), go back to Syria (11 mentions in boy FGDs and 5 in girl
FGDs), or obtain employment (3 mentions in boy FGDs and 5 in girls ones).
Only 1% of households reported that household members aged 18-24 year were pursuing voluntary
activities, however a quarter of youth consulted directly through FGDs indicated that they were using
youth friendly spaces, and the vast majority expressed an interest in using them.9
6 Certified education services following MOE’s NFE curricula (2 year course). The eligibility of students to NFE includes those who have missed at least 1
year of school or have never been enrolled in formal education in Jordan
7 Educational activities that range from recreational activities to literacy numeracy, and life skills sessions. These educational activities are not certifiable by
the Ministry of Education and not specifically bound to certain age or target group
8 Since the sample was drawn from the overall population the number of children with disabilities is not high enough to enable generalisation of findings at
any conventionally accepted level of statistical significance.
9 See ‘key education terms’ table in the key findings section for definitions.
4. Joint Education Needs Assessment
Jordan - March 2015
Education Sector Working Group
Joint Education Needs Assessment - Education Sector Working Group Jordan—March 2015
4
KEY RECOMMENDATIONS
Key recommendations that could be drawn from these findings include:
More effort could be made to raise awareness about eligibility of students to attend formal schooling, to
avoid students staying out of school due to the mistaken perception that they are not eligible.
More effort could be made to arrange interim regulations that allow students to enter the formal schooling
system temporarily with relaxed documentation, while awaiting formal documentation.
Capacity of systems could be increased, through which families could be able to report difficulties
experienced with the enrolment process, in line with the service already provided by Save the Children
Jordan.
Further training of teachers in psychosocial support and disability issues could be provided, along the
lines of what has already been offered.
Improving accessibility in schools, such as ramps and more inclusive WASH facilities, could allow more
children with disabilities to attend school.
Awareness raising and campaigns against bullying and the creation and expansion of safe spaces for
youth — such as youth centres near school property — may help create a more welcoming school
environment.
NFE centre facilitators should be encouraged to discuss attendance issues, NFE centre activities, and
NFE centre education mission with parents — especially parents of girls — to relax fears and enhance
understanding of alternative education choices.
Syrians in Jordan are struggling with a variety of issues which create barriers to enrolment attendance and
retention. Yet Syrian children may one day be looked upon to rebuild Syria after the war, rendering their attainment
of education of crucial importance. Improving attendance rates is essential to avert a generational gap in the
education of Syrian refugees which could set the country back years in recovery efforts. It is hoped that the high
level of stakeholder input on the research design of projects will translate into high stakeholder buy-in as the
Education Sector Working Group moves from the assessment phase into phases of advocacy and programme
implementation.
5. Joint Education Needs Assessment
Jordan - March 2015
Education Sector Working Group
Joint Education Needs Assessment - Education Sector Working Group Jordan—March 2015
5
CONTENTS
Summary 2
Key Findings ...........................................................................................................................................................2
Formal education and population profile.................................................................................................................2
Non-formal education..............................................................................................................................................3
Informal education ..................................................................................................................................................3
Inclusive education – children with disabilities........................................................................................................3
Youth.......................................................................................................................................................................3
Key Recommendations...........................................................................................................................................4
Introduction 10
Secondary Data Review 11
Reasons for low formal attendance rates amongst Syrian children ......................................................................11
Children with Disabilities.......................................................................................................................................13
Education Programs in Jordan..............................................................................................................................13
Methodology 14
Sampling...............................................................................................................................................................14
Data Collection......................................................................................................................................................16
Quantitative data collection...................................................................................................................................16
Qualitative data collection.....................................................................................................................................16
Data Analysis........................................................................................................................................................18
Limitations.............................................................................................................................................................19
Findings 20
Summary of key findings.......................................................................................................................................20
Population profile ..................................................................................................................................................20
Formal education ..................................................................................................................................................20
Non-formal education............................................................................................................................................21
Informal education ................................................................................................................................................22
Inclusive Education – Children with disabilities.....................................................................................................22
Youth.....................................................................................................................................................................22
Population Profile..................................................................................................................................................23
Formal Education..................................................................................................................................................24
Attendance............................................................................................................................................................24
Community and parental participation...................................................................................................................36
CHILDREN who dropped out of school.................................................................................................................37
Out of School ........................................................................................................................................................41
Non-formal Education 49
Teachers and facilitators of non-formal education ................................................................................................50
Informal Education 51
6. Joint Education Needs Assessment
Jordan - March 2015
Education Sector Working Group
Joint Education Needs Assessment - Education Sector Working Group Jordan—March 2015
6
Facilitators of informal education ..........................................................................................................................52
Inclusive Education – Children with Disabilities 54
Youth 60
Conclusions and Recommendations 62
Annexes 64
Annex I: Quantitative Questionnaire .....................................................................................................................64
Annex II: Non-Formal Education Centres covered by this assessment ................................................................79
Annex III: Informal Education Centres covered by this assessment .....................................................................79
Annex IV: Focus group discussions – frequently occurring terms.........................................................................80
Annex V: Glossary of Terms.................................................................................................................................81
Annex VI: Total Syrian students enrolled in formal education for the year 2013 2014 (source: Ministry of Education)
..............................................................................................................................................................................82
Annex VII: Secondary Data Review – Bibliography ..............................................................................................85
Annex VIII: Focus Group Discussion Data – Summary Tables.............................................................................86
Annex IX: JENA Team Members ........................................................................................................................130
7. Joint Education Needs Assessment
Jordan - March 2015
Education Sector Working Group
Joint Education Needs Assessment - Education Sector Working Group Jordan—March 2015
7
LIST OF FIGURES, MAPS AND TABLES
Figure 1: Sex and Age Disaggregated Data for Assessed Population..................................................................23
Figure 2: Average dependency ratio - by governorate..........................................................................................24
Figure 3: Proportion of school-aged boys and girls attending formal education....................................................24
Figure 4: Proportion of school-aged children attending formal education – by sex and age.................................26
Figure 5: Proportion of school-aged children attending formal education – by sex, age and governorate............27
Figure 6: Proportion of school-aged children attending school – by education level of household head..............28
Figure 7: Proportion of girls and boys attending school – by sex of household head ...........................................29
Figure 8: Proportion of boys and girls attending school – by age group and whether at least one household member
was registered with UNHCR/MOI..........................................................................................................................30
Figure 9 : Proportion of boys attending formal education – by age and time of arrival .........................................30
Figure 10: Proportion of girls attending formal education – by age and time of arrival .........................................31
Figure 11: Why parents are involved in PTA.........................................................................................................37
Figure 12: Challenges for parent-teacher associations.........................................................................................37
Figure 13: Date of last attendance amongst children that had dropped out during the 6 months preceding the survey
..............................................................................................................................................................................38
Figure 14: Proportion of households by debt status and governorate...................................................................40
Figure 15: Proportion of school-aged boys and girls that never attended – by sex and age.................................41
Figure 16: Proportion of Syrian boys and girls who had never attended school in Jordan, aggregated by
governorate...........................................................................................................................................................42
Figure 17: Top barriers to attendance (boys 6-11)................................................................................................43
Figure 18: Primary barriers to attendance (girls 6-11)...........................................................................................44
Figure 19: Primary barriers to attendance (boys 12-17)........................................................................................45
Figure 20: Primary barriers to attendance (girls 12-17).........................................................................................46
Figure 21: Date of last attendance in Syria...........................................................................................................47
Figure 22: Reasons parents gave for their children not attending formal education .............................................48
Figure 23: Do you also attend formal school?.......................................................................................................51
Figure 24: What do you like most about going to educational centres?................................................................52
Figure 25: Proportion of children with a disability in each governorate.................................................................54
Figure 26: Disability type among school aged children with reported disabilities .................................................55
Figure 27: Disability type among school aged children with reported disabilities by gender.................................55
Figure 28: Proportion of boys and girls with a disability that were currently attending formal education...............56
Figure 29: Number of girls aged 6-11 with a disability that were not attending formal schooling – by reason for not
attending ...............................................................................................................................................................56
Figure 30: Number of boys aged 6-11 with a disability that were not attending formal schooling – by reason for not
attending ...............................................................................................................................................................57
Figure 31: Number of girls aged 12-17 with a disability that were not attending formal schooling – by reason for not
attending ...............................................................................................................................................................57
Figure 32: Number of boys aged 12-17 with a disability that were not attending formal schooling – by reason for
not attending .........................................................................................................................................................58
Figure 33: Drop-out rates - children with disability in formal education.................................................................58
Map 1: Sampling – Number of Syrian children assessed by governorate and statistical significance…………….16
Map 2: Proportion of school-aged Syrian refugee children not attending school…………………………………….25
Map 1: Sampling – Number of Syrian children assessed by governorate and statistical significance
..................................................................................................................................................................................................0
Map 2: Proportion of school-aged Syrian refugee children not attending school.....................0
Table 2: Children in sample, by age and gender...................................................................................................16
Table 1: Proposed and achieved quantitative sample size – excluding 70 cases due to errors ...........................16
Table 3: Types of focus group by number of focus group discussions achieved..................................................17
Table 4: Number of households selected for national level findings – by proportion of total refugee population..18
Table 5: Likes and dislikes of children attending formal school (grades 1-6)........................................................31
Table 6: Likes and dislikes of children attending formal school (grades 7-12)......................................................32
Table 7: Reasons for going to school....................................................................................................................32
8. Joint Education Needs Assessment
Jordan - March 2015
Education Sector Working Group
Joint Education Needs Assessment - Education Sector Working Group Jordan—March 2015
8
Table 8: Reasons for missing school ....................................................................................................................33
Table 9: Problems attending formal education......................................................................................................34
Table 10: Solutions to problems attending formal education ................................................................................35
Table 11: Reasons for dropping out of school.......................................................................................................37
Table 12: Feelings after dropping out ...................................................................................................................38
Table 13: Most common primary needs for reenrollment by governorate.............................................................39
Table 14: Reasons why children never attended formal education in Jordan.......................................................46
Table 15: Types of Informal Education .................................................................................................................50
Table 16: Reasons students choose informal education over formal education mentioned by facilitators) ..........51
Table 17: Trainings requested by informal education teachers.............................................................................52
Table 18: Formal education teachers who had at least one student with a disability in their class.......................57
Table 19: Needs to improve learning for students with disabilities........................................................................58
Table 20: Main goals for youth 18-24....................................................................................................................59
Table 21: Activities suggested by youth focus groups ..........................................................................................59
Table 22: Reasons Syrian youth gave for not wanting to integrate.......................................................................60
Table 23: Youth using youth friendly spaces ........................................................................................................60
Acknowledgement to donors
This publication has been produced with the generous contribution from the European Union and the US
Government Bureau of Population, Refugees, and Migration (PRM). The contents of this publication are the sole
responsibility of the Education Sector Working Group in Jordan and REACH/ACTED, and can in no way be taken
to reflect the views of the donor government or entities
REACH operates under ACTED in Jordan and is a joint initiative of ACTED, IMPACT Initiatives and the UN
Operational Satellite Applications Programme (UNOSAT). REACH was established by ACTED in 2010 to
strengthen evidence-based decision making by aid actors through efficient data collection, management and
analysis before, during and after an emergency. This contributes to ensuring that communities affected by
emergencies receive the support they need. All REACH activities are conducted in support of the Government of
9. Joint Education Needs Assessment
Jordan - March 2015
Education Sector Working Group
Joint Education Needs Assessment - Education Sector Working Group Jordan—March 2015
9
Jordan and UN partners, for the development of the Jordan Response Plan, and are within the framework of
interagency aid coordination mechanisms.
10. Joint Education Needs Assessment
Jordan - March 2015
Education Sector Working Group
Joint Education Needs Assessment - Education Sector Working Group Jordan—March 2015
10
GEOGRAPHICAL CLASSIFICATIONS
Governorate The highest administrative boundary below the national level. Jordan has 12 governorates.
District Governorates are divided into districts. There are 51 districts in Jordan.
Sub-district Sub-divided into sub-districts, of which there are 89 in Jordan.
LIST OF ABBREVIATIONS/ DEFINITIONS
ALP Accelerated Learning Programme
CBO Community-based Organization
CFSME Comprehensive Food Security Monitoring Exercise
ESWG Education Sector Working Group
FGD Focus Group Discussion
IFE Informal Education
INEE Inter-Agency Network for Education in Emergencies
INGO International Non-governmental Organization
JENA Joint Education Needs Assessment
JOD Jordanian Dinar
MoE Ministry of Education
NFE Non-formal Education
ODK Open Data Kit
PTA Parent Teachers’ Association
PTSD Post-traumatic Stress Disorder
QRTA Queen Rania Teacher Academy
RRP6 Regional Response Plan 6
UNESCO United Nations Educational Scientific and Cultural Organization
UNHCR United Nations High Commissioner for Refugees
UNICEF United Nations International Children’s Emergency Fund
USD United States Dollar
WFP World Food Programme
11. Joint Education Needs Assessment
Jordan - March 2015
Education Sector Working Group
Joint Education Needs Assessment - Education Sector Working Group Jordan—March 2015
11
INTRODUCTION
As of July 2014, UNHCR Jordan had registered 605,719 refugees from Syria in Jordan.10 The 2014 Syria RRP6
estimated that 80% of refugees were residing outside of camps, with the highest concentrations of refugee
populations found in northern and central Jordan.11
In March 2013, approximately 30,000 Syrian refugee children were enrolled in formal schooling across Jordan.12
The figure climbed to 83,000 in late September 2013, accounting for 44% of all Syrian children registered with
UNHCR.13 For the 2013/2014 school year, approximately 100,381 Syrian students were enrolled in formal
schooling across Jordan, according to MoE figures.14 However the present assessment has confirmed what other
studies have identified previously1516; that around a third of school-aged Syrian children are not attending formal
schooling. Key stakeholders tasked with ameliorating the issue of Syrian refugee education in Jordan include the
Government of Jordan, notably the Ministry of Education (MoE) which oversees the education system serving
Syrian refugees, in addition to members of the Education Sector Working Group (ESWG) co-chaired by UNICEF
and Save the Children. The Education Sector Working Group (ESWG) in Jordan is a coordination forum in which
all relevant stakeholders collaborate to support the public education system in current and future emergencies.
The main priority of the group is to plan and implement a response strategy which ensures continued access to
quality public education, in a safe and protective environment, for all vulnerable children. ESWG members include
UN agencies; several international and national non-governmental organizations (INGOs; NNGOs); and
Community Based Organisations (CBOs).
The ESWG initiated the present joint education needs assessment (JENA), after identifying key information gaps
across education systems accessed by the Syrian refugee population. No nationwide thematic assessment
focusing on education had been carried out in Jordan since the onset of the Syrian crisis in Jordan, although a
Joint Education Needs Assessment (JENA) was conducted in 2013 in Za’atari refugee camp. Information gaps
concerning Syrian refugee children in host communities included: estimations of current numbers of school
attendance; dropout rates; primary reasons for dropping out and not attending; and general barriers to education.
Furthermore, the JENA was tasked with clarifying refugee perceptions about education quality and with identifying
ways to strengthen community participation in education. Information was overall found to be lacking across three
overall educational contexts in Jordanian host communities – formal, informal and non-formal. In addition, key
information gaps concerning youth aged 18-24 were identified, including what voluntary, social and civic activities
Syrian youth prefer and participate in.17
This nationwide18 assessment was designed by the ESWG, in close collaboration with the Ministry of Education
JENA taskforce and the team to identify immediate priorities, challenges, needs and mitigation measures, with a
particular focus on capacities and needs of Syrian refugee children. The overall objective of the JENA in closing
the information gaps outlined above was to identify and reduce education barriers and thus facilitate Syrian children
in returning to school in Jordanian host communities. Through the JENA, the ESWG therefore aimed to identify
immediate education priorities through an analysis of the capacities and needs of Syrian refugee children aged 6–
17 and to take a first step towards identifying the specific priorities, challenges, needs, and mitigation measures
affecting young people aged 18-24.19 This assessment report will outline key findings across formal, informal, non-
formal and inclusive education contexts for Syrian refugee children in Jordan, as well as exploring topics related
to youth. The assessment consists of a quantitative household survey which is contextualised with the aid of
qualitative data collected through focus group discussions across all governorates of Jordan.
10 UNHCR Syria Regional Refugee Response Information Sharing Portal, note 1 supra
11 UNHCR, Syria Regional Response Plan – Jordan, 2014, available at: http://www.unhcr.org/syriarrp6/docs/syria-rrp6-jordan-response-plan.pdf (accessed
August 13, 2014).
12 Ibid.
13 UNHCR, note 11 supra
14 Ministry of Education, School Year 2013/2014 Enrolment of Syrian refugee children in Host Communities, Department of Planning, June 2014
15 UNICEF, Syrian Refugee Children in Jordan: Assessments Desk Review. Rep. Amman: UNICEF Jordan Country Office, 2013
16 Syria Needs Analysis Project, Jordan Baseline Information, January 2014
17 Joint Education Needs Assessment - Terms of Reference
18 A full sample could not be achieved in Ma’an governorate due to insecurity which limited access for data collection teams.
19 Joint Education Needs Assessment - Terms of Reference
12. Joint Education Needs Assessment
Jordan - March 2015
Education Sector Working Group
Joint Education Needs Assessment - Education Sector Working Group Jordan—March 2015
12
SECONDARY DATA REVIEW
Prior to the Syrian crisis, the Government of Jordan (GoJ) was investing heavily in its public school system.
Jordan’s public schools performed well compared to other middle-income countries in the MENA region –
enrolment and attendance rates in public schools exceeded 95% before the crisis.20 From the onset of the Syrian
crisis, the Jordanian government welcomed Syrian refugees into the public school system and the number of
children enrolling in Jordanian public schools swelled. Efforts made by the GoJ to provide an education to Syrian
refugee children are framed by the National Resilience Plan (NRP), which focuses on long-term strengthening of
the education system and the Regional Response Plan (RRP), which focuses on the short-term humanitarian
response. All activities under the RRP are in line with the “No Lost Generation” initiative, which focuses on the
long-term effects of the crisis on Syrian children. Direct budget support provided under the RRP has assisted the
GoJ in covering the cost of salaries for teachers and tuition fees for children.21
UNICEF estimated an increase in the number of Syrian children enrolled in formal schooling in Jordan from 42,098
in April to 82,232 in September 2013.22 This rose to 85,493 as of October 2013 according to the Jordanian
government.23 In December 2013, there were an estimated 90,000 children out of school, of who 30,000 were
eligible and 60,000 not eligible for formal education.24
A report by International Relief and Development (IRD) and UNHCR in November 2013 estimated that 39% of
Syrian children in Jordan were attending school.25 This stood in stark contrast with pre-crisis attendance rates
amongst children inside Syria, where 100% of male and 98% of female school-aged children were attending
regularly. At secondary school level, 67% of both male and female students attended.26
Even though less than half of Syrian students were estimated to be attending school in Jordan in 2013, those who
did contributed to overcrowding in 41% of Jordanian public schools in the governorates of Amman, Irbid, Mafraq,
and Zarqa according to the GoJ.27 A UNHCR report in the same year indicated that some refugees who tried to
enrol in public schools were not able to due to lack of space. As a result of overcrowding, the Jordanian education
system is strained, leaving teachers with diminishing time to devote to each student, thus compounding the already
difficult cultural and psychological transition Syrian that students face as they enter schools in Jordan.28
REASONS FOR LOW FORMAL ATTENDANCE RATES AMONGST SYRIAN CHILDREN
Several, often inter-linked, reasons for low formal
attendance rates amongst Syrian children have been
identified by previous studies, including: challenges in
adjusting to the Jordanian curriculum; inability to catch up
after missing months (sometimes years) of school; cost of
education; cost of living; employment to generate
household income; accessibility issues; and the
environment or capacity of the school.29
The IRD/UNHCR report from 2013 found that adjusting to the Jordanian curriculum was a challenge for Syrian
children, particularly for those that had missed some schooling.30 Support to assist them in catching up, through
services such as remedial classes, were not widely available in Jordanian schools. Syrian refugee children arriving
in Jordan have, in many cases, been out of school for several months or years. Some Syrian children never enrol
20 Ministry of Planning and International Cooperation, note 2 supra
21 UNHCR, Regional Response Plan 6 Mid-Year Review, Jordan, 2014
22 UNICEF, note 16 supra
23 Ministry of Planning and International Cooperation, note 2 supra
24 UN, National Resilience Plan, 2014-2016, January 2014
25 IRD / UNHCR, Syrian Refugees Living Outside Camps in Jordan, 2013
26 UNESCO, EFA Global Monitoring Report, Rep. Paris. 2014.
27 Ministry of Planning and International Cooperation, note 2 supra
28 UNHCR, The Future of Syria: Refugee Children in Crisis, November 2013
29 IRD / UNHCR, note 26 supra
30 Ibid.
REASONS FOR LOW ATTENDANCE:
Found it hard to adapt to curriculum
Inability to catch up after missing school
Do not have the resources to spend on
school
The school is overcrowded.
13. Joint Education Needs Assessment
Jordan - March 2015
Education Sector Working Group
Joint Education Needs Assessment - Education Sector Working Group Jordan—March 2015
13
and attend school after arriving in Jordan. This is partly due to the fact that students, until recently, could only enrol
in formal education provided that there was no more than a 3-years-age difference between them and other
students in the grade to which they are admitted.31 If the difference was wider than 3 years they were essentially
not eligible to enrol for schooling. However, eligibility cannot be considered the sole barrier to enrolment and
attendance. As of June 2014, less than 45% of Syrian children (43,791 girls and 41,740 boys) who were eligible
for formal public schools were enrolled.32
Cost of education and cost of living
Although the Jordanian government provide primary and secondary education free of charge to all students in
Jordan, families bear auxiliary costs, which one study found amounted to an average 27 JOD per household per
month. These include transportation and education materials, such as books, clothing, and stationery.33
Kindergarten does not current have the same amount of government support at primary and secondary education
in Jordan. Approximately one third of Jordanian children are reported to attend kindergarten34. Amongst these,
88% attend private kindergarten.35 While public kindergarten remains available to some (through the government
and NGOs), the fact that the vast majority of kindergarten attending students are at private institutions highlights a
relative inaccessibility for Syrian refugee children, whose families may not be able to afford school fees.36 This puts
Syrian students at a disadvantage; they are more likely to lack a foundation when they enter the first grade.
Syrian households may face difficulties in covering expenses of education and other basic needs due to several
factors. For those accessing employment, wages have fallen, partly driven by the influx of refugee workers –while
rents have risen, again driven by a population increase that has surpassed the provision of affordable housing. For
Syrian households, as expenses have increased and incomes fallen, humanitarian assistance that have been
relied on by many, has simultaneously been decreasing.37 Syrian households are reported to be resorting to
reliance on children to contribute to household incomes to cover basic needs such as rent. One study found that
47% of Syrian households reported that at least a portion of their income was earned by a child.38
Although particularly lower-income Jordanian households are likely to be similarly affected by rising rents and
falling wages, child labour has been found to be more common among Syrian than Jordanian children; one study
has found that over five times as many Syrian children are engaged in child labour.39 This amounts to an estimated
30,000 (16%) Syrian children in Jordan that are engaged in child labour, a proportion that is four times higher than
before the crisis.40 The governorates with the highest percentages of child labour are Balqa (42%), and
Ghor/Jordan Valley (41.75%). This can be attributed to the availability of seasonal work, driven by the relatively
large agriculture sector in the governorates.
Problems with capacity of schools
Lack of accessibility, hostile environment, and low capacity of some schools has also reportedly prevented Syrian
children from enrolling in formal public schools in Jordan. Jordanian schools have also been reported to lack the
resources to fully support the refugees. Some schools are already operating at full capacity, amounting to 120
schools in 2013, and cannot financially afford to implement a two-shift system to increase capacity.41
31 The difference is calculated based on the average date of birth of the students in that grade (from 1 January to 31 December) and the admission age in the
first grade as a base year.
32 UNHCR, note 22 supra
33 UNICEF, note 16 supra
34 Creative Associates, Jordan Education Reform Support, 2011
35 USAID, Jordan Fiscal Reform Project, 2011.
36 USAID, Kindergartens’ Policies Review Report in the Ministry of Education in Jordan, 2011.
37 UNICEF, note 16 supra
38
Child Protection and Gender Based Violence sub-working Group in Jordan, Interagency/UN Women Assessment of Gender-Based Violence and Child
Protection among urban Syrian refugees in Jordan, with a focus on early marriage, 2013
39
UNICEF Education Section & Save the Children Jordan, Comprehensive Outreach Assessment on Education Needs of Syrians in Ghor and Irbid, 18 Feb
– 20 Mar 2013.
40
Jordan Times, ‘Rising number of working Syrian children hinders efforts to combat child labour’, 11 June 2013, available at: http://jordantimes.com/rising-
number-of-working-syrian-children-hinders-efforts-to-combat-child-labour
41
UNHCR, Syria Regional Response Plan 6: Jordan 2014.
14. Joint Education Needs Assessment
Jordan - March 2015
Education Sector Working Group
Joint Education Needs Assessment - Education Sector Working Group Jordan—March 2015
14
Syrian students who are eligible for schooling sometimes enrol before deciding to drop out. In addition to the
difficulty in adjusting to the Jordanian curriculum, as mentioned above, Syrian students living outside refugee
camps also cited long distances to schools. Others feared discrimination from both students and teachers in
Jordanian schools and some reported leaving school after experiencing sexual harassment or violence.42
CHILDREN WITH DISABILITIES43
In October 2013, a UNICEF desk review estimated that up to 10% of Syrian refugee children may be living with a
disability (physical, mental, or sensory) across the region,44 which was largely in line with WHO global findings45
as well as UNHCR data collected in the region in September 2013.46 Children with disabilities face considerable
barriers in obtaining an education, including attitudinal barriers with parents; physical barriers associated with
accessibility at school; and lack of services and trained staff.
While data on school attendance amongst Syrian refugee children with disabilities living in Za’atari refugee camp
in Jordan is available, no data could be located on Syrian refugee children with disabilities in host communities. If
the trend in host communities is similar to that of Za’atari, Syrian children with disabilities are likely to have lower
levels of school attendance than children without disabilities.47
Although the present JENA will attempt to shed light on access to education by children with disabilities, the sample
was not drawn specifically from children with disabilities, hence the number of children encountered with disabilities
during the assessment is not large enough to generalise findings with confidence to children with disabilities overall.
Further research is recommended, targeting children with disabilities in particular, to generate quantifiable findings
on this vulnerable group of children.
EDUCATION PROGRAMS IN JORDAN
Following the influx of refugees into Jordan, the Ministry of Education (MoE) of Jordan, UN agencies, INGOs, and
NGOs introduced programs to address the gaps in Syrian children’s education caused by the war. The Government
of Jordan has prioritised education in their refugee response since the onset of the Syrian crisis. From 2011 to
2013 the MoE budget increased by 17%, with the bulk of this spent on primary and secondary education.48 To
accommodate the increase in the number of students as a result of the Syrian crisis, the Jordanian government
have opened 98 double-shift schools.49 The total proportion of students attending double-shifted schools rose from
7.6% in 2009 to 13.4% in 201450. The number of double-shifted schools is expected to continue to increase.51
In particular, MoE and UNICEF are working with partners in host communities and camps to provide alternative
education to students that are no longer eligible to enrol in public school, which were estimated at over 77,000 as
of the RRP6 Mid-Year Update in June 2014.52 The RRP6 Mid-Year Update also highlighted that there are currently
51 non-formal education centres that serve children and youth. These centres have programmes certified by the
Jordanian MoE and have accelerated learning courses which allow children to obtain a qualification equivalent to
the 10th grade certificate.
42
UNICEF, note 16 supra
43 Children with disabilities is defined as, “those who have long-term physical, mental, intellectual or sensory impairments which in interaction with various
barriers may hinder their full and effective participation in society on an equal basis with others”. Children with chronic illness and injuries were also included
in this report.
44 UNICEF, note 16 supra
45 According to the World Health Organization (WHO), around 10 per cent of the world’s children and young people, some 200 million, have a sensory,
intellectual or mental health impairment. Specialists, however, agree on a working approximation giving a minimum benchmark of 2.5 per cent of children
aged 0-14 with self-evident moderate to severe levels of sensory, physical and intellectual impairments. An additional 8 per cent can be expected to have
learning or behavioural difficulties, or both.’ as used by the Convention on the Rights of Persons with Disabilities.
46 UNHCR, Needs, Gaps and Targets-Presentation at the Regional Response plan workshop 2013-provisional results, Sept 2013
47 UNICEF, Shattered Lives: Challenges and Priorities for Syrian Children and Women in Jordan, Jordan, June 2013. This was supported by preliminary data
from Handicap International, as reported in Education Sector Working Group, Joint Education Needs Assessment, Za’atari Refugee Camp, Jordan, April
2013.
48 UN, note 25 supra
49 UNICEF, Syria crisis monthly humanitarian situation report, April 2014
50 Ministry of Planning and International Cooperation, note 2 supra
51 UNHCR, note 22 supra
52 Ibid.
15. Joint Education Needs Assessment
Jordan - March 2015
Education Sector Working Group
Joint Education Needs Assessment - Education Sector Working Group Jordan—March 2015
15
METHODOLOGY
A mixed methods approach was used to implement this Joint Education Needs Assessment (JENA), consisting of
a nationally representative quantitative household survey, supplemented by nation-wide focus group discussions.
The overall objective was to explore topics related to formal, informal and non-formal education for Syrian
refugees in Jordan, as well as issues relevant to children with disabilities and youth. Methodology and
questionnaires were developed in close partnership with the JENA taskforce within the ESWG. Questionnaires
were based on indicators developed using the Inter-Agency Network for Education in Emergencies (INEE)
minimum standards.
SAMPLING
Quantitative data was collected to assess Syrian refugee children living in Jordanian host communities, with a
focus on school-aged children, yielding a nationally representative sample of 4,742 household interviews and
9,085 school-aged children.53 The target sample size aimed for a 95% level of confidence and a 5% margin of
error on the governorate level, a conventionally used benchmark in the humanitarian and social research
community54, which was achieved for all governorates except four.55 The sample was stratified by district level to
ensure representation of refugees across districts within each governorate, with a target of 90% confidence level
and 10% margin of error at the district level.56
The formula used to calculate the sample size – and estimate confidence level and margin of error once data was
collected – was first outlined by Krejcie and Morgan in 1970 and has been widely used in social research (3,313
known citations).57 It is described as follows:
n= X2 x N x (1-P) / (ME2 x (N-1)) + (X2 x P x (1-P))
Where:
n = Sample size
X2 = Chi-square for the specified confidence level at 1 degree of freedom
N = Population size
P = Population proportion (assumed to be 0.5 to generate maximum sample size)
ME = desired Margin of Error (expressed as proportion)
District and governorate level registered refugee figures were used to calculate the target sample size. The overall
Syrian refugee population numbers by district is not publicly accessible but was estimated using anonymised
registration data from December 2013, obtained via the World Food Programme (WFP) during a previous
assessment (the Comprehensive Food Security Monitoring Exercise).58 This was the most accurate data source
for the geographical distribution of refugees at district level that was available at the time of the assessment.59
The aim to sample from every district hosting Syrian refugees was achieved in all cases except one – Ma’an City,
which could not be accessed at the time of data collection due to security reasons.
Quantitative sampling was conducted as follows:
For each district, three sources of information were used to map all communities hosting Syrian households:
53 69 interviews were excluded during the data cleaning process for containing inconsistent or contradictory information, reducing the sample from 4812.
54 Used for example in UNICEF Multiple Indicator Cluster Surveys: http://www.childinfo.org/mics3_manual.html
55 These were Balqa, Aqaba, Madaba and Ma’an governorates – please see Limitations section for details on increased margin of error in these governorates.
56 For areas with very small refugee populations, target sample sizes were combined for two districts to reach the overall confidence level of 90% and 10%
margin of error for two districts at a time. This did not affect the governorate level significance of findings, which was the level of analysis.
57 Krejcie and Morgan, Determining Sample Size for Research Activities, 1970, Educational and Psychological Measurement, 30, pp. 607-610,
58 WFP and REACH Initiative, Comprehensive Food Security Monitoring Exercise (CFSME), Syrian Refugees in Jordan, July 2014, available at:
http://reliefweb.int/sites/reliefweb.int/files/resources/WFPCFSMEJuly2014_0.pdf
59 Latest UNHCR registration figures could have been used as an alternative basis for estimating district level sampling size targets. However, access to this
data had not been granted to REACH and was therefore not possible to consider.
16. Joint Education Needs Assessment
Jordan - March 2015
Education Sector Working Group
Joint Education Needs Assessment - Education Sector Working Group Jordan—March 2015
16
o Updates obtained from a network of 1,094 Syrian key informants that was first established in
2013;
o Consultations with community leaders and members;
o Consultations with local implementing agencies.
Once areas with refugee populations were identified, systemised random sampling was used to select the
targeted number of households for interview, a process which was supervised by field team coordinators.60
In the event of non-response by a household, the data collector proceeded to visit the next household, this
occurred with roughly 1% of selected households.61
The sampling was conducted at household level. Children assessed through these interviews are mapped on the
next page, outlining the number assessed by district and governorate with resulting confidence level and margin
of error.
60 Randomised sampling in the field is a commonly used approach when no complete listing of the overall population is accessible: UNICEF, Rapid
Assessment Sampling in Emergency Situation, 2010, available at: http://www.unicef.org/eapro/Rapid_assessment_sampling_booklet.pdf
61 Revisits were not possible given the scope and time-frame of data collection.
17. Map 1: Sampling – Number of Syrian children assessed by governorate and statistical significance
18. Joint Education Needs Assessment
2015
Education Sector Working GroupJoint Education Needs Assessment
Jordan – March 2015
Education Sector Working Group
DATA COLLECTION
Quantitative data collection
Table 1: Proposed and achieved quantitative sample size – excluding 70 cases due to errors
Quantitative data collection was conducted between 22
May and 30 June 2014, by 22 enumerators supervised
by four field coordinators and organised by one field
operations coordinator, working in mixed sex teams of
two. The Open Data Kit (ODK) platform with GPS-
enabled technology was used for quantitative data
collection to enable data collection on smartphones,
thereby reducing the incidence of inaccuracies and
inconsistencies in the data collection, cleaning and
analysis processes. Data collection was preceded by
one week of training, led by an assessment officer.
Quantitative data collection questionnaires were piloted
with a small team of data collectors before the training
and results from the pilot guided the database team in
adjusting skip logic, constraints and translations in the
ODK questionnaire. The pilot to test the questionnaire
was followed by a full-team pilot on the final day of
training, when the questionnaire was put to the test by
the whole team, with feedback incorporated to clarify any
remaining potentially confusing questions or options.
Full guidance was provided for each question on the
screen and skip logic ensured that enumerators were
guided through the questionnaire depending on answers
provided by the respondent, removing the need for
enumerators to manually check sections. Each interview
was conducted with the household head or a parent and
field team supervisors reviewed each completed
questionnaire to enable return to household for
verification of information, before uploading to the ODK server, where a second review was conducted by the
Assessment Officer and Database teams with the aim of detecting errors on a daily basis and feedback immediately
to the field teams. Personal and household identifiers for interviewed households were avoided during data
collection to ensure respondents could provide answers openly and to mitigate any potential protection concerns.62
However, unique codes were generated for each interview to enable linkage of individual and household data
without the need for personal or household identifiers.
Qualitative data collection
Qualitative data collection was undertaken between 15 May and 29 June 2014 by a team of 20 enumerators
supervised by three field coordinators and organised by one field operations coordinator.63 Qualitative data
collection was preceded by three full days of training, one day of piloting and a full day of pilot de-briefing and
preparation for full-scale data collection led by an assessment officer. Qualitative data collection was undertaken
with semi-structured questionnaires on paper-forms, enabling note-takers to record all that was said in the focus
group discussions, which were guided by a pre-set range of questions which participants discussed freely.
62 Identifiers are of limited value given that data was collected on a sample as opposed to a full ‘census’ of the refugee population.
63 Complementary data collection was undertaken on February 2015 to replace two FGDs in the NFE section that had been conducted with ineligible centres
Governorate Proposed
household
sample
Achieved
household
sample
Amman 640 643
Al Balqa 385 331*
Zarqa 390 419
Madaba 400 240*
Irbid 720 859
Al Mafraq 400 486
Jerash 385 387
Ajloun 400 410
Al Karak 380 362
Al Tafiela 199 201
Ma’an 240 203*
Al Aqaba 315 191*
Total 5,974 4,732
*See Limitations section below
Age Group # Girls # Boys # Children
Age 0-2 1,317 1,370 2,687
Age 3-5 1,748 1,996 3,744
Age 6-11 2,477 2,597 5,074
Age 12-17 1,915 2,096 4,011
Total 7,457 8,059 15,516
Table 2: Children in sample, by age and gender
19. Joint Education Needs Assessment
Jordan – March 2015
Education Sector Working Group
Joint Education Needs Assessment - Education Sector Working Group Jordan—March 2015
17
Education facilities were identified through various sources. For formal and non-formal education (NFE), a list of
schools was provided by ESWG, focal point contact details were then provided by the MoE focal point6465. Two
centres were discovered during the data analysis stage where implementation had not been provided by
Questscope. FGD data from these centres were subsequently removed from the analysis and replaced by data
from two eligible centres, which was collected in February 2015. Informal education centres were contacted directly
by field teams visiting each governorate – either by directly approaching centres or through enquiries with local
NGO offices that work to support informal education centres – to establish whether they catered for Syrian children
and if so, include them in the survey.66 This included centres supported by ESWG members in addition to
community based organisations and other local actors. Once education facilities were identified, the data collection
team worked with centres to convene FGDs in designated districts across all 12 governorates. FGD participants
were selected from 24 categories identified by the JENA taskforce of the Education Sector Working Group. The
assessment team completed 330 focus groups in total, with a total of 2,136 participants.
Table 3: Types of focus group by number of focus group discussions achieved
Focus Group Type Total Achieved FGDs
Formal School
Boys Syrians attending grades 1-6 16
Girls Syrians attending grades 1-6 16
Boys Syrians attend grades 7-12 18
Girls Syrians attend grades 7-12 15
Parents of children in school - in PTA 9
Jordanian teachers/counsellors/assistants - formal education 18
Key informant interview with headmaster 11
Dropped Out and Out of School
Boys Syrians dropped out grades 7-12 10
Girls Syrians dropped out grades 7-12 10
Boys Syrians dropped out grades 1-6 16
Girls Syrians dropped out grades 1-6 14
Boys Syrians out of school age 12-17 16
Girls Syrians out of school age 12-17* 18
Boys Syrians out of school age 6-11 15
Girls Syrians out of school age 6-11 17
Parents of children not attending school 16
Non Formal Education
Boys Syrians attending non-formal education 5
Girls Syrians attending non-formal education 3
Non formal education facilitators - Syrians or Jordanians 8
Informal Education
Boys Syrians attending informal education 16
Girls Syrians attending informal education 16
Informal education facilitators - Syrians or Jordanians 16
Youth
Male young people aged 18-24* 15
Female young people aged 18-24* 16
Total 330
64 See Ministry of Education portal: http://www.moe.gov.jo/MenuDetails.aspx?MenuID=29
65 See Annex II for list of non-formal centres that could be contacted at the time of the survey and thus where FGDs were facilitated for this assessment.
66 See Annex III for list of informal centres where FGDs were facilitated for this assessment.
20. Joint Education Needs Assessment
Jordan – March 2015
Education Sector Working Group
Joint Education Needs Assessment - Education Sector Working Group Jordan—March 2015
18
Focus groups with six or more children (except for one FGD with boys in non-formal education) were conducted in
homogeneous groups (with girls and boys separately) with a teacher present. Interviews with parents; school
headmasters and facilitators were also undertaken. All focus group discussion findings disaggregated by age or
grade range; type of education; and gender can be found in Annex VII.
DATA ANALYSIS
Quantitative data analysis was conducted using Microsoft Excel and SPSS. Given that the household level
sampling was conducted to achieve a representative sample at the governorate level, stratified by district, a
national level aggregated sample was drawn from the overall household level database, to ensure national level
findings were weighted according to the refugee population size in each governorate. This was achieved by
randomly selecting the maximum possible number of interviews from each governorate, while respecting the
population proportion in relation to the refugee population size. The table below outlines the national level sample
of 3,058, which was limited by the total sample size achieved in Mafraq governorate (486):67
Table 4: Number of households selected for national level findings – by proportion of total refugee population
Governorate Households
(Based on
registered
refugees as of
June 2014)68
Proportion of
overall
households
Number of households
interviewed and
included in
governorate level
analysis
Number of households
selected for national
level analysis
(weighted according to
overall population
proportion)
Ajloun 1,705 2% 410 63
Al Balqa 3,134 4% 331 116
Al Mafraq 12,226 15% 486 452
Al Tafiela 418 1% 201 15
Amman 26,824 32% 643 991
Aqaba 471 1% 191 17
Irbid 23,240 28% 859 859
Jerash 1,871 2% 387 69
Karak 1,586 2% 362 59
Ma’an 1,153 1% 203 43
Madaba 1,663 2% 240 61
Zarqa 8,460 10% 419 313
TOTAL 82,751 100% 4,732 3,058
To process the large amount qualitative data, an analysis matrix was designed to capture key phrases or words
that emerged during focus group discussions. Themes distinguishable from the phrases and words captured during
the FGDs were then summarised in tables to enable analysis — these summary tables are available in full in Annex
VIII. All frequently encountered terms are outlined in the FGD glossary in Annex II.
67 The Mafraq governorate level sample had the smallest number of interviews per percentage of the nationwide refugee population (19.44) – hence 19.44
was the highest number of interviews that could be drawn from each governorate per percentage refugee population, generating a total sample of 1,912.
68 Since governorate level registration figures are publicly available, registered refugee figures at the time of data collection (as of June 2014) were used to
calculate the proportion of the sample from each governorate needed for a weighted national level sample.
21. Joint Education Needs Assessment
Jordan – March 2015
Education Sector Working Group
Joint Education Needs Assessment - Education Sector Working Group Jordan—March 2015
19
LIMITATIONS
For formal education, this assessment was limited to public schools in Jordan. It does not include other
schools, such as UNRWA or private sector schools.
69 (1.5%) of household interviews were excluded from the final analysis after contradictory answers were
identified during the data cleaning process.69
A mistake in the Arabic translation of the household questionnaire created a gap of one year between two
age-groups (25-59 and more than 60). It was discovered during the analysis phase that enumerators had
entered those aged 60 in either the 25-59 group or the more than 60 group.
Anonymised registration data obtained in December 2013 for a previous assessment (CFSME 2014) was the
only data that could be accessed at the time of the survey to estimate population figures at the district level.
More up-to-date registration data is likely to have improved estimations of sample sizes at the district level.
This does not affect the confidence and error margin levels at the governorate level, which is the level at which
results are reported.
The anonymised registration data was on the household level; hence population size was inferred by assuming
the average household size (6).70 This assumes that families with school-aged children are approximately
normally distributed across the refugee population, which was not always the case. Hence, the field teams
sometimes faced challenges in achieving the target sample size in areas with lower than average number of
school aged children per household.
Given obvious challenges faced when drawing a random sample from a portion of a population (Syrians) within
a host community without a comprehensive household list,71 it cannot be argued that every Syrian household
enjoyed equal probability of being sampled. Although the key informant network was consulted, as were
community members at locations identified to be hosting Syrians, to maximise inclusion of Syrian households
in the sampling frame, it must be conceded that some Syrian households are likely to have been omitted from
the sampling frame. It should be stressed that exclusion bias can very rarely be fully eliminated in social
research and is present also when sampling from lists (e.g. in the event of out of date phone numbers).
The target sample size was not fully reached in 4 governorates. Although the confidence level (95%) is the
same here as for the other governorates, the margin of error is slightly wider than 5%: 5.1% in Balqa, 5.5% in
Aqaba, 5.9% in Madaba and 6.3% in Ma’an. Severe challenges faced the field teams in completing interviews
in Ma’an due to widespread insecurity over several weeks during data collection. Challenges in locating
households, coupled with a need to complete data collection within a given time frame, were otherwise the
primary reasons for target sample sizes not being met.
Qualitative data collection teams occasionally faced challenges when convening FGDs, where participants
failed to show up at the agreed time and place. Qualitative data collection on NFE centres was hampered due
to eligible centres found to be temporarily closed or not to provide services to Syrians at the time of data
collection (5).
Concerns were raised following data collection that the age-ranges for some FGDs may have been too wide
to enable full participation of younger children, notably for the grade 1-6 group (age 6-11). This is a valid
concern and it is recommended that age-ranges are reviewed should this exercise be conducted again.
The distinction between NFE and IFE was not made clear to the enumerators, which made it impossible to
differentiate within the household level data at analysis stage, between children that had experience with
Informal Education and those with experience in Non-Formal Education. Given the fundamental importance
of the definition in obtaining relevant data on children in IFE/NFE, the household survey data relating to both
types was discarded. The NFE/IFE sections in this report are thus based on focus group discussion data
alone.
During data collection, human errors, along with a systematic problem with Open Data Kit (ODK), caused the
database to record the wrong number of responses. During data cleaning, some responses were integrated
into analysis as NR (“no response”). Each chart will detail a corresponding number of no responses in a
footnote.
69 This was partly related to the lengthy questionnaire which sometimes led to failures in constraints (which prevents enumerators from entering a value that
contradicts a previously filled section) as questionnaires were uploaded to be filled.
70 The average household size of 6 is based on findings from prior REACH assessments, including the nationwide CFSME (see note 59 supra)
71 The most recent census conducted in Jordan occurred in 2004.
22. Joint Education Needs Assessment
Jordan – March 2015
Education Sector Working Group
Joint Education Needs Assessment - Education Sector Working Group Jordan—March 2015
20
FINDINGS
SUMMARY OF KEY FINDINGS
Population profile
A large proportion of household members were aged less than 18 years (55%), which was reflected by a
correspondingly high age-dependency ratio.72
The average age-dependency ratio was 1.69 dependents for every non-dependent, with the highest ratio
in Irbid at 1.90 and lowest in Maan at 1.35.
19% of households were found to be headed by a woman.
A small percentage of households (0.25%) were found to headed by children, with 0.1% headed by a girl
and 0.15% headed by a boy.
Half of household heads (50%) had been educated to primary school level, with the proportion slightly
lower amongst female household heads (47%).
Female household heads were almost twice as likely (17%) as male household heads (9%) to not have
received any education at all.
Formal education
Attendance
Overall attendance rates is 61.6%: 63.5% of school-aged girls and 59.8% of school-aged boys:
6-11 boys: 70% attending, 30% not attending
6-11 girls: 70.4% attending, 29.6% not attending
12-17 boys: 47.2% attending, 52.8% attending
12-17 girls: 54.5% attending, 45.5% not attending
Highest and lowest attendance rates by governorate:
6-11 boys had highest attendance rates in Karak governorate (86.8%) and the lowest in Aqaba
governorate (54.7%).
6-11 girls had highest attendance rates in Karak governorate (84.3%) and the lowest in Aqaba
governorate (60%).
12-17 boys had highest attendance rates in Karak governorate (65.9%) and the lowest in Aqaba
governorate (28%).
12-17 girls had highest attendance rates in Balqa governorate (63.5%) and the lowest in Mafraq
governorate (46.5%)
Children who never attended formal school in Jordan:
6-11 boys: 9% never attended
6-11 girls: 8% never attended
12-17 boys: 17% never attended
12-17 girls: 14% never attended
The three primary reasons for children not to attend school were: never having attended school (which
could render older children ineligible for formal schooling); not having resources to pay for materials; and
having to work to earn money.
More than half (51%) of households where children had dropped out identified cash assistance as a
primary need to enable re-enrolment of children to formal schooling, with other primary needs felling far
behind, with the next most commonly reported being provision of transport at just 7% of affected
households.
School-aged children in households where no member had registered with UNHCR or MoI were
considerably less likely to be attending school compared to peers in households with registered members.
Children in female headed households were found to be more likely to be attending school compared to
children in male headed households, with the starkest difference seen amongst boys aged 12-17, who
72 Age dependency ratio is the ratio of dependents (people younger than 15 or older than 64) to the working-age population (those ages 15-64).
23. Joint Education Needs Assessment
Jordan – March 2015
Education Sector Working Group
Joint Education Needs Assessment - Education Sector Working Group Jordan—March 2015
21
were less likely to be attending formal education if they lived in a male headed household (44.7%)
compared to those living in a female headed household (57.5%).
Across all sex and age-groups, a positive association was found between the education status of the
household head and the likelihood of children attending school.
Children in recently arrived households were considerably less likely to be attending formal education,
across all age groups.
Reasons for not attending
Sickness, bad weather and a need to renew UN registration were the most commonly mentioned reasons
for being absent from formal education, amongst children that were currently enrolled.
Both girls and boys in the higher grade groups (7-12) also cited a need to work as a reason to not attend.
The most commonly highlighted problem facing children at school across the 1-6 grade groups was
bullying from other students and long distances to the school.
Bullying, discrimination and maltreatment were also highlighted as the most considerable problems facing
students in the 7-12 grade group, although these issues were less reported by girls.
Reasons for dropping out
Reasons for dropping out of formal education differed depending on age group – the most common reason
stated for girls aged 6-11 were lack of resources for school materials; worries that they would be teased
at school; that they had been turned away from school or that the school was too far away.
Boys aged 6-11 were also said to have dropped out due to suddenly being turned away or that the school
was too far away; in addition to overcrowding or that shifts were at inappropriate times.
Girls aged 12-17 also reported dropping out because the school was too far away or, similar to younger
girls, due to lack of resources for school materials. In addition they reported dropping out due to imminent
expectation to return to Syria; or after experiencing aggression or violence from other children.
Boys aged 12-17 were most often said to have dropped out of formal school to earn an income; but also
due to facing aggression or violence from teachers or, as with girls in both age groups, due to lack of
resources to obtain school materials.
More than half (51%) of households where children had dropped out identified cash assistance as a
primary need to enable re-enrolment of children to formal schooling.
Out of school
Children aged 12-17 were most likely to be reported to never have attended formal schooling in Jordan
— 16% and 18% of girls and boys respectively.
Younger children were less likely to never have attended — which was reported for 10% and 11% of girls
and boys respectively.
Never having attended school before, which could until recently render a child ineligible for formal
schooling if older than 9 years of age, was the most commonly stated reason for never having attended
school for girls and boy aged 6-11 and the third most common reason reported for boys aged 12-17.
Not having resources to afford materials and other education expenses was the most commonly stated
reason for girls aged 12-17, second most common for girls aged 6-11 and boys aged 6-17.
Having to work to earn money for the household was the most common reason stated for boys aged 12-
17. This correlates with focus group discussions where boys and girls aged 12-17 stated that lack of
money and working were two of the biggest reasons for never attending school.
Non-formal education
Children spoke positively about non-formal education centres in focus group discussions. Specifically
boys highlighted how well they are treated by teachers and the flexibility of schedules while girls
highlighted the wide variety of activities.
Safety is the largest concern for non-formal education students, with both boys and girls reported facing
harassment outside the centres, usually on their way to the schools.
24. Joint Education Needs Assessment
Jordan – March 2015
Education Sector Working Group
Joint Education Needs Assessment - Education Sector Working Group Jordan—March 2015
22
Informal education
Most children interviewed in informal education settings, reported that they attended informal education
centres to complement formal education.
Access to transportation to and from centres was the key issue raised by informal education students.
Safety concerns did not feature as strongly here, with FGD participants largely reporting that they faced
no particular safety and security issues when attending informal education.
Inclusive Education – Children with disabilities
The highest proportion of children with a disability was found in Jerash (3.8%) and the lowest in Aqaba
(1.1%).
The most common disabilities were physical disabilities (36% of total disabilities), followed by visual
disabilities (25%) and mental disabilities (19%).
Less than half (46%) of children with disabilities were attending school.
Girls with disabilities in the 6-11 age group were almost twice as likely to be receiving a formal education
(65%) compared to boys in the 12-17 age-group (33%).
The most commonly stated reason for not attending formal education across all age-groups was that the
school was not physically accessible.
Youth
The main desires for the future expressed by youth (aged 18-24) in FGDs were to continue studying (9
mentions in boy FGDs and 13 in girl FGDs), go back to Syria (11 mentions in boy FGDs and 5 in girl
FGDs), or obtain employment (3 mentions in boy FGDs and 5 in girls ones).
Only 1% of households reported that household members aged 18-24 were engaging in voluntary
activities — of which 38% were doing so with local CBOs, 29% were involved in the local mosque, 6%
were involved in a local school, and 4% were volunteering at aid or advocacy organizations.
One quarter of youth FGD participants reported using youth friendly spaces.
Reasons for not using youth spaces given included that they were too far away; too busy; that they were
not allowed by families; or that they found activities offered at the spaces uninteresting.
Participants in all FGDs apart from one expressed an interest in using youth spaces.
25. Joint Education Needs Assessment
Jordan – March 2015
Education Sector Working Group
Joint Education Needs Assessment - Education Sector Working Group Jordan—March 2015
23
POPULATION PROFILE
The majority of the Syrian refugee population assessed were found to be aged less than 18 years of age (55% of
the total population), including 32% that were of school-age (6-17). 4% of the assessed population were found to
be persons living with a disability. 3% of school aged children and 3.4% of youth aged 18-24 have at least one
disability. 9% of the total assessed population are currently injured or chronically ill, including those in the
population who are disabled.
Figure 1: Sex and Age Disaggregated Data for Assessed Population73
The large proportion of household members aged less than 18 years was reflected by correspondingly high age-
dependency ratios. The overall average ratio was 1.66:1 – with considerable variation between governorates.
Ajloun and Irbid had the highest average dependency ratios (1.9:1) – amounting to almost twice as many
dependents (1.9) as non-dependents (1) on average across households.74 By contrast, 60% of the population
overall in Jordan was estimated to be of working age by a study in 2013, indicating a reverse trend in the host
community population.75 High age-dependency ratios can be an indicator of stretched household economies, as
the age-brackets reflect ages when household members are expected to be economically active by working and
generating income. A high number of dependents compared to non-dependents may mean that a high number of
household members not economically active are supported by a low number of members that are.
73 43 no responses removed
74 Age-dependency ratio is used here, where household members aged less than 16 or 65 and over are considered dependents, while those aged between
17 and 64 are considered non-dependents.
75 World Bank, Age dependency ratio (% of working age population), 2013 (accessed August 5th, 2014)
20 15 10 5 0 5 10 15 20
0-2
3-5
6-11
12-17
18-24
25-59
60+
Female
Male
26. Joint Education Needs Assessment
Jordan – March 2015
Education Sector Working Group
Joint Education Needs Assessment - Education Sector Working Group Jordan—March 2015
24
Figure 2: Average dependency ratio - by governorate76
The survey found that 19% of Syrian refugee households were headed by women, and the remaining 81% were
headed by men. Considerable variation in marital status was found amongst female and male households. Almost
all male household heads were married (98%) which was found to be the case for less than two-thirds of female
household heads (63%), amongst which 30% were widowed.
Figure 3: Proportion of school-aged boys and girls attending formal education77
Half of household heads (50%) had been educated to
primary school level; with the proportion slightly lower
amongst female household heads (47%) compared to
male household heads (51%). Female household heads
were almost twice as likely (17%) as male household
heads (9%) to not have received any education at all.
FORMAL EDUCATION
Findings from this assessment indicate that the
overwhelming majority of Syrian children attending forms
of education in Jordan are attending formal education
(93%).78
Attendance
61.6% of school-aged Syrian refugee children across
Jordan were attending formal education at the time of the
assessment, amounting to 63.5% of school-aged girls
and 58.9% of school-aged boys.
76 43 No responses removed
77 27 no responses removed
78 This assessment did not collect information related to enrolment but focused on information related to attendance. Enrolment data can be accessed from
the Ministry of Education (see Appendix).
27. Map 2: Proportion of school-aged Syrian refugee children not attending school
28. 26
Joint Education Needs Assessment
Jordan - March 2015
Education Sector Working Group
26
The highest attendance rates were found across the younger age groups (6-11) in all governorates — 70%
of boys and 70.4% of girls in this age-group attended formal education nationwide, as shown in Figure 4
below. The highest proportion of school-aged children attending amongst both boys (86.8%) and girls (84.3%) was
found in Karak Governorate, while the lowest proportions were found in Aqaba, at 42% of boys and 59% of girls
(see Figure 5 below).
Figure 4: Proportion of school-aged children attending formal education – by sex and age79
The older age-group (12-17) saw lower attendance rates overall across the governorates, particularly
among boys — 47.2% of boys and 54.5% of girls in this group attended formal education nationwide (see
Figure 4 above). The lowest proportion was seen in Aqaba Governorate for boys (28%) and in Mafraq Governorate
for girls (46.5%), as illustrated by Figure 5 below.
79 27 no responses removed
29. Joint Education Needs Assessment
Jordan - March 2015
Education Sector Working Group
Joint Education Needs Assessment - Education Sector Working Group Jordan—March 2015
27
Figure 5: Proportion of school-aged children attending formal education – by sex, age and governorate80
Across all sex and age-groups, a significant association was found between the education status of the household
head and the likelihood of children attending school, as illustrated by Figure 6 below. Amongst boys aged 6-11,
63% were attending school where the household head had received no education, compared to 66.8% where the
head had primary school education and over 80% where the household head held a university degree.
80 27 no responses removed
30. Joint Education Needs Assessment
Jordan - March 2015
Education Sector Working Group
Joint Education Needs Assessment - Education Sector Working Group Jordan—March 2015
28
The most pronounced difference was seen amongst girls aged 12-17 who were almost twice as likely to be
attending school if they lived in a household headed by a member with a University degree (66.7%) compared to
those who lived with a household head that had received no education (37.6%).
Figure 6: Proportion of school-aged children attending school – by education level of household head81
Despite lower likelihood of having an educated household head, and higher likelihood of having a
household head that is widowed and thus heading the household single-handedly, children in female
headed households were found to be slightly more likely to be attending school compared to children in
male headed households (see Figure 7 below). This held true in all age and sex groups, with the starkest
difference seen amongst boys aged 12-17, who were less likely to be attending formal education if they lived in a
male headed household (44.7%) compared to those living in a female headed household (57.5%). By contrast, the
smallest difference was seen amongst boys aged 6-11, who were only slightly more likely to be attending if they
lived in a female headed household (72.4%), compared to those living in a male headed household (69.3%). It
could be that efforts have been made to target education services towards female headed households, further
research is recommended to explore factors underpinning this variation.
81 27 no responses removed
31. Joint Education Needs Assessment
Jordan - March 2015
Education Sector Working Group
Joint Education Needs Assessment - Education Sector Working Group Jordan—March 2015
29
Figure 7: Proportion of girls and boys attending school – by sex of household head82
Another household characteristic that was explored in this assessment was registration status of the household
with UNHCR or MoI. The sampling methodology used in this assessment, which took care not to exclude any
particular type of Syrian refugee households from the sampling frame, enabled analysis of the association between
access to education and registration status.
The majority of households were found to have at least one member registered with UNHCR/MoI but a small
proportion (4%) was found to have no registered member. School-aged children in these households were found
to be considerably less likely to be attending school compared to peers in households with registered members.
The starkest difference was seen amongst boys aged 6-11, where 70.4% attended formal education of those living
in a household with a registered member, compared to 55.2% of those living without a registered member (see
Figure 8 below).
82 27 no responses removed
32. Joint Education Needs Assessment
Jordan - March 2015
Education Sector Working Group
Joint Education Needs Assessment - Education Sector Working Group Jordan—March 2015
30
Figure 8: Proportion of boys and girls attending school – by age group and whether at least one household member
was registered with UNHCR/MOI83
Level of school attendance was found to be correlated with time of arrival in Jordan, as shown in Figure 9 below,
which held true when controlling for age and sex of children. Across all age and sex groups, children were more
likely to be attending school if they had arrived in Jordan during 2012 compared to 2013. Settling in a new country
may take some time and lower attendance figures at first may seem unnecessarily alarming, however, even though
a steep increase can be seen between arrivals in 2014 compared to 2013, a gap remains compared to those that
arrived even earlier, indicating that more effort could be made to enter children into the formal education system
at a faster pace. It should be noted that attendance levels for children arriving in 2014 may be low because since
they recently arrived, they are waiting for the next semester to being enrolled.
Figure 9 : Proportion of boys attending formal education – by age and time of arrival84
83 27 no responses removed
84 27 no responses removed
0%
20%
40%
60%
80%
100%
Q1
2011
Q2
2011
Q3
2011
Q4
2011
Q1
2012
Q2
2012
Q3
2012
Q4
2012
Q1
2013
Q2
2013
Q3
2013
Q4
2013
Q1
2014
Q2
2014
Boys 6-11 Boys 12-17
33. Joint Education Needs Assessment
Jordan - March 2015
Education Sector Working Group
Joint Education Needs Assessment - Education Sector Working Group Jordan—March 2015
31
To contextualise findings from the quantitative data collection with qualitative data, REACH facilitated 65 focus
group discussions with a total of 478 students attending formal school from 1st to 12th grade. Students were asked
about likes and dislikes of attending school; reasons for going to school; reasons for missing school; and problems
while attending school. Full FGD tables are included in Annex VIII while summary tables are provided in the
sections below.
Likes and dislikes attending formal school85
Reasons why children enjoy or do not enjoy attending formal school were explored through focus group
discussions. FGDs were divided into both gender and grade groups. In total, there were four group types: boys in
grades 1-6, girls in grades 1-6, boys in grades 7-12, and girls in grades 712. The most commonly stated reasons
for enjoying attending school, across all sex and age-groups, was that it was an opportunity for learning and
meeting friends. Conversely, aggression faced from students or teachers was the most commonly stated reason
for not enjoying going to school, again across all sex and age-groups (see Tables 5 and 6 below).
85 More in-depth explanation of FGD terms can be found in the appendix.
0%
20%
40%
60%
80%
100%
Q1
2011
Q2
2011
Q3
2011
Q4
2011
Q1
2012
Q2
2012
Q3
2012
Q4
2012
Q1
2013
Q2
2013
Q3
2013
Q4
2013
Q1
2014
Q2
2014
Girls 6-11 Girls 12-17
Figure 10: Proportion of girls attending formal education – by age and time of arrival
34. Joint Education Needs Assessment
Jordan - March 2015
Education Sector Working Group
Joint Education Needs Assessment - Education Sector Working Group Jordan—March 2015
32
Table 5: Likes and dislikes of children attending formal school (grades 1-6)
Table 6: Likes and dislikes of children attending formal school (grades 7-12)
Formal School Likes
(Grades 7-12)
Boys Girls Total
Formal School
Dislikes (Grades 7-
12)
Boys Girls Total
Meeting friends 13 9 22 Discrimination 14 8 22
Learning/studying 12 9 21 Physical aggression 9 2 11
Teachers 6 8 14 Unsafe Environment 4 4 8
Activities/
Entertainment
4 4 8 Lack of Activities 3 2 5
Other (4 categories) 5 1 6 Language 2 3 5
(Formal School Grades 1-6, FGD total = 32)
Forced to go 1 4 5
Uniforms 0 4 4
Other Reasons (8
categories)
5 5 10
(Formal School Grades 7-12, FGD total = 33)
Reasons for going to school - children attending formal education
Children were also asked the top reason for attending school. Similar to the top likes of going to school, the top
reason for going to school for all age groups was to learn and study. For boys and girls in grades 1-6, playing was
the second highest mentioned reason, followed by “wanting to go to in order to achieve their dreams”. Boys and
Formal School Likes
(Grades 1-6)
Boys Girls Total
Formal School
Dislikes
(Grades 1-6)
Boys Girls Total
Learning/studying 10 10 20
Physical
aggression
8 11 19
Playing 9 10 19 Problems/conflicts 11 0 11
Meeting friends 13 4 17 Unsafe 2 5 7
Teachers do not beat
them
0 8 8 Language 0 6 6
Participating in
activities
0 8 8 Discrimination 1 3 4
Teachers 5 0 5
Classroom
management
0 4 4
Activities/Entertainment 4 0 4 Others 2 9 11
Meeting teachers 1 1 2 (Formal School Grades 1-6, FGD total = 32)
(Formal School Grades 1-6, FGD total= 32)
35. Joint Education Needs Assessment
Jordan - March 2015
Education Sector Working Group
Joint Education Needs Assessment - Education Sector Working Group Jordan—March 2015
33
girls in grades 7-12 had “to achieve dreams” as their second highest reason, followed by “wanting to go to school
in order to get a job” as their third highest reason (see Table 7 below).
Table 7: Reasons for going to school
Reasons for going
to school (Grades
1-6)
Boys Girls Total
Reasons for going
to school
(Grades 7-12)
Boys Girls Total
To learn/study 17 14 31 To learn/study 13 14 27
To play 8 7 15 To achieve dreams 7 9 16
To achieve dreams 10 2 12 To get a job 4 3 7
Country building 0 8 8 To make friends 2 4 6
To make up missed
class
0 5 5
Other (5
categories)
5 4 9
Other (4 categories)* 5 3 8 (Formal School Grades 7-12, FGD total= 33)
(Formal School Grades 1-6, FGD total= 32)
Reasons for missing school - children attending formal education
When asked why children miss school children of all grade levels indicated sickness as their top reason. For boys
and girls in grades 1-6, bad weather was the second most commonly stated reason, followed by missing school in
order to review UN registration. For children in grades 7-12, renewing UN registration was their second most
commonly stated reason for missing school, followed by a need to work. Both girls and boys cited a need to work
(5 mentions in girl FGDS and 6 mentions in boy FGDs respectively).
Table 8: Reasons for missing school
Reasons for
missing school
(Grades 1-6)
Boys Girls Total
Reasons for
missing
(Grades 7-12)
Boys Girls Total
Sickness 15 14 29 Sickness 12 12 24
Weather 4 4 8
Renew UN
registration
11 9 20
Renew UN
registration
5 2 7 Work 6 5 11
Visiting relatives 1 3 4 Financial situation 3 3 6
Difficult
curriculum
2 1 3 Maltreatment 3 3 6
Other (5
categories)
7 2 9
Family circumstances
Other (6 categories)
9 4 13
(Formal School Grades 1-6, FGD total= 32) (Formal School Grades 7-12, FGD total= 33)
Problems going to school and solutions – children attending formal education
Both FGD child population age-groups (grades 1-6 and 7-12) attending formal education were asked about key
problems they faced in school. The tables below outline the frequency with which different problems associated
with formal education attendance were mentioned. The most commonly highlighted issues in 1-6 grade groups
36. Joint Education Needs Assessment
Jordan - March 2015
Education Sector Working Group
Joint Education Needs Assessment - Education Sector Working Group Jordan—March 2015
34
were bullying from other students and long distances to the school. Bullying was also highlighted in the
7-12 grade range in addition to discrimination and maltreatment. In contrast to the lower grade range, where
distance to school was one of the most frequently mentioned problems, this was never mentioned in any FGDs
with the 7-12 grade groups. It could be that students were interpreting the same problem in different ways. Distance
to school for younger students were seen as a financial problem (lack of funding for transportation to school) for
older students.
37. Joint Education Needs Assessment
Jordan - March 2015
Education Sector Working Group
Joint Education Needs Assessment - Education Sector Working Group Jordan—March 2015
35
Table 9: Problems attending formal education
Problems attending
formal education
(Grades 1-6)
Boys Girls Total
Problems
attending formal
education
(Grades 7-12)
Boys Girls Total
Bullying from other
students
9 8 17 Discrimination 11 7 18
Too far away from
school
3 5 8
Bullying from
other students
7 4 11
Teachers lack of
interest
2 4 6 Maltreatment 7 0 7
Discrimination 1 5 6 Difficult curriculum 3 3 6
Physical aggression 0 5 5
Cursing/Verbal
Abuse
2 4 6
No problems 4 0 4
Teachers lack of
interest
3 2 5
Transportation 3 0 3 Financial Situation 3 1 4
Fear of safety 3 0 3 Long hours 2 1 3
Public facilities not
clean
3 1 3
Downgraded one
academic year
0 2 2
Weapons brought to
school by students
2 0 2
Teachers beat
students
2 0 2
Inability to understand
the curriculum
2 0
2 No break time
1 0 1
UNHCR Registration 0 1 1 (Formal School Grades 7-12, FGD total= 33)
(Formal School Grades 1-6, FGD total= 32)
When asked about solutions to these problems, boys and girls from grade 1-6 said that providing transportation is
the best solution, followed by suggestions to build schools for Syrians only, while some felt that there was no
solution to the problem they faced, usually when referring to bullying from other students. Students in grades 7-12
also suggested separating Syrians from Jordanians, as well as mentioned that the school needs to be more aware
of the problems they face from other students. Others mention that receiving financial support would be helpful,
which may be linked to the fact that missing school in order to work was mentioned in 1/3 of the FGDs, with students
in this grade range attending formal education (see Table 8 above: Reasons for missing school).