Here’s a clear and classroom-friendly PowerPoint description you can place in your introduction slide or overview slide:
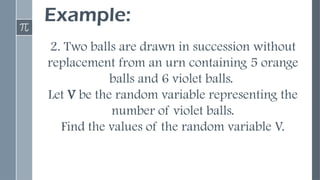
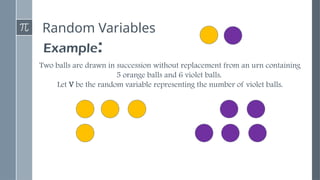
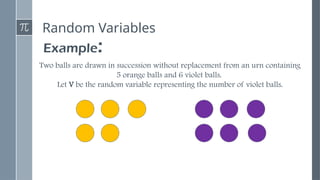
Random Variables – Presentation Description
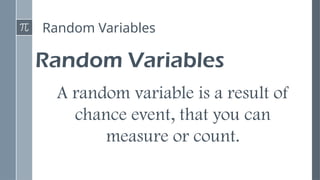
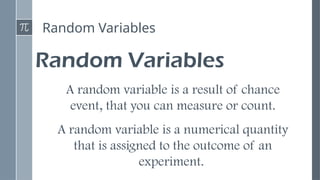
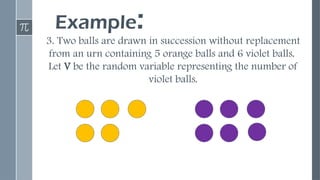
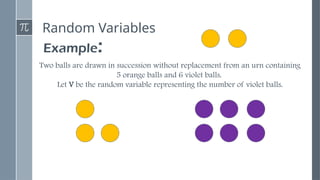
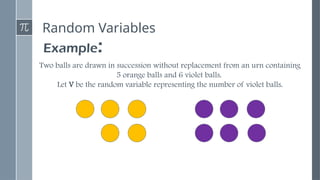
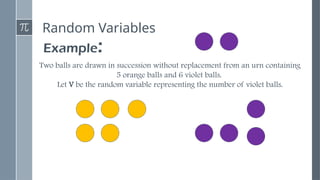
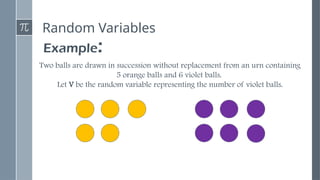
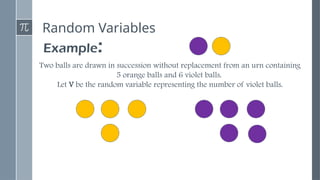
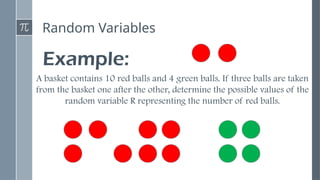
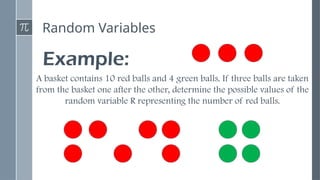
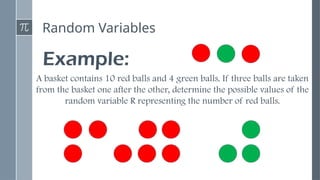
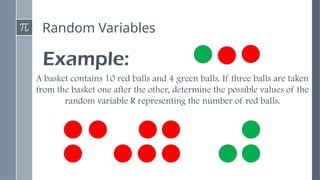
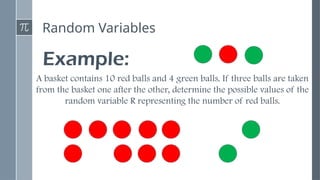
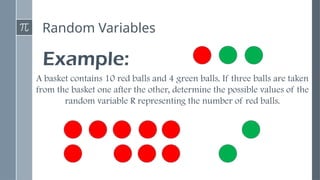
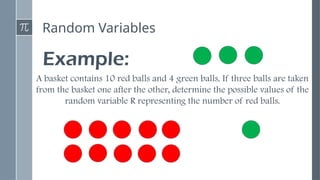
This presentation introduces the concept of random variables, a fundamental idea in probability and statistics. It explains how random variables are used to assign numerical values to the outcomes of a random experiment. The discussion covers the two main types of random variables—discrete and continuous—along with their characteristics, examples, and real-life applications.
Students will learn how to:
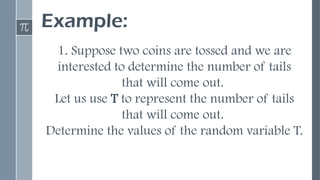
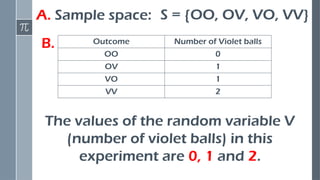
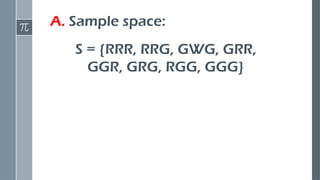
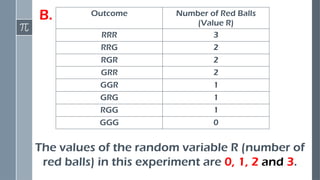
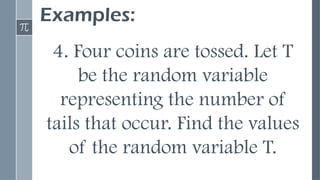
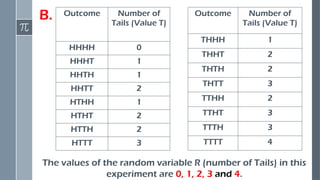
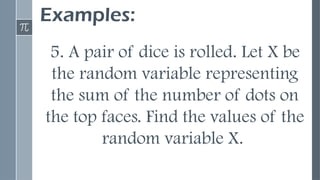
Identify random variables in different situations
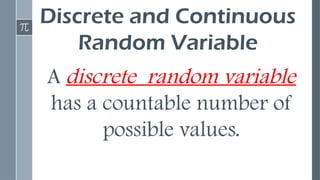
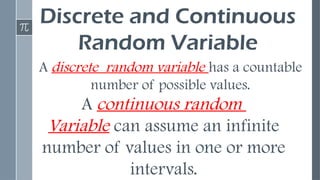
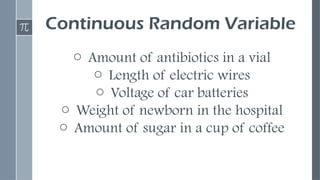
Distinguish between discrete and continuous random variables
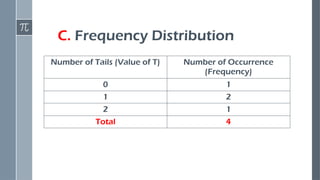
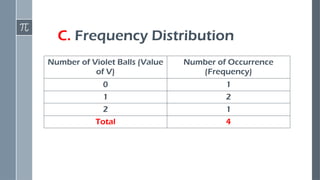
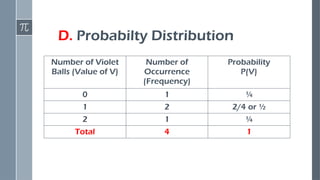
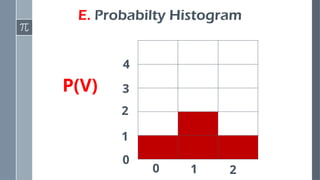
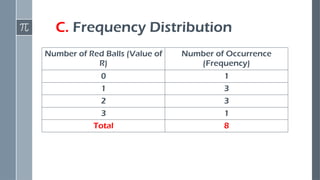
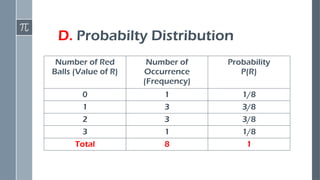
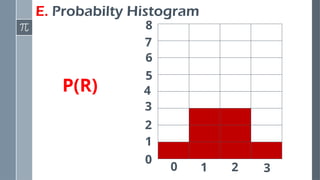
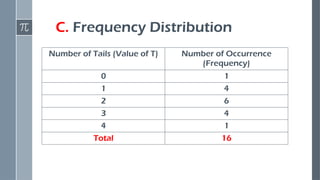
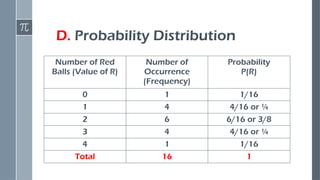
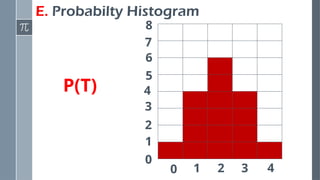
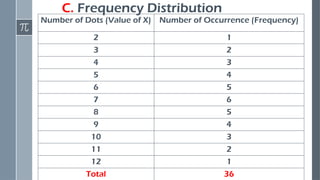
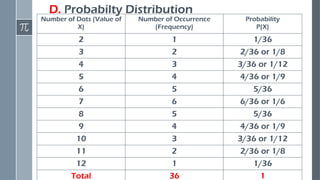
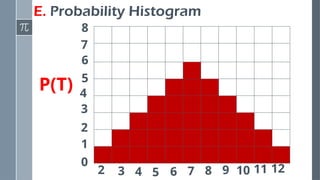
Construct probability distributions
Compute the mean (expected value) of a discrete random variable
By the end of this lesson, learners will understand how random variables help us measure uncertainty and make informed decisions using probability.
If you want, I can also create:
A shorter version (for title slide only)
A more detailed academic version
Or a student-friendly version written in simpler language 😊