Download to read offline
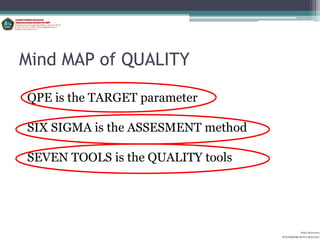
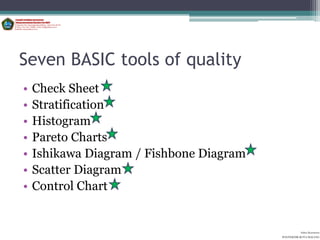
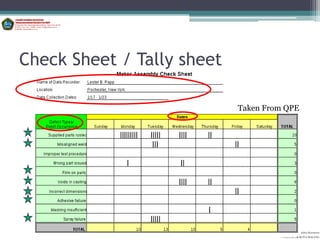
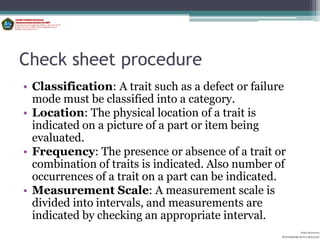
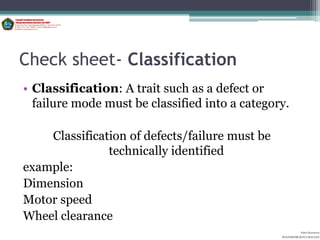
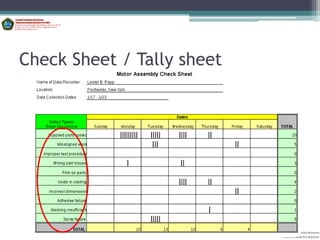
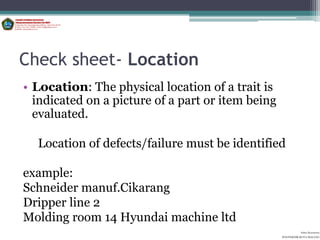
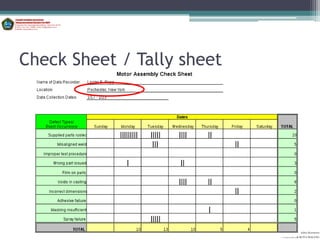
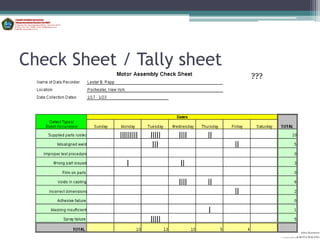
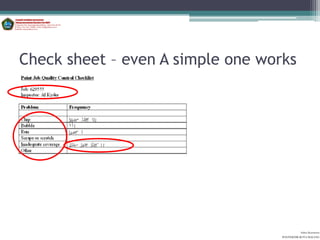
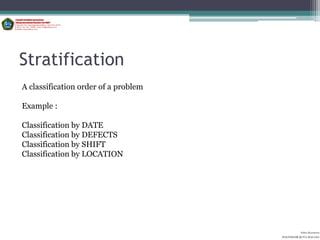
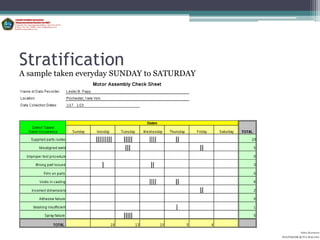
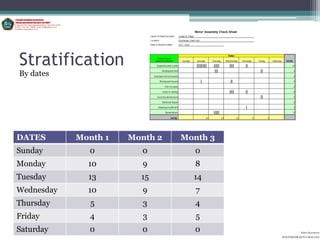
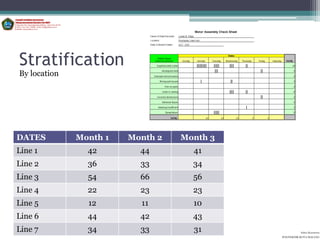
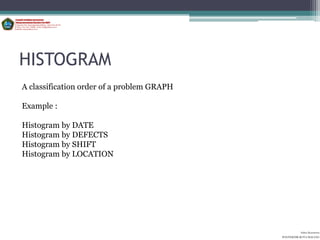
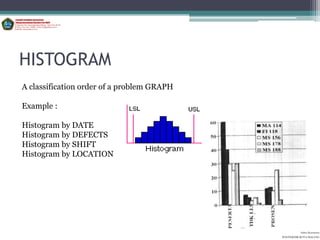
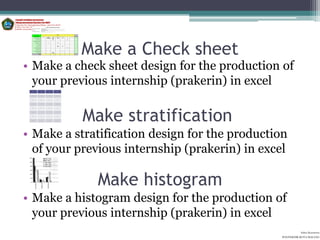
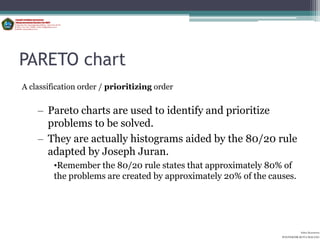
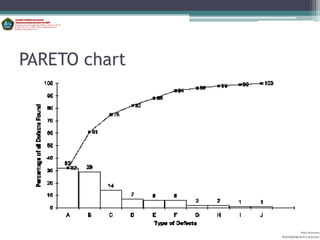
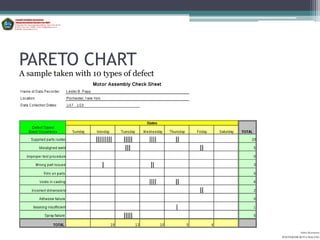
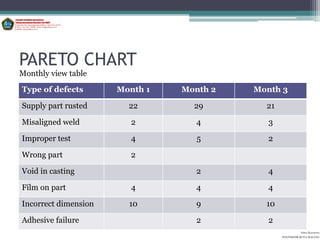
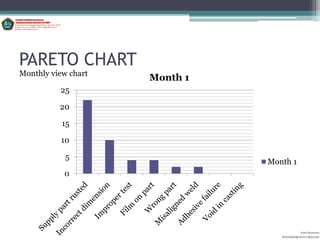
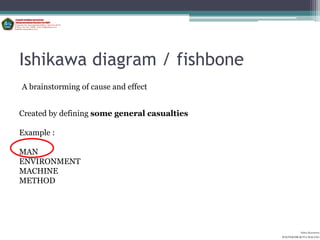
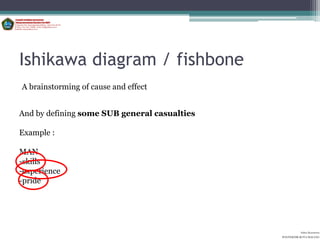
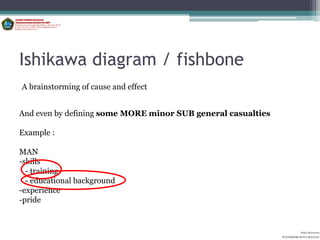
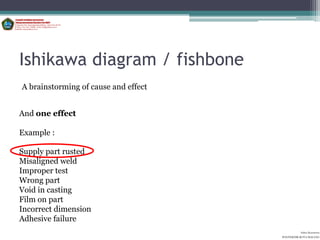
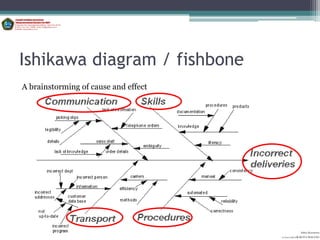
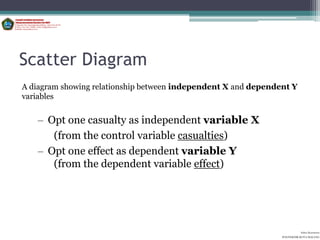
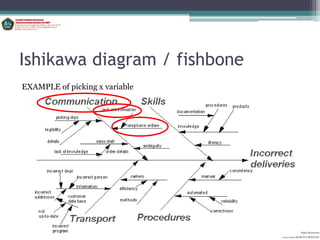
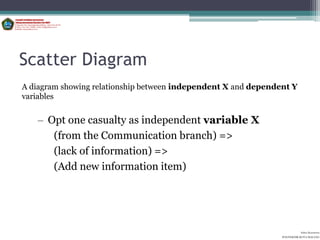
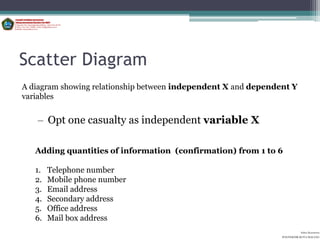
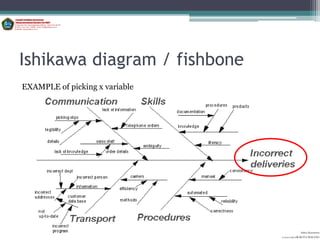
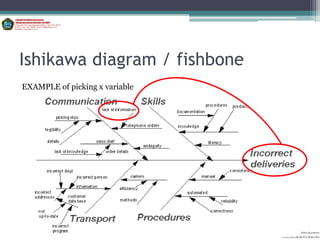
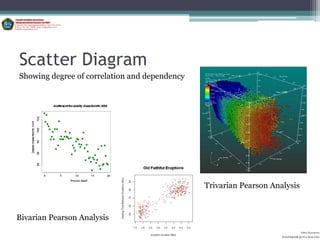
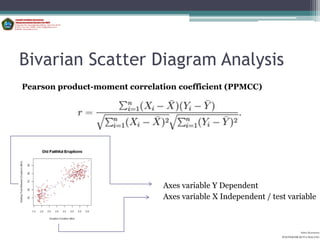
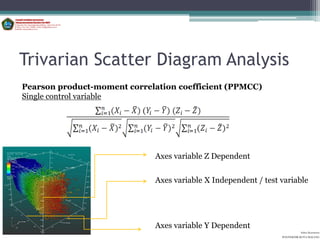
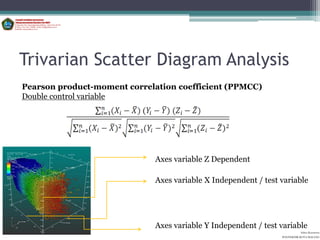
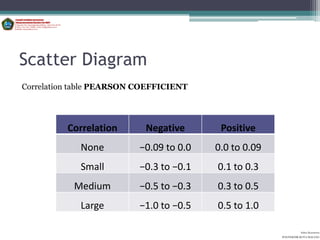


The document discusses seven basic quality tools: check sheets, stratification, histograms, Pareto charts, Ishikawa diagrams, scatter diagrams, and control charts. It provides examples and explanations of how to implement each tool, including how to classify data, indicate locations and frequencies, and analyze relationships between variables. Check sheets involve tallying traits, stratification organizes data into classifications, histograms and Pareto charts display distributions graphically, and scatter diagrams and control charts assess correlations. Ishikawa diagrams map potential causes for effects through a cause-and-effect tree structure.


![Cip frequently asked_questions_and_student_commentsx[1]](https://cdn.slidesharecdn.com/ss_thumbnails/cipfrequentlyaskedquestionsandstudentcommentsx1-120720072008-phpapp01-thumbnail.jpg?width=640&height=640&fit=bounds)


![X discourse%20analysis%201213[1]](https://cdn.slidesharecdn.com/ss_thumbnails/xdiscourse20analysis2012131-120726052739-phpapp01-thumbnail.jpg?width=640&height=640&fit=bounds)


