2. countries (WHO, 2013, p. 2). As such, studying the quality aspects of
water services will contribute in achieving this objective.
Accordingly, this article investigates the quality dimensions of
piped water supply in Abuja city, Nigeria, and suggests some means
for improvement. This paper is important since Abuja was estab-
lished to avoid some of Lagos' problems, including inadequate and
dilapidated water supply. Abuja is also the most rapidly growing
city in Africa (Myers, 2011) and water supply is among the huge
challenges currently facing the city (Abubakar, 2014).
Previous studies on water supply in Abuja by Ojo (2011) and FCT
MDG Office (2010) have surveyed citizens' satisfaction with water
service regularity, pressure, and color features, without including
officials involved in the city's water supply. Other crucial water-
delivery issues not addressed in these studies include infrastruc-
ture maintenance, customer services, and community engagement.
Further, these studies have only scratched the surface of water
quality attributes by describing their incidence or prevalence
without providing in-depth understanding of the context and na-
ture of the water quality issues. The present study contributes in
addressing these limitations. The next section reviews concepts of
public-sector water delivery and the quantity and quality di-
mensions of water services. The paper then describes the research
methodology, which is followed by the findings and discussion, and
concludes with recommendations for the way forward.
2. Literature review
2.1. Delivery of public water services in developing countries
Werna (2000) defines the delivery of urban services as the act of
ensuring service availability, including decisions about the quan-
tities and qualities to be delivered to end users. Drinking water is
considered and treated as an economic good that can be sold for a
non-negative price (Garcia, 2005), a merit good or human right that
everyone should have access to regardless of ability to pay
(UNDESA, 2010), and as simultaneously an economic good and
human right (Gleick, 1998). Water provision consists of infra-
structure financing and development, system operation, billing and
tariff collection, and system management and maintenance. Public-
sector delivery is generally favored over private-sector delivery for
reasons that include high infrastructure costs, the desire to avoid
exclusive service and exploitative pricing, and the notion that un-
regulated markets would under-supply basic services that confer
societal benefit (Thoenen, 2007). As such, water is produced and
distributed mainly through government monopolies, which ac-
count for more than 90% of the world's water services (Hoedeman
et al., 2005). Monopoly is also said to be more cost effective due to
the advantages of scale economies and duplication avoidance.
In developing countries, the public sector is overwhelmed by
rapid urbanization, handicapped by limited resources and hindered
by inadequate management and technical capacity to effectively
maintain and operate urban water systems. During the Interna-
tional Decade for Clean Drinking Water (1981e1990), international
financial institutions provided substantial loans and aid to devel-
oping countries in order to improve water supply, especially in the
rapidly growing urban centers (Jaglin, 2002). Later, at the turn of
the century, world leaders adopted the Millennium Development
Goals (MDGs), including Target 10 that aimed to cut in half the
proportion of people without access to safe drinking water. By the
end of 2010, the target was met and in the same year, the UN
General Assembly passed a resolution that formally acknowledges
water as a human right. The United Nations Development Pro-
gramme (UNDP) defines the right to water as “the right of everyone
to sufficient, safe, acceptable and physically accessible and afford-
able water for personal and domestic uses” (UN, 2010, p.1). As such,
the current debate on water supply in developing countries focuses
not only on water coverage but also on the quality of water services.
The next section comparatively analyzes these two dimensions.
2.2. Quantity and quality dimensions of water delivery system
Urban water services are jointly produced and delivered at large
scale through networks that are geographically distributed within a
community. Thus, we need to ascertain both the quantity and
quality of service delivery. The quantity dimension of water de-
livery refers to coverage, which is usually the proportion of the
population having access to drinking water. However, the definition
of accessibility varies from one country to another and from (inter)
national to local levels. According to the WHO, access to safe
drinking water means having an improved source of water within
1 km of a home or within a walking distance of not exceeding
30 min (WHO, 2011). The improved water sources include a
household piped connection, public standpipe, borehole, protected
well or spring, and neatly collected rainwater (WHO/UNICEF, 2014).
Though coverage allows local and international comparison of
cities, regions, and countries and is easy to measure using tools
such as household surveys and spatial analyses, the concept in-
dicates little about service quality beyond what is meant by “ac-
cess” and “improved” source.
The quality dimension of water services has varying conceptu-
alizations since quality can be an abstract and elusive construct.
While quality is often considered an indicator of how well water
services meet user expectations (Parasuraman et al., 1994), to
others, quality connotes the difference between customer expec-
tations and perceptions of the services actually provided (Kendall,
2006). Although methods for measuring water quality vary across
different organizations and settings, an increasing number of
studies rely on customer satisfaction surveys that consider different
water quality attributes.
Measures of water pressure and purity have also been used to
assess water quality (Bell et al., 1993). Pressure, according to the
authors, is that which is adequate to deliver water to the household
throughout the day. Purity encompasses safety from both acute and
chronic health risks, along with general public confidence that the
water is safe for drinking, as well as observable measures of
aesthetic appeal (odor, taste, and appearance, including visible color
and/or solids). A shortcoming of this conceptualization of water
quality is the focus on the delivered commodity and not on the
quality of the entire delivery system. It fails to capture issues such as
water facility maintenance, customer services, and billing practices.
Some studies have identified multiple dimensions of water
service for use in evaluation. A measure developed by Lin (2005)
consists of four variables: water purity (based on chlorine con-
tent); service coverage; service continuity; and the difference be-
tween water produced and sold (losses resulting from inefficient
billing, illegal connections, or leakage). A comprehensive measure
of service quality developed by Parasuraman et al. (1994) includes
five attributes: Reliability, Assurance, Tangibles, Empathy, and
Responsiveness. Reliability refers the ability to provide water
continuously and with the quality and the quantity required;
assurance denotes the knowledge and courtesy of water utility
employees and their ability to inspire trust and confidence; tangi-
bles are the physical characteristics of delivered water, including
pressure, odor, taste, and color; empathy is the care and individu-
alized attention provided to users with respect to issues like
maintenance services; and responsiveness refers to the willingness
to provide prompt customer services and accurate billing
(Humplick et al., 1992).
In the present study, the quality of water service is evaluated
using measures of reliability (continuity of supply), purity (odor,
I.R. Abubakar / Utilities Policy 38 (2016) 43e5144
3. taste, and color), pressure, metering and billing, maintenance, eq-
uity (variability of reliability, purity, and pressure in different parts
of the city), and community engagement in service delivery. These
selected attributes are in accordance with those specified in the
United Nation's Water for Life Decade (UNDESA, 2010) and each
plays a role in the overall efficacy of water service delivery.
3. Methodology
3.1. Study area
Abuja officially replaced Lagos as Nigeria's capital in December
1991 because of latter's several urban problems, including inade-
quate and dilapidated infrastructure, urban blight and over-
crowding, that had made it unsuitable as the Federal Capital City.
Since then, Abuja has experienced an influx of people in search of
perceived economic opportunities and city life (Abubakar, 2014).
The population of Abuja city has been estimated at more than 3
million and its unprecedented population growth of 8.2% per
annum makes it the fastest growing city in Africa (Myers, 2011).
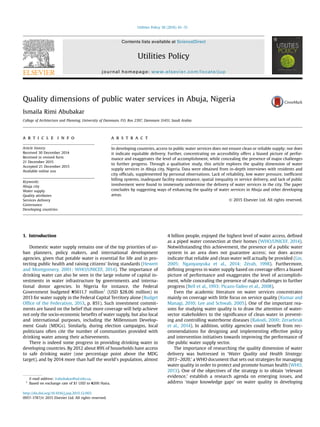
The development of city is the product of the Abuja Master Plan,
implemented in four spatially defined phases to ensure efficient
growth management and service delivery (Fig. 1). Phase I is com-
plete and encompasses the central area that is home to the federal
government establishments (presidential villa, house of assembly,
judiciary, and ministries), the central business district, offices of
international agencies, foreign embassies, and headquarters of
several business corporations. This area also contains the residen-
tial districts of Maitama, Asokoro, Wuse I II, Garki I II, and
Guzape, which are located around the central area. The three other
phases radiate outward from the center in a crescent-shaped urban
form. Phases II and III are yet to be fully developed, while Phase IV
has been earmarked for a siting and services scheme via public-
private partnership. The development and management of Abuja
city is the responsibility of Federal Capital Territory Administration
(FCTA).
The Master Plan proposed “adequate” piped water supply to all
parts of the city (IPA, 1979, p. 117). Though informal water vendors
operate in Abuja's suburbs and satellite settlements, public mo-
nopoly is the mode of delivering drinking water in the city. Abuja
Water Board, a public agency under the FCTA, meets the costs of
water infrastructure and maintenance and service delivery from
the federal government's budgetary allocation, revenues from user
fees and international aid. However, the agency has recently faced
increasing challenges to provide adequate and clean water to the
rapidly growing population of the city.
3.2. Data collection and analysis
This study employs qualitative in-depth interviews and direct
observation to explore quality dimensions of public water services
in Abuja. This research approach was adopted since water supply is
a contemporary event, hence does not lend itself to experimental
methods. Cross verification of data from multiple sources (trian-
gulation) is a well-known technique for enhancing the reliability
and validity of information (Yin, 2003). Between 2013 and 2015, the
author interviewed 85 residents and 30 city officials working in the
Abuja Water Board (18) and the FCTA engineering department (12),
all of whom are directly involved in the city's water supply. This
exceeds the number of interviews (30e45) considered adequate for
a qualitative study (Marshall et al., 2013).
Residents were nonrandomly sampled from fourteen residential
districts that city officials rated as facing water supply problems
(Table 1). A literature review and the author's long experience with
the city during the review of Abuja Master Plan further supported
the selection process. Key informants and snowball techniques
were used for sampling the interviewees after setting three eligi-
bility criteria for participation in the study: the subjects must (a) be
adults; (b) have a piped water connection at home; and (c) have
occupied their current residence for at least three years. Since long-
Fig. 1. Four phases of Abuja's development and the inhabited districts (Source: Author).
I.R. Abubakar / Utilities Policy 38 (2016) 43e51 45
4. term living experience provides rich and diverse perspectives on
the quality of water services, key informants who have lived in the
selected districts for at least 10 years were actively recruited.
Twenty-six informants originally agreed to participate but 18
eventually participated because the rest could not be contacted or
missed their appointments. Through a snowball technique (Noy,
2008), after each of the informants was interviewed, they were
asked to recommend potential subjects who were in turn inter-
viewed and asked to recommend others until no new information
emanated from the interviews.
The interviews were semi-structured and lasted 20e58 min.
Interview sessions begun by introducing the author and purpose of
the research and then by a ‘grand tour’ question about participants'
experience with water services: “Can you recall a situation in which
you experienced a problem with the water supply to your home? You
can think about it for a minute, and when you're ready, go ahead and
tell me what happened.” The subsequent questions explored their
perceptions of the different attributes of the water delivery system,
including reliability, purity (odor, taste, and color), billing, and
maintenance as well as their opinion on the causes and resolution
of any experienced problems. Follow-up questions were used to
clarify points and collect more details on previous answers. Re-
spondents' anonymity and confidentiality was guaranteed and all
signed informed consent for voluntary participation in the study
and for recording the interviews.
The second source of evidence entails field observation of
problems related to water services and the condition of water fa-
cilities and infrastructure. Observations were noted or photo-
graphed. Lastly, for further documentation, secondary data from
various sources were collected and reviewed. The most important
use of secondary resources is to triangulate the findings from the
primary data (Yin, 2003).
All interviews were fully transcribed into text files and analyzed
using grounded analyses. First the transcribed texts were coded
into themes and patterns related to the water quality attributes. The
key themes were summarized and synthesized with the findings
from observations and secondary sources, and conclusions were
drawn from the combined data (Corbin and Strauss, 2008).
3.3. General characteristics of interview participants
Table 1 indicates that there were more males (62%) than females
(38%) among the interviewees and their length of residency ranged
from 3 to 28 years with an average of about 10 years. The sample
consists of 32 (45%) households living in Phase II (45%), 28 (33%)
living in Phase III, and 25 (29%) living in Phase I of the city.
Based on the analysis of interview transcripts, there is no
apparent distinction between males and female respondents' per-
ceptions about water supply quality. But length of stay, which
provides for some inter-temporal comparison, reflects the richness
of respondents' experience and indicates their capacity to evaluate
service performance (Percy, 1986). Also, respondents' length of
residency, as expected, corresponds generally with the age of the
residential districts in Abuja.
4. Quality dimensions of public water services in Abuja
This study uncovers seven quality problems with water services
in Abuja: water scarcity, low water purity and pressure, inefficient
metering and billing systems, poor infrastructure maintenance,
inequality in services delivery, and lack of community engagement.
Table 2 shows how many residents reported facing each of the
problems at the time of the interviews. The following section dis-
cusses the nature of these problems, possible causes, and effects on
users.
4.1. Water scarcity
Although reliability is an important feature of urban water
supply, Abuja experiences outages lasting several hours or days. In
this study, 74 participants (87.1%) have faced this problem, which is
higher than the official figure indicating that 40% of the households
in Abuja Municipal Area have “regular” water supply (FCT MDG,
2010). The erratic nature of water supply in the city has also been
reported in a survey, where only 27% of households indicated
getting water supply daily while the rest were supplied every other
day, twice a week, or even less frequently (Ojo, 2011, p. 114). Per-
sonal observation also corroborates the severity of this problem.
According to interviewed officials, the demand for water in Abuja,
as in most Nigerian cities, cannot be met by the available supply, a
situation exacerbated by rising demand associated with continuous
migration into the city. Since the outages seldom affect the whole
city, residents and vendors can fetch water from the more elite
districts in Phase I that rarely lack water.
Water outages are largely caused by faulty pumps, periodic
“engineering work” at the city's water treatment plant, and pipe
bursts during road construction in new districts, which signals lack
of coordination between the utility agency and the transport
secretariat responsible for roads construction and maintenance.
Other reasons are shortage of chemicals and fuel required for water
provision, caused by low budgetary allocations and failure of users
to pay their bills, especially the political and economic elites. As a
result, the utility agency introduced a rationing system, which is
more stringent in the dry season:
“Mostly between the month of March and early June, we used to
experience acute water scarcity and authorities of Abuja Water
Board usually explain in radio, television and newspapers that
Table 1
Distribution of interviewed residents by districts, gender and tenure.
District Male (53) Female (32) Mean length of residency (years)
Phase I 16 9 12
Asokoro 4 2 10
Garki 5 4 14
Wuse 6 2 12
Maitama 1 1 15
Phase II 22 10 7
Jabi 4 2 5
Kado 3 4 9
Gaduwa 3 1 5
Utako 7 2 6
Gudu 3 1 8
Duboyi 2 0 7
Phase III 17 11 10
Life Camp 6 4 12
Gwarimpa 5 3 5
Lokogoma 3 3 6
Nbora 3 1 4
Table 2
Water supply problems identified by respondents in Abuja city.
Water supply problems Respondents (n ¼ 85) Percent
1 Water scarcity 74 87.1
2 Dirty water 28 32.9
3 Low water pressure 33 38.8
4 Inefficient metering and billing systems 56 65.9
5 Poor infrastructure maintenance 49 57.6
6 Spatial inequality in services delivery 57 67.1
7 Lack of community engagement 79 92.9
I.R. Abubakar / Utilities Policy 38 (2016) 43e5146
5. due to low water level in the dam we are going to face water
scarcity”
Consequences of water scarcity are pervasive and consequential,
as many respondents complained of the loss of labor productivity
and household income due to the need to purchase water from
vendors or fetch water from other districts. Another cost is the
possible infiltration of pollutants into the supply system with dire
health outcomes (Howe et al., 1994). Since water supply is an
indication of sanitary conditions, increased water access has been
identified as a major contributing factor to the declining incidence
of water-borne diseases.
4.2. Dirty water
About one third of participants (28) reported experiencing the
problem of occasional dirty water. This problem results mainly
from corrosive pipes, prolonged outages, or infiltration of con-
taminants as a result of pipe bursts. As such, most residents are
unsure if the tap water is fit for drinking:
“Many times the color is not okay; clean water should actually
be colorless and odorless but sometimes if you turn on the tap
you cannot even bath with it because the color of the water is
milky-brown so we just use it strictly for washing plates; we do
not consume that one”
“When we first came here we used to boast that the water that
we drink from the tap is better than the Swan [bottled] water.
But right now things have changed: like introduction of color
and smell. Definitely something is wrong somewhere, may be
because of sewer leakage or manhole somewhere. But definitely
there is a problem with the water quality”.
The interviewed city officials were unaware of any existing ef-
forts to monitor the quality of drinking water in the city. This is
despite the importance of monitoring and assessing the chemical
and physical features of drinking water, since diseases resulting
from unclean drinking water constitute a major burden on human
health (Alhassan and Ujoh, 2012; WHO, 2011). In an attempt to
mitigate the problem of dirty water, residents filter or boil their
water, or add alum or a chemical called ‘water guard’ to the water
before drinking because, “we don't want to contract typhoid”.
4.3. Low water pressure
Low water pressure is becoming an increasing problem in high-
rise apartments, hilly areas of Maitama and Asokoro districts, and
high-density areas such as Garki, Gudu and Gwarimpa districts.
One of the 33 residents (39%) who reported this problem laments
that, “the pressure will be so low to the extent that you cannot fill a
bucket within 1 h” This problem buckles sanitation system when
water could not be used for bathing or flushing toilets. Another
resident from Garki District narrates that:
“I live in a high-rise and the pressure of the water couldn't go up.
So you find a situation where by you have water downstairs but
the first and second floors have no water and you have to wait
till night to collect water in containers.”
Upper-floor residents affected by low pressure must fetch water
from neighbors on the ground floor, wait until a time when most
people are at work, or use booster machines to “push water” up-
ward or into storage tanks. The low-pressure problem has also been
reported in a 2011 survey of Abuja residents, where 20% of re-
spondents were “dissatisfied” or “very dissatisfied” with water
pressure (Ojo, 2011, p. 162). According to interviewed city officials,
reasons for low water pressure include pipe bursts, lack of power at
the pumping stations, and the small size of the main distribution
pipes (at 25 mm in diameter), caused by underestimating Abuja's
future population growth when designing the water network. Thus,
despite the elite vision of a modern capital city (Abubakar, 2014),
low water pressure and water scarcity in Abuja make conditions
not different from that of other cities in Asia and Africa (McIntosh,
2003).
4.4. Inefficient Metering and billing systems
Efficient metering and billing allows customers to influence
their water bills and provides utility agencies with improved rev-
enue generation, which is required for better operation of water
systems. However, all the interviewed officials and about two-third
of residents (56) indicated that lack of accurate customer database,
metering and billing problems, and tedious method of bill payment
were the major obstacles affecting the system in Abuja. One study
found that only about one third (34.2%) of surveyed households in
the city were metered (Ojo, 2011, p.342). Lack of meters, caused
chiefly by inadequate budgetary allocation, compels the agency to
charge a flat monthly rate of ₦4000 e ₦6000 (USD $20e30) per
household, depending on the estimated household size or number
of rooms.
For metered customers, the tariff for residential areas in the city
is ₦80 (USD $0.40) for 1000 L (Leadership Newspaper, 2014; March
30), compared with the national average of ₦50 in 2006 (Hall, 2006,
p. 6). Accordingly, based on the city's projected water consumption
rate of 265 L per person per day (IPA, 1979, p. 183), the monthly bill
for a household of five persons (the average household size in
Nigeria) is ₦3180 or USD $16. Thus the average monthly tariff for a
metered household is less than the lowest flat rate of ₦4000, and
could even lower if water consumption is less than the generously
estimated consumption rate. Thus, some interviewees describe the
flat-rate billing system as “unfair”:
“They decide on how much they want to charge. It is a
monopolistic product; we don't have option than to patronize
their water supply. So you don't have option but to pay whatever
they bring to you”.
Several residents who use the metered system (except in the
case of pre-paid meters that only supply the amount of water the
consumer has already paid for) allege that the agency just uses
estimates instead of reading meters. Agency officials maintain that
estimated billing is used only when they cannot access customer
premises to take readings. Another issue is meter sharing by many
apartments, which can cause dispute among households during bill
payment and repairs:
“Like in my compound, we have about 18 flats and we have one
meter. So everybody contributes and that is how we pay the
bills”.
Another issue is billing discrepancies. One resident was billed
₦5000 (USD $25) in one month and the bill soared to ₦20,000 (USD
$100) in the subsequent month. In some instances, residences were
classified as commercial buildings, resulting in higher bills, dis-
putes, and eventual disconnections. In many cases, disconnections
are reportedly undertaken without notifying residents and pipes
can be taken away by utility officials. There are also reported
I.R. Abubakar / Utilities Policy 38 (2016) 43e51 47
6. incidences of households who “buy drinks” for the utility officials to
spare them from disconnection.
The cumbersome payment system entails “leaving places of work
to queue and struggle” to make the payments at few designated
banks, which often are not reflected in the agency's account for
several months. Thus, the agency sometimes assumes that the bills
have not been paid and the consequence is that: “when you are not
lucky to be around the house when they [water board staff] come and
demand the evidence of payments they can just cut off the water and
go.”
In some incidents, disconnections are due to unpaid water bills
accumulated by previous renters. As a result, the new homeowner
or tenant could not get water supply reconnected until the incurred
debt was paid, since the utility agency, “does not care, the bill is in
the name [address] of the house, not its occupant”. According to one
survey, reasons for non-payment of water bills in Abuja were debts
inherited from previous tenants (61%), disputed amounts (17%),
irregular water supply (9%), and other reasons (13%) (Ojo, 2011, p.
149).
4.5. Poor infrastructure maintenance
According to interviewed officials and 49 residents (58%), water
supply infrastructure in Abuja is poorly maintained. Responses
indicated that even though majority of houses in Phases I and II
have been built for more than 30 years, the original steel pipes are
still being used. There is also no strategy for identifying leakages
and controlling water and associated revenue losses. Pipe bursts
due to corrosion leads to problems of reliability, low pressure, and
contamination:
“Most of the pipes are rusted and I learnt that both the water
and sewer lines were laid at the same place and the sewer line
was above the water line that is what they [Water Board staff]
explained. So when the pipes got rusted the water started
mixing together with sewage. We were even drinking it like that
without knowing until it [the smell] became so much.”
Lack of routine infrastructure maintenance, illegal water con-
nections, breaking of pipes to steal water, users' mishandling of the
infrastructure, and failure to report problems in a timely manner
largely contribute to water infrastructure breakdown in the study
area. Respondents indicated that lack of required equipment
including work kits and gears, replacement parts, and operating
vehicles, poor staff welfare (lack of promotion and overtime
allowance), and inadequate technical capacity of the maintenance
staff were among the major impediments to water infrastructure
maintenance in Abuja.
4.6. Spatial inequality in water services delivery
There was consensus among most residents (67%) and city of-
ficials that water supply is more reliable in the central city than in
the peri-urban districts of Abuja. While water supply is much more
regular in the elite Phase I area and the Life Camp district, where
the FCT minister resides, the suburbs and satellite areas are sup-
plied with water for about 2e3 days per week or less and only for a
few hours. This spatial inequality is even more severe during water
rationing periods, and especially in the dry season. Similarly, unlike
in the suburbs, there is prompt maintenance of water services by
the utility agency in the central parts of Abuja.
This finding corroborates a survey finding that 63% of re-
spondents living in the outskirts of Abuja are satisfied with the
quality of their water services, in contrast to 71% for those residing
in Phase I, which is a low to medium density area (Ojo, 2011).
Similarly, spatial phasing was reported to be significantly associ-
ated with user ratings of water service in Abuja (p 0.01), where
92% of surveyed respondents in Phase I (central city) rated the
overall provision of piped water as either “good” or “very good”
compared with 49.7% in Phase II (Abubakar, 2011).
Distributional inequity of urban services in Abuja and other
cities in developing countries results mainly from the discretionary
power of senior bureaucrats who decide how frequently each sec-
tion of a city gets water, thereby favoring elite areas to the detri-
ment of peri-urban and poor-dominated areas (Werna, 2000;
WHO/UNICEF, 2014). In short, inequality in water supply contra-
dicts the provision in the Abuja Master Plan that proposed equal
distribution of urban services to all residents of the “neutral” city
(IPA, 1979, p. 117).
4.7. Lack of community engagement in water services delivery
Community engagement is considered vital for improving the
performance of the water sector and achieving the MDGs for water.
Nonetheless, 79 interviewed residents (93%) indicated that they
have not been engaged in any decision-making regarding infra-
structure development, operating the water system, designing the
billing and tariffs system, or managing and maintaining the system.
They indicate that the city only informs them about proposed water
infrastructure projects or water rationing schedules via television
and print media. They added that even the decision to raise the
water tariff was made without their input.
Lack of community engagement can affect service performance
when citizens have limited understanding of functions and re-
sponsibilities of the utility agency. Active community engagement
is a key element of sustainable drinking water supply. Engagement
can help identify community needs, grievances and ways of
addressing them, as well as the roles communities can play in
improving water supply. It can also enhance customer services,
encourage citizens to report water supply faults, and can shape
water governance by fostering accountability and transparency.
However, effective engagement needs institutional and community
commitment, removal of communication barriers, and citizens to
collectively participate (as organizations, pressure groups and
women societies), given the diversity of people and their interests.
5. Discussion and recommendations
Similar to many cities in developing countries, Abuja has
experienced substantial population growth that is overwhelming
the provision of adequate and safe drinking water to city residents.
To meet this challenge, the city is heavily investing in water infra-
structure, including an ongoing ₦18.09 billion (USD $90 million)
project for water treatment plant expansion (FCTA News, 2014,
April 15). These are laudable projects for not only reducing water
scarcity, but also for expanding coverage to unserved areas.2
Even
though operating statistics from the agency are not available,
household access to improved drinking water in the FCT has
increased from 65.0% in 2008 to 73.3% in 2013, when the national
average was 60.6% (NPC, 2014 p. 369). Although the vision of the
Abuja Water Board is to be a “world class utility which is consistent
in excellent service delivery and uncompromising in the quality of
its product - potable water” (FCTWB, n.d.), and a senior city official
claims that water supply in Abuja is “one of the best in Africa”, this
study has shown that the quality of water supply is far from what
the city administration portrays.
2
A household survey conducted in 2009 revealed that only about 34% of
households in the FCT have access to portable water (FCTA MDG Office, 2010).
I.R. Abubakar / Utilities Policy 38 (2016) 43e5148
7. City officials need to pay more attention to the quality of water
services because as Hall (2006) pointed out, water supply systems
in Nigeria's cities are unreliable and under-developed, which has
contributed substantially to lowering the quality of life and well-
being of average Nigerians. Accordingly, the following recommen-
dations could help improve the quality of water services in Abuja
and similar cities in developing countries.
5.1. More emphasis on the quality of water services
Three areas are vital for improving the quality and safety of
drinking water: performance monitoring and evaluation, infra-
structure operation and maintenance, and billing and revenue-
collection systems.
5.1.1. Performance monitoring and evaluation
An immediate recommendation to Abuja Water Board is to
conduct technical and financial assessments of the water utility,
preferably by an independent expert evaluator. A comprehensive
audit would shed light on how well the utility is performing and
identify areas for improvement. In addition, annual performance
monitoring based on key indicators is a highly recommended
practice internationally as trends in various dimensions of perfor-
mance will help the executive manage the utility agency more
effectively (via informed policy and planning) as well as protect
customer interests. Results of annual performance monitoring
should be published, and could be used for benchmarking and
comparison with similar cities. Some essential and feasible per-
formance indicators for water systems monitoring include:
Water supply e percentage of water chlorinated (to ascertain
whether water safety meets basic health standards); average
daily number of hours of continuous water supply for each
district; per-capita water production (as sufficient water is
critical for hydration, food preparation and hygiene); percentage
of water pressure tests meeting acceptable standards.
Operation e number of workers per 1000 connections; opera-
tional costs per 1000 connections; total operating cost per cubic
meter of water produced and sold.
Metering and billing e percentage of billed revenue collected per
total number of bills rendered; percentage of connections with
functioning meters; percentage of bills containing errors per
total number of bills rendered; percentage reduction in non-
revenue water over time.
Customer services e total complaints received and responses to
inquiries per 1000 customers; number of public outreach and
awareness events executed; average customer satisfaction rat-
ings (e.g. scale 1e5, ranging from very bad to very good) for
different attributes of water quality based on customer surveys.
Maintenance e number and length of renovation projects and
repairs carried out; frequency of infrastructure inspection or
total area surveyed for pipe bursts; average time taken to fix
pipe bursts and leaks.
Staff training and welfare e percentage of personnel receiving
training; percentage of personnel without work kits and gears;
percentage of personnel promoted; owed allowances for haz-
ardous work and overtime.
5.1.2. Infrastructure operation and maintenance
Another need is for a plan of action for incremental improve-
ment towards long-term water quality targets. This could include
adopting the WHO's guidelines for drinking-water quality (WHO,
2011). Improvements to infrastructure operation and mainte-
nance could include:
A laboratory test of water samples (biological, chemical, and
other components) is an essential and immediate recommen-
dation for ensuring water safety.
Routine infrastructure inspection and maintenance and prompt
repairs of bursts are required to minimize water leakages and
prevent contamination.
A long term recommendation is to replace the steel pipes that
easily become rusty with PVC pipes (WHO/UNICEF, 2014) and
install larger pipes to address the issue of unanticipated rising
water demand in the city.
5.1.3. Billing and revenue-collection systems
Although, the utility agency meets “most” of its operating costs
through internally generated revenue, while capital projects are
financed by the federal government through loans, and interna-
tional donors (FCTWB, n.d.), improved water billing and revenue
collection could enhance the utility's financial sustainability and
capacity to improve service quality. In Cote d'Ivoire, for instance,
more than 3 million households have gained access to piped water
since 1990, entirely financed through tariff revenues and without
any public funding (Marin, 2009).
Based on the author's experience, residents of Abuja are like
those of many cities in developing countries and would rather pay
higher tariffs than have to access water from more expensive
sources (like vendors and distant areas) or store water in tanks and
containers. Indeed, one survey found that 21% of respondents in
Abuja are willing to pay more for improved water quality (Ojo, 2011,
p. 239). However, an important caveat is that any tariff increase
must translate into better services as people resent paying for poor
services.
On the issue of tariffs, the agency should shift from flat rates to
more equitable water pricing. Installing meters is a way to improve
revenue collection and provide households with incentives to
conserve water. Pre-paid meters not only prevent the problem of
bill-payment default, but they also save the agency from meter
reading and disconnection costs. Bill payment could also be
improved by using an electronic system.
5.2. Good water governance
Water governance is about political, administrative, and socio-
economic decisions-making processes through which societies
manage and govern their water resources and systems (Teisman
and Herman, 2011) and at the core of the World Health Organiza-
tion's agenda for the sector (WHO/UNICEF, 2014). For more effec-
tive provision of water services in developing countries, the
following aspects of water governance should be strengthened.
5.2.1. Institutional efficiency
Institutional efficiency in water governance could be greatly
improved by restructuring the agency from the traditional civil
service style to become more commercially oriented. This could be
achieved through strategic planning that asks, ‘where are we now,
where do we want to be, how might we get there and how do we
ensure success’ (Mugabi et al., 2007). Recommendations for pro-
moting institutional efficiency include:
Providing staff with required maintenance equipment and parts,
operational vehicles, and protective gears (uniforms, boots, and
helmets) would improve operational efficacy.
Strengthening transparency and holding the staff and decision-
makers accountable would lead to more efficient management
of public resources;
I.R. Abubakar / Utilities Policy 38 (2016) 43e51 49
8. The agency should set and work toward achieving performance
targets, including revenue generation targets for agency staff.
Incentives mechanisms for staff include promotions when due,
allowances for hazardous work and overtime, and bonuses for
meeting performance targets.
Building the capacity of the utility staff through on-the-job
training would enable them to better maintain the water
infrastructure and provide customer services. This is preferable
and less costly than paying foreign engineers for maintenance
and repair works.
5.2.2. Privatization and partnerships
Privatization has been advocated as an alternative to public-
sector provision of services. Although privatization could bring
better efficiency and lessen the financial burden on the state, the
private sector would not necessarily ensure that urban poor have
access to safe drinking water (Dore et al., 2004). Indeed, privati-
zation has been associated with lack of infrastructure investment,
corruption and lack of transparency, restricted competition, tariff
hikes, poor service quality, disputes between the public and private
partners, and difficulty in regulating multinational companies,
leading several instances of ‘remunicipalisation’ of water supply
(Lobina et al., 2014).
Despite these criticisms of privatization, properly designed
public-private partnerships (PPPs) can be effective in improving
labor productivity and bill collection as well as in reducing water
losses and the need for rationing. Many PPPs have succeeded in
establishing, after a few years, a full 24/7 water supply, and some
have been able to reduce water losses to 15% or less (Marin, 2009).
In Argentina, privatization of water services has been associated
with increased access and decreased mortality, and these effects
were largest in the poorest areas (Galiani et al., 2005). Dore et al.
(2004) conclude that a PPP is preferred only if it can produce wa-
ter at lower unit cost, improve the quality of water services, and
operate with less negative externalities.
Since most of the problems undermining the quality of water
supply in Abuja are related to utility operation and management, a
PPP where the private sector is contracted to operate and manage
the system should be considered. A lease arrangement may be
better than a concession in terms of introducing sound commercial
management principles related to financial viability, accountability,
and customer services (Marin, 2009). In Abuja, a partnership in
solid waste management has recorded substantial success
(Abubakar, 2014). However, outright privatization carries signifi-
cant risks, given the nature water as a natural monopoly, and would
require regulatory capacity.
5.3. Stakeholder engagement
Improving water-supply services cannot succeed without a core
focus on the community directly affected by the quality of water
delivery, as part of the social and political dimensions of water
governance. Engaging all stakeholders via the informal and insti-
tutionalized engagement mechanisms underlined below could help
improve the quality of service delivery.
5.3.1. Informal stakeholder engagement
Some informal mechanisms for engaging city residents include
interactive media programs, town hall meetings with experts and
citizens, and customer satisfaction surveys. These are very impor-
tant elements of water governance that should be given immediate
priority because they could: (1) foster citizen's participation; (2)
help the agency address spatial inequity in service delivery; (3)
improve the relationship between customers and the utility
agency; and (4) help the agency evaluate service performance
through direct input from end users (Marin, 2009).
Some studies have shown that citizen involvement in decisions
about budgeting priorities, technology options, and infrastructure
management can significantly improve public water services in
developing countries. In Porto Alegre, Brazil for example, partici-
patory budgeting is one of the democratic reforms that played a key
role in ensuring that 99.5% of the city residents, including those
living in suburban poorer neighborhoods, would gain access to
clean water (Hoedeman et al., 2005).
5.3.2. Institutionalized stakeholder engagement
Immediate formal involvement of residents' associations, civil
societies, NGOs, and donors for collective inclusive and better
decisions-making related to water services is highly recommended.
Stakeholder representatives should sit on the agency's Board of
Directors together with city officials, and have equal voting rights
(Lobina et al., 2014). Formal engagement mechanisms allow a va-
riety of stakeholders to guide decision-making and implementation
while also ensuring institutional transparency and accountability
(OECD, 2015). These stakeholder processes can provide a valuable
non-threatening forum for the interchange of ideas and are also
known to play an important role in developing countries by
encouraging utilities to improve services to the urban poor.
Engaging the local community through both formal and
informal mechanisms would also encourage responsible behaviors
on the part of water consumers, such as treating the water infra-
structure with care, paying bills promptly, reporting faults and
outages, and regarding the water supply system as their own.
6. Conclusion
This paper has shown that the most basic purpose of the water
delivery system in Abuja e providing safe and adequate drinking
water e has been frustrated by water scarcity, poor infrastructure
maintenance, an inefficient billing system, low pressure, and peri-
odic dirty water. Commendably, in the face of these problems, city
administrators are focusing on expanding water network and thus
reducing the number of marginalized communities. Nevertheless,
adequate attention should also be paid to improving water quality,
since being connected to the water network is no guarantee of
service quality and access alone is not a panacea for drinking water
problems.
This research is important because it deepens our understand-
ing of the shortcomings of the public water-supply services in
Abuja based on attributes that are in line with International Decade
for Action “Water for Life” 2005e2015, which emphasizes the
rights of people to: (a) sufficient and continuous water supply for
personal and domestic use, including drinking, food preparation,
and personal sanitation and hygiene; (b) safe water based on local
or international standards, such as the WHO guidelines for
drinking-water quality; and (c) water of acceptable odor, taste, and
color for each personal or domestic use (UNDESA, 2010). Given the
importance of drinking water to the welfare of the city residents,
and the monopolistic nature of water service, this study also rec-
ommends means of improving the quality of water services in
Abuja and similar cities in developing countries.
Future research could explore what societal weights should be
applied with respect to improving service quality for current and
new customers given cost impacts. Another interesting study could
consider the strategies households utilize to cope with problems of
water supply in Abuja. Finally, because wastewater management
has long-term sustainability implications for source-water quality
and ecosystem integrity, future studies should explore the envi-
ronmental sustainability of Abuja's public sewerage system given
I.R. Abubakar / Utilities Policy 38 (2016) 43e5150
9. the leakage of untreated sewage into local streams and rivers
(Abubakar, 2014).
Acknowledgement
The author thanks the study participants and acknowledges the
valuable comments of Prof. Janice A. Beecher, the two anonymous
reviewers and colleagues at the University of Dammam on the draft
manuscript.
References
Abubakar, I.R., 2011. Distributional Patterns of Urban Services in a Modernist City of
Developing Countries: a Case Study of Abuja, Nigeria. Association of the Col-
legiate Schools of Planning 52nd Annual Conference, Salt Lake City Utah.
October 12e16.
Abubakar, I.R., 2014. Abuja city profile. Cities 41, 81e91.
Alhassan, M.M., Ujoh, F., 2012. Assessment of the chemical quality of potable water
sources in Abuja, Nigeria. Br. J. Appl. Sci. Technol. 2 (2), 146e172.
Bell, M.E., Boland, J., Humplick, F., Kudat, A., Madanat, S., Mukherjee, N.I., 1993,
September 1. Reliability of Urban Water Supply in Developing Countries: the
Emperor Has No Clothing. World Bank Research Observer.
Budget Office of the Federation, 2013. 2013 FGN Budget Proposal. http://www.bu
dgetoffice.gov.ng/2013-budget_details/13.%20Summary_FCT.pdf (Accessed:
May 08, 2014).
Corbin, J., Strauss, A., 2008, third ed.. Basics of Qualitative Research: Techniques and
Procedures for Developing Grounded Theory. Sage Publications, Los Angeles.
Dore, M.H., Kushner, J., Zumer, K., 2004. Privatization of water in the UK and
FrancedWhat can we learn? Util. Policy 12 (1), 41e50.
FCT MDG Office, 2010. FCT MDG Baseline: Water and Sanitation. http://www.
mdgfctabuja.net/Baseline10/Water.aspx (Accessed: August 18, 2014).
FCTWB (n.d.). About US. http://fctwb.gov.ng/about-us/(Accessed: May 04, 2015).
Galiani, S., Gertler, P., Schargrodsky, E., 2005. Water for life: the impact of the pri-
vatization of water services on child mortality. J. Political Econ. 113 (1), 83e120.
Garcia, L.E., 2005. Water pricing: an outsider's perspective. Int. J. Water Resour. Dev.
21 (1), 9e17.
Gleick, P.H., 1998. The human right to water. Water Policy 1 (5), 487e503.
Hall, D., 2006. Water and Electricity in Nigeria (PSIRU Reports).
Hewett, P.C., Montgomery, M.R., 2001. Poverty and Public Services in Developing-
country Cities. Policy Research Division Working Paper, 154. The Population
Council, New York.
Hoedeman, O., Kishimoto, S., Terhorst, P., 2005. Public water Services: reversing the
tide against public water utilities. Water Wastewater Int. 20 (3) (May).
Howe, C.W., Smith, M.G., Bennett, L., Brendecke, C.M., Flack, J.E., Hamm, R.M.,
Wunderlich, K., 1994. The value of water supply reliability in urban water
systems. J. Environ. Econ. Manag. 26 (1), 19e30.
Humplick, F., Kudat, A., Madanat, S., 1992. Household Response to Reliability of
Water Supply: the Case of Istanbul, Turkey. Policy Planning and Research, World
Bank.
IPA (International Planning Associates), 1979. The Master Plan for Abuja, the New
Federal Capital of Nigeria (Technical report submitted to FCDA Abuja, Nigeria).
Jaglin, S., 2002. The right to water versus cost recovery: participation, urban water
supply and the poor in sub-Saharan Africa. Environ. Urban. 14 (1), 231e245.
Kendall, S.D., 2006 Feb 2. Customer Service from the Customer's Perspective.
Customer Service Delivery: Research and Best Practices, pp. 3e21.
Kumar, S., Managi, S., 2010. Service quality and performance measurement: evi-
dence from the Indian water sector. Water Resour. Dev. 26 (2), 173e191.
Leadership Newspaper, 2014, March 30. Population Explosion Affecting Water
Supply in FCT. http://leadership.ng/business/360937/population-explosion-affe
cting-water-supply-fct (Accessed: May 08, 2014).
Lee, E., Schwab, K., 2005. Deficiencies in drinking water distribution systems in
developing countries. J. water health 3, 109e127.
Lin, C., 2005. Service quality and prospects for benchmarking: evidence from the
Peru water sector. Util. Policy 13 (3), 230e239.
Lobina, E., Kishimoto, S., Petitjean, O., 2014. Here to Stay: Water Remunicipalisation
as a Global Trend. Public Services International Research Unit (PSIRU),
Transnational Institute (TNI) and Multinational Observatory, UK.
Marin, P., 2009. Public-private Partnerships for Urban Water Utilities: a Review of
Experiences in Developing Countries, vol. 8. World Bank Publications.
Marshall, B., Cardon, P., Poddar, A., Fontenot, R., 2013. Does sample size matter in
qualitative research: a review of qualitative interviews in IS research. J. Comput.
Inf. Syst. 54 (1), 11e22.
McIntosh, A.C., 2003. Asian Water Supplies, Reaching the Urban Poor. Asian
Development Bank, IWA, London.
Mugabi, J., Kayaga, S., Njiru, C., 2007. Strategic planning for water utilities in
developing countries. Util. Policy 15 (1), 1e8.
Myers, G.A., 2011. African Cities: Alternative Visions of Urban Theory and Practice.
Zed Books, London.
News, F.C.T.A., 2014, April 15. GEJ Commissions Phases 3 4 Abuja Water Treatment
Plants. http://www.fct.gov.ng/index15_04_14n.html?option¼com_contentvie
w¼articleid¼286:fct-ministers-wife-reaffirms-support-for-the-needycati
d¼:latest (Accessed: May 07, 2014).
Nganyanyuka, K., Martinez, J., Wesselink, A., Lungo, J.H., Georgiadou, Y., 2014.
Accessing water services in Dares Salaam: are we counting what counts?
Habitat Int. 44, 358e366.
Noy, C., 2008. Sampling knowledge: the hermeneutics of snowball sampling in
qualitative research. Int. J. Soc. Res. Methodol. 11 (4), 327e344.
NPC (National Population Commission), 2014. Nigeria Demographic and Health
Survey 2013 (Abuja, Nigeria, and Rockville, Maryland, USA: NPC and ICF
International).
OECD, 2015. Stakeholder Engagement for Inclusive Water Governance. OECD
Studies on Water. OECD Publishing, Paris.
Ojo, V.O., 2011. Customer Satisfaction: a Framework for Assessing the Service
Quality of Urban Water Service Providers in Abuja. Doctoral thesis. School of
Civil and Building Engineering, Loughborough University.
Parasuraman, A., Zeithaml, V.A., Berry, L.L., 1994. Reassessment of expectations as a
comparison standard in measuring service quality: Implications for further
research. J. Mark. 58, 111e124.
Percy, S.L., 1986. In defense of citizen evaluations as performance measures. Urban
Aff. Rev. 22, 66e83.
Picazo-Tadeo, A.J., Saez-Fernandez, F.J., Gonzalez-Gomez, F., 2008. Does service
quality matter in measuring the performance of water utilities? Util. Policy 16
(1), 30e38.
Rakodi, C., 2000. “Getting the pipe laid is one matter and getting the water flowing
through the pipe is another”: user views on public-sector urban water provision
in Zimbabwe, Sri Lanka, Ghana and India. Int. Plan. Stud. 5 (3), 365e391.
Teisman, G., Hermans, L., 2011, March. Perspectives on water governance. In: Van
der Valk, M.R., Keenan, P. (Eds.), Principles of Good Governance at Different
Water Governance Levels. Workshop, vol. 22 (Delft, the Netherlands).
Thoenen, R., 2007. Private Sector Participation in the Provision of Basic Infrastruc-
ture. Working paper 66, African Trade Policy Centre, United Nations Economic
Commission for Africa.
UN, 2010. The Right to Water. Fact Sheet No. 35. UN, UN-HABITAT and WHO. http://
www.ohchr.org/Documents/Publications/FactSheet35en.pdf (Accessed: May 04,
2014).
UNDESA (United Nations Department of Economic and Social Affairs), 2010. Inter-
national Decade for Action “WATER for LIFE” 2005-2015. UNDESA. http://
www.un.org/waterforlifedecade/human_right_to_water.shtml (Accessed: 03/
Oct./2015).
Werna, E., 2000. Combating Urban Inequalities: Challenges for Managing Cities in
the Developing World. Edward Elgar, Cheltenham.
WHO, 2011, fourth ed.. Guidelines for Drinking-water Quality. WHO Library
Cataloguing-in-Publication Data.
WHO, 2013. Water Quality and Health Strategy 2013-2020. WHO Library
Cataloguing-in-Publication Data.
WHO/UNICEF, 2014. Progress on Drinking Water and Sanitation: 2014 Update.
WHO/UNICEF Joint Monitoring Programme for Water Supply and Sanitation.
Yin, R.K., 2003. Case Study Research: Design and Methods, third ed. Sage Publica-
tions, Los Angeles.
Zeraebruk, K.N., Mayabi, A.O., Gathenya, J.M., Tsige, Z., 2014. Assessment of water
Supply services and operational performance of Asmara water Supply depart-
ment (AWSD) for development of decision support tools. Environ. Nat. Resour.
Res. 4 (4), 208e222.
Zerah, M.H., 1998. How to assess the quality dimension of urban infrastructure: the
case of water supply in Delhi. Cities 15 (4), 285e290.
I.R. Abubakar / Utilities Policy 38 (2016) 43e51 51