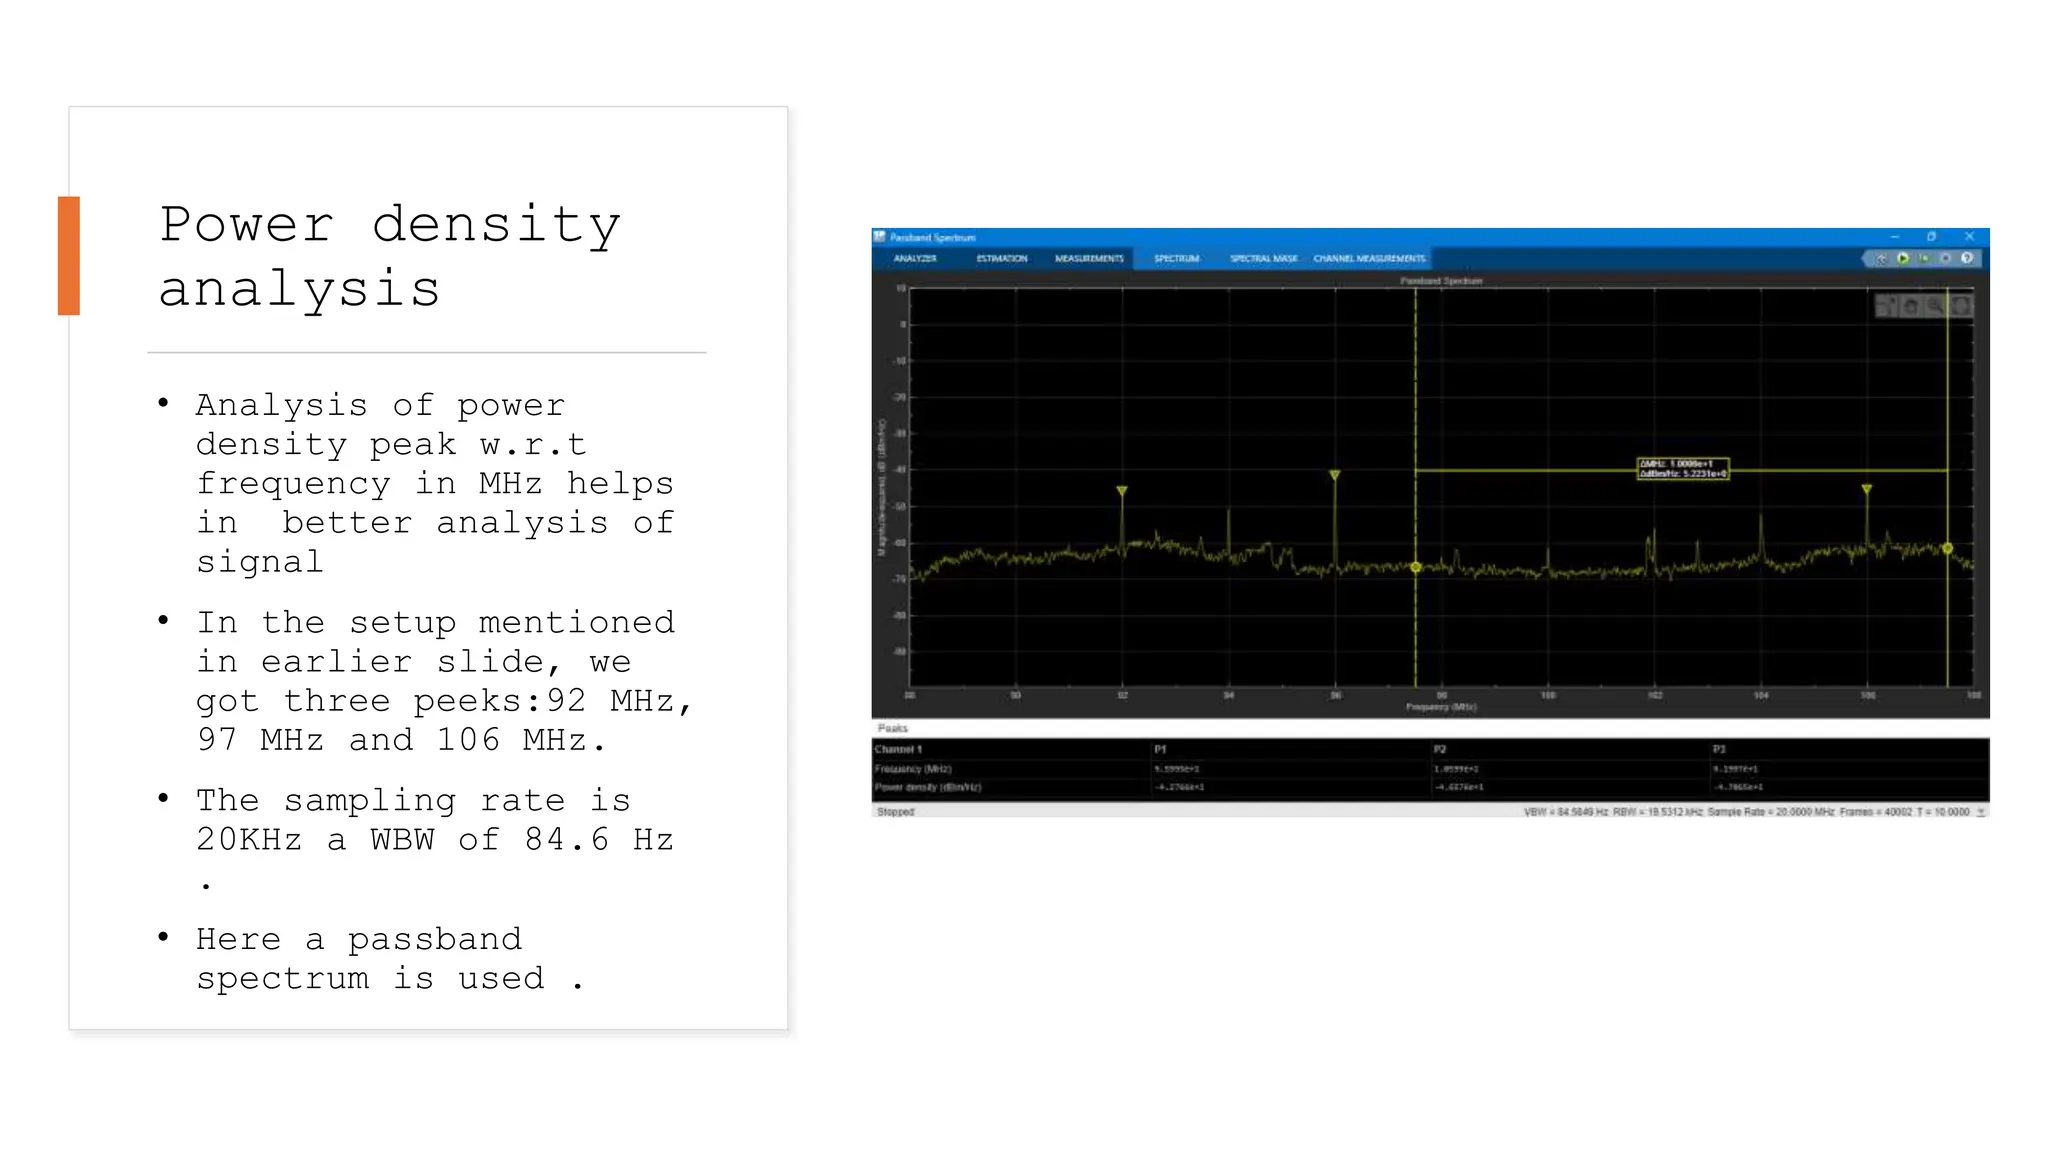
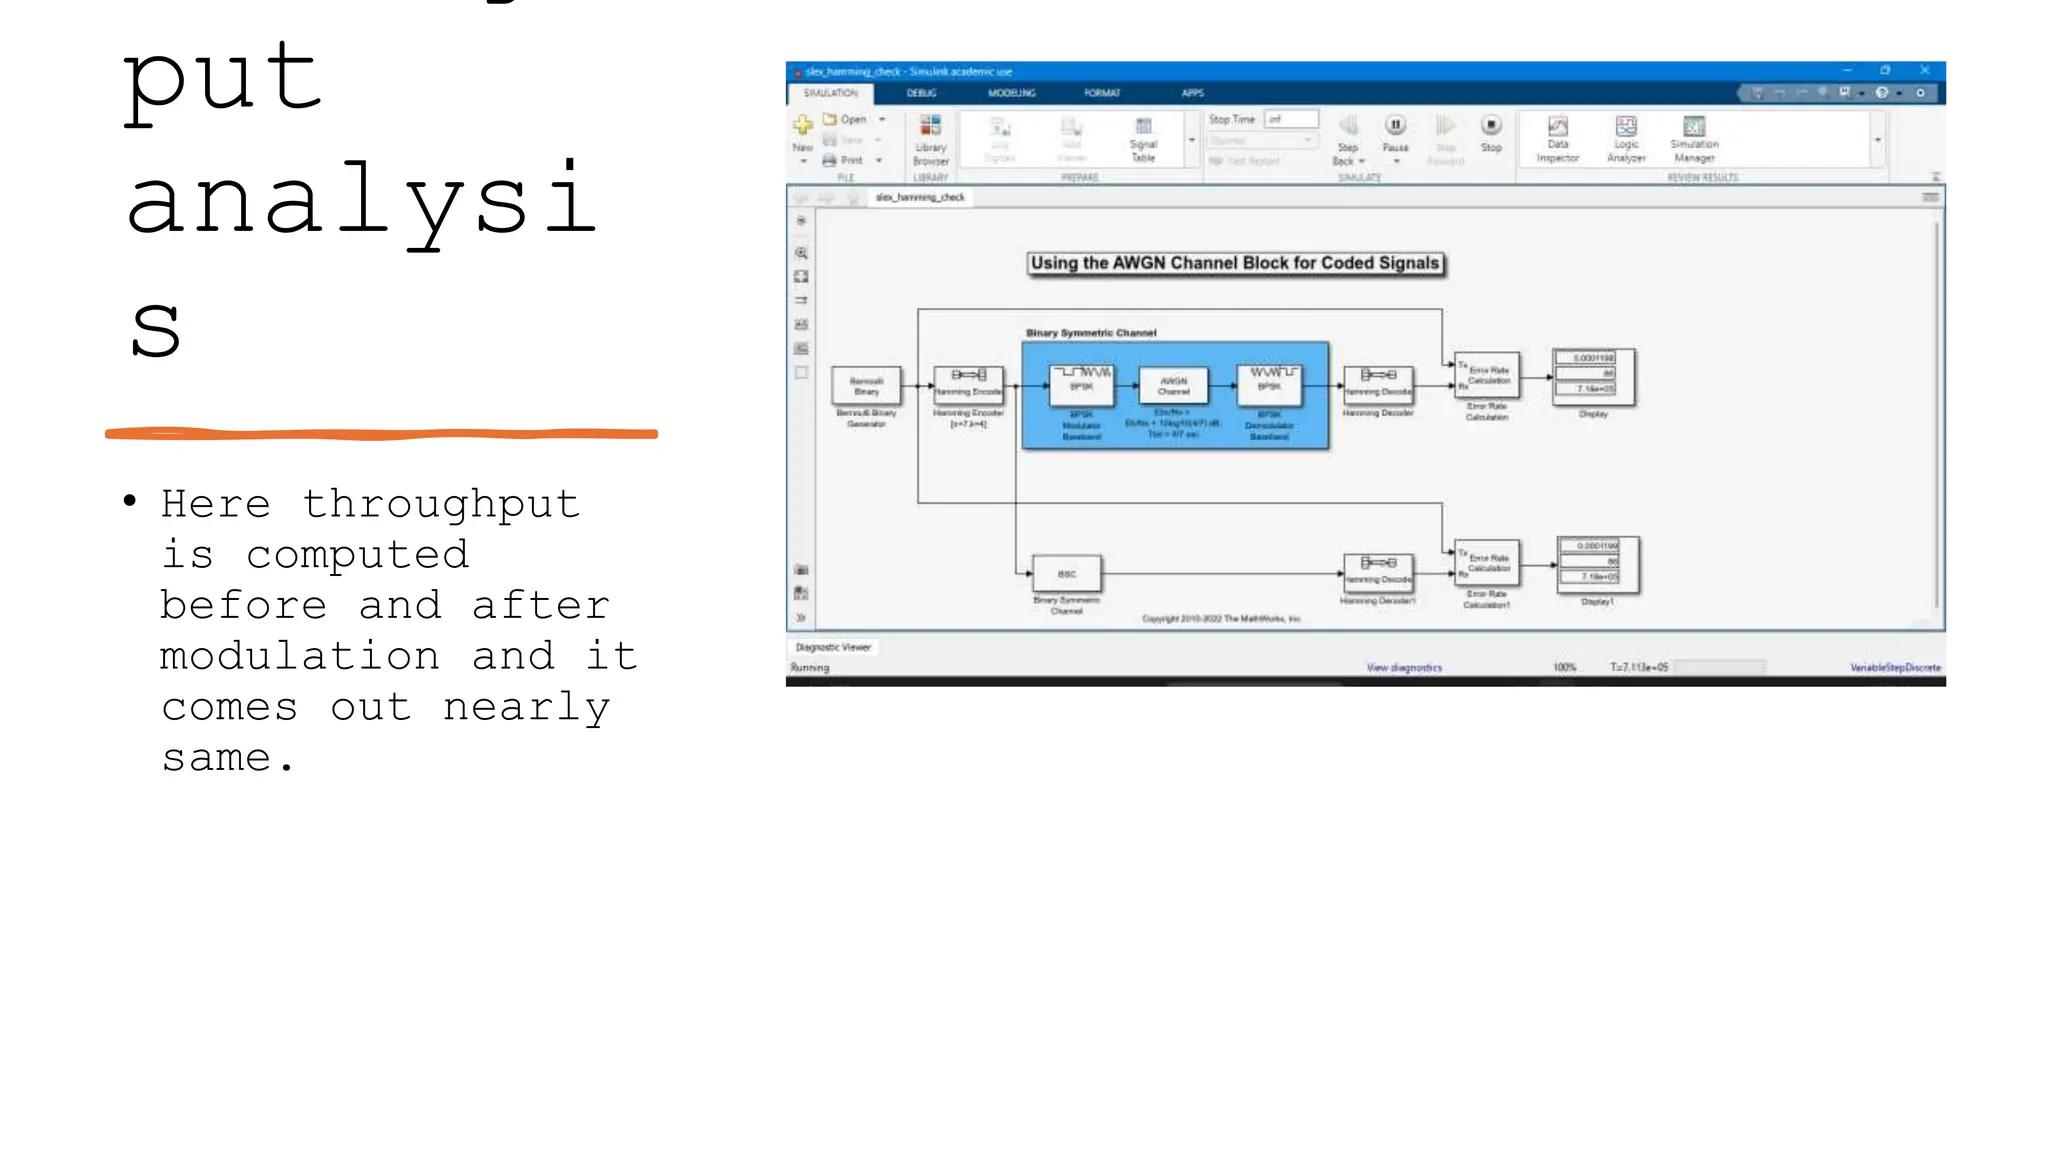
Communication using
SDR
Under the guidance of
Dr Amit Kumar Singh
Asst. Professor
Department of
Electrical and Electronics Engineering
Indian Institute of Technology
Patna
PROJECT OBJECTIVES
SDR based QPSK
and QAM
Audio and video
transmission and
reception by SDR
Channel analysis
Range
enhancement
through IRS
Throughput
analysis
BIT GENERATION
• In QPSK module , one have a
transmitter and receiver. The
first part is transmitter of
signal , which has a bit
generation block which consist of
unipolar barker code generator,
and a real time signal from
workspace, a 2x repeater and a
scrambler. Setting barker code
constant as 14 , both signal are
connected to a matrix concentrate
Symbol and frame
synchronization and frequency
compensation
• For the receiver part , an ADC is connected
with a square root filter in order to do the
filtration , we had a coarse frequency
compensator to generate the missing frequency
components to make the spectrum continuous. We
had a symbols synchronizer to synchronize all
the symbols present in a particular signal
then we do frame synchronization in order to
ensure that each frame of the signal are well
synchronize both at the transmitter and
receiver end.
Constellation diagram
• Apart from bit generation the module
contain the QPSK modulator to
modulate the generated signal over
QPSK scheme. The 2242X1 input change
to 1121X1 output from the QPSK
modulator pass to a square filter
which is then pass to a spectrum
analyzer after RC transmission
filter.
• The signal of QPSK is generated at a
sample rate of 98.9409 KHz. It has
188 samples and had a time period
of 1.065 seconds indicated in
picture.
• The pictures in the right side
showing the constellation diagram of
QPSK having poles in all four
Synchronization
• In QPSK module , one have a
transmitter and receiver. The first
part is transmitter of signal , which
has a bit generation block which
consist of unipolar barker code
generator, and a real time signal from
workspace, a 2x repeater and a
scrambler. Setting barker code
constant as 14 , both signal are
connected to a matrix concentrate of
two matrices to form a new modulated
signal.
• Each data frame has 26 bits for
header and 112 bits for message
propose, scrambler is there to improve
QPSK generation by MATLAB
code
• written a MATLAB code in order to
generate the QPSK modulation scheme
• Taking preamble section threshold as
2 and an error rate of 0.000935 ,
generated 153620 samples in a span
out of which 1637 samples are
detected as errors
• Wide bandwidth is 50KHz and res
bandwidth is 97.65 Hz
QAM TransReciever
Parameters and error
detection
• In order to generate a QAM signal we had a
Bernoulli binary Generator connected with 256
bit QAM modulator which is transmitted to a
AWGN channel of predefined parameters.
• We then add some phase noise in the signal ,
and pass it through QAM demodulator .
• Then the generated and received signal are
collectively taken to bit error rate
calculator to check the synchronization of
transmitted and the received signal.
• We got BER as 0.0001582 and a total 100 errors
.
• We had a symbol rate of 6.32x10⁵
IMAGE
TRANSMISSION AND
RECEPTION
• These steps describe the general procedure of the WLAN
transmitter.
1. Import an image file and convert it to a stream of decimal bytes
2. Generate a baseband WLAN signal using the WLAN Toolbox
3. Pack the data stream into multiple 802.11a packets
• If using an SDR, these steps describe the setup of the SDR
transmitter.
1. Prepare the baseband signal for transmission using the SDR
hardware
2. Send the baseband data to the SDR hardware for up sampling
and continuous transmission at the desired center frequency
• Split the data stream (tx Image) into smaller transmit units
(MSDUs) of size msduLength. Then, create an MPDU for each
transmit unit using the wlanMACFrame function. Each call to this
function creates an MPDU corresponding to the given MSDU and
the frame configuration object. Next, create the frame
configuration object using wlanMACFrameConfig to configure the
sequence number of the MPDU. All the MPDUs are then
sequentially passed to the physical layer for transmission.
• To ensure that the MSDU size of the transmission does not
exceed the standard-specified maximum, set the
msduLength field to 2304 bytes. To make all MPDUs the same
size, append zeros to the data in the last MPDU.
RECIEVER SETUP
The steps listed below describe the general structure of the WLAN receiver.
1. If using SDR hardware, capture multiple packets of the transmitted WLAN signal
2. Detect a packet
3. Coarse carrier frequency offset is estimated and corrected
4. Fine timing synchronization is established. The L-STF, L-LTF and L-SIG samples are provided for fine timing to allow to
adjust the packet detection at the start or end of the L-STF
5. Fine carrier frequency offset is estimated and corrected
6. Perform a channel estimation for the received signal using the L-LTF
7. Detect the format of the packet
8. Decode the L-SIG field to recover the MCS value and the length of the data portion
9. Decode the data field to obtain the transmitted data within each packet
10.Decode the received PSDU and check if the frame check sequence (FCS) passed for the PSDU
11.Order the decoded MSDUs based on the Sequence Number property in the recovered MAC frame configuration object
12.Combine the decoded MSDUs from all the transmitted packets to form the received image
Video audio
transmission
• Audio is a 2-dimensional
signal and video is a 3-
dimensional signal so we
must do the matrix
concentration of
different dimensions.
• It will undergo
dimensional matrix
selection, FM modulation
and ADC Conversion.
• The ADC converted signal
is transmitted to ADLAM
PLUTO transmitter
CHANNEL ANALYSIS
• Compute the channel matrix for a 13-element transmitting array
and a 15-element receiving array. Assume that there are 17
randomly located scatterers. The arrays are uniform linear
arrays with 0.45-wavelength spacing. The receiving array is 300
wavelengths away from the transmitting array. Use the channel
matrix to compute a propagated signal from the transmitting
array to the receiving array.
• Specify the arrays. Element spacing is in units of wavelength.
• We need to install phased array system toolbox
for this
Computing
parameters
• We can compute the different
parameters by computing channel
matrix for signal
• One part is a real number line and
other one is complex line
• Multipath fading channel analysis
is done for the path analysing
path gain and path filter content.
METRICES
• They are the computed matrix
parameters
Spectrum
analysis of the
channel
Spectrum analysis setup consist of a central frequency tuner , a
baseband file reader and a multiple signal detector a DC blocker to
block the external disturbances
Power density
analysis
• Analysis of power
density peak w.r.t
frequency in MHz helps
in better analysis of
signal
• In the setup mentioned
in earlier slide, we
got three peeks:92 MHz,
97 MHz and 106 MHz.
• The sampling rate is
20KHz a WBW of 84.6 Hz
.
• Here a passband
spectrum is used .
put
analysi
s
• Here throughput
is computed
before and after
modulation and it
comes out nearly
same.

QPSK , QAM AND FM MODULATION BY SDRbtp.pptx

  • 1.
    Communication using SDR Under theguidance of Dr Amit Kumar Singh Asst. Professor Department of Electrical and Electronics Engineering Indian Institute of Technology Patna
  • 2.
    PROJECT OBJECTIVES SDR basedQPSK and QAM Audio and video transmission and reception by SDR Channel analysis Range enhancement through IRS Throughput analysis
  • 3.
    BIT GENERATION • InQPSK module , one have a transmitter and receiver. The first part is transmitter of signal , which has a bit generation block which consist of unipolar barker code generator, and a real time signal from workspace, a 2x repeater and a scrambler. Setting barker code constant as 14 , both signal are connected to a matrix concentrate
  • 4.
    Symbol and frame synchronizationand frequency compensation • For the receiver part , an ADC is connected with a square root filter in order to do the filtration , we had a coarse frequency compensator to generate the missing frequency components to make the spectrum continuous. We had a symbols synchronizer to synchronize all the symbols present in a particular signal then we do frame synchronization in order to ensure that each frame of the signal are well synchronize both at the transmitter and receiver end.
  • 5.
    Constellation diagram • Apartfrom bit generation the module contain the QPSK modulator to modulate the generated signal over QPSK scheme. The 2242X1 input change to 1121X1 output from the QPSK modulator pass to a square filter which is then pass to a spectrum analyzer after RC transmission filter. • The signal of QPSK is generated at a sample rate of 98.9409 KHz. It has 188 samples and had a time period of 1.065 seconds indicated in picture. • The pictures in the right side showing the constellation diagram of QPSK having poles in all four
  • 6.
    Synchronization • In QPSKmodule , one have a transmitter and receiver. The first part is transmitter of signal , which has a bit generation block which consist of unipolar barker code generator, and a real time signal from workspace, a 2x repeater and a scrambler. Setting barker code constant as 14 , both signal are connected to a matrix concentrate of two matrices to form a new modulated signal. • Each data frame has 26 bits for header and 112 bits for message propose, scrambler is there to improve
  • 7.
    QPSK generation byMATLAB code • written a MATLAB code in order to generate the QPSK modulation scheme • Taking preamble section threshold as 2 and an error rate of 0.000935 , generated 153620 samples in a span out of which 1637 samples are detected as errors • Wide bandwidth is 50KHz and res bandwidth is 97.65 Hz
  • 8.
  • 9.
    Parameters and error detection •In order to generate a QAM signal we had a Bernoulli binary Generator connected with 256 bit QAM modulator which is transmitted to a AWGN channel of predefined parameters. • We then add some phase noise in the signal , and pass it through QAM demodulator . • Then the generated and received signal are collectively taken to bit error rate calculator to check the synchronization of transmitted and the received signal. • We got BER as 0.0001582 and a total 100 errors . • We had a symbol rate of 6.32x10⁵
  • 10.
    IMAGE TRANSMISSION AND RECEPTION • Thesesteps describe the general procedure of the WLAN transmitter. 1. Import an image file and convert it to a stream of decimal bytes 2. Generate a baseband WLAN signal using the WLAN Toolbox 3. Pack the data stream into multiple 802.11a packets • If using an SDR, these steps describe the setup of the SDR transmitter. 1. Prepare the baseband signal for transmission using the SDR hardware 2. Send the baseband data to the SDR hardware for up sampling and continuous transmission at the desired center frequency • Split the data stream (tx Image) into smaller transmit units (MSDUs) of size msduLength. Then, create an MPDU for each transmit unit using the wlanMACFrame function. Each call to this function creates an MPDU corresponding to the given MSDU and the frame configuration object. Next, create the frame configuration object using wlanMACFrameConfig to configure the sequence number of the MPDU. All the MPDUs are then sequentially passed to the physical layer for transmission. • To ensure that the MSDU size of the transmission does not exceed the standard-specified maximum, set the msduLength field to 2304 bytes. To make all MPDUs the same size, append zeros to the data in the last MPDU.
  • 11.
    RECIEVER SETUP The stepslisted below describe the general structure of the WLAN receiver. 1. If using SDR hardware, capture multiple packets of the transmitted WLAN signal 2. Detect a packet 3. Coarse carrier frequency offset is estimated and corrected 4. Fine timing synchronization is established. The L-STF, L-LTF and L-SIG samples are provided for fine timing to allow to adjust the packet detection at the start or end of the L-STF 5. Fine carrier frequency offset is estimated and corrected 6. Perform a channel estimation for the received signal using the L-LTF 7. Detect the format of the packet 8. Decode the L-SIG field to recover the MCS value and the length of the data portion 9. Decode the data field to obtain the transmitted data within each packet 10.Decode the received PSDU and check if the frame check sequence (FCS) passed for the PSDU 11.Order the decoded MSDUs based on the Sequence Number property in the recovered MAC frame configuration object 12.Combine the decoded MSDUs from all the transmitted packets to form the received image
  • 12.
    Video audio transmission • Audiois a 2-dimensional signal and video is a 3- dimensional signal so we must do the matrix concentration of different dimensions. • It will undergo dimensional matrix selection, FM modulation and ADC Conversion. • The ADC converted signal is transmitted to ADLAM PLUTO transmitter
  • 13.
    CHANNEL ANALYSIS • Computethe channel matrix for a 13-element transmitting array and a 15-element receiving array. Assume that there are 17 randomly located scatterers. The arrays are uniform linear arrays with 0.45-wavelength spacing. The receiving array is 300 wavelengths away from the transmitting array. Use the channel matrix to compute a propagated signal from the transmitting array to the receiving array. • Specify the arrays. Element spacing is in units of wavelength. • We need to install phased array system toolbox for this
  • 14.
    Computing parameters • We cancompute the different parameters by computing channel matrix for signal • One part is a real number line and other one is complex line • Multipath fading channel analysis is done for the path analysing path gain and path filter content.
  • 15.
    METRICES • They arethe computed matrix parameters
  • 16.
    Spectrum analysis of the channel Spectrumanalysis setup consist of a central frequency tuner , a baseband file reader and a multiple signal detector a DC blocker to block the external disturbances
  • 17.
    Power density analysis • Analysisof power density peak w.r.t frequency in MHz helps in better analysis of signal • In the setup mentioned in earlier slide, we got three peeks:92 MHz, 97 MHz and 106 MHz. • The sampling rate is 20KHz a WBW of 84.6 Hz . • Here a passband spectrum is used .
  • 18.
    put analysi s • Here throughput iscomputed before and after modulation and it comes out nearly same.