The document provides a daily market report and analysis for Qatar stocks. It summarizes the performance of the QSE Index and key stocks. The Index dipped sharply but found support at 10,900, an important level to hold. IQCD stock lost over 4% but recovered slightly and may see a short-term bounce if it breaks above 111.50. Overall market activity increased significantly compared to the previous session. The report provides technical analysis indicators and levels for the Index and various sectors to identify potential support and resistance levels.
The document provides a daily technical analysis and summary of the Qatar stock market and select stocks. It includes:
1) An overview of the QSE Index closing flat but losing 15.11% year-over-year, remaining below major moving averages with 10,500 as key resistance.
2) Technical analysis and commentary on the stock QIGD, noting it has been in a recovery phase and may continue with price stabilizing above QR36 and positive indicators.
3) Market indicators for the QE and QSE indexes, and technical charts and levels for analyzing stock prices.
QNBFS Daily Technical Trader - Qatar May 09, 2016QNB Group
The QSE Index dropped slightly down; the
trend remains down. The RSI continued
further into the oversold area on the daily
chart yet positively diverging on the
intraday chart. As a result, a positive
pullback in the short term is becoming
more possible.
The QSE Index continued its bullish momentum, rising 1.01% over the day. However, the document maintains the index remains in a medium-term downtrend as it is moving below its 100SMA and 200SMA. IQCD stabilized above QR120 but still below its SMAs, with momentum indicators suggesting it has potential to bounce from this level. Traders are advised to take advantage of this expected short-term bounce in IQCD.
QNBFS Daily Technical Trader - Qatar for October 31, 2017QNB Group
The document provides a daily technical analysis and summary of the Qatar Stock Exchange (QSE) Index and market. It includes:
1) An overview that the Index closed higher but on lower volumes, and upticks need increasing volumes to be truly bullish. Positive divergence remains on daily MACD and RSI indicators.
2) Expected resistance and support levels for the QSE Index.
3) A summary of market indicators such as value traded, exchange market capitalization, and volume compared to the previous day.
4) Details on index performance and company stocks that are oversold or overbought according to the RSI.
QNBFS Daily Technical Trader - Qatar May 31, 2016QNB Group
The Index dropped through another
session and the momentum remains
down. Due to the MSCI rebalancing, high
volatility is expected. That been said, we
note that the RSI reached the oversold
area on both time frames. As a result, the
Index might see a relief bounce.
The QSE Index faced resistance at 10,500 and pulled back slightly to close at 10,435.67, up 0.36%. The main trend remains downward and the index is in an uptick correction. Support is seen at 10,300 and resistance at 10,500. DHBK closed at 44.00, up 0.80%, and may continue rising if it breaks above resistance at 44.50.
QNBFS Daily Technical Trader - Qatar May 08, 2016QNB Group
The QSE Index lost over 1% on
Thursday’s session vs the session before
and over 4% vs the week before. The
name in a downtrend on multiple time
frames. Except for the positive divergence
seen on the intra-day’s RSI, the main
trajectory is mostly down.
QNBFS Daily Technical Trader - Qatar September 26, 2016QNB Group
The document provides a daily market summary and technical analysis of the Qatar Stock Exchange (QSE) Index. It discusses the index's slight uptick and remaining in a bearish trend. Key support and resistance levels are identified at 10,250 and 10,650 respectively. Market indicators such as trading volume and number of transactions declined compared to the previous day. Individual stocks that are oversold based on their relative strength index are also listed.
QNBFS Daily Technical Trader - Qatar for January 02, 2018QNB Group
The Index has created a tightly formed bullish flag on the daily chart; we expect the market to become bullish in the short term if it breaks above the 8,570.
The QSE Index closed marginally lower while trading volumes dropped. Technical indicators remained unchanged as uncertainty prevailed in the market. A key stock, ERES, rose over 2% and remains in an overall positive momentum. The document provides analysis of market trends, levels of support and resistance, and recommendations for particular stocks.
QNBFS Daily Technical Trader - Qatar for October 24, 2017QNB Group
The Index did not move as we expected to and we should be cautious; the Index may test the 8,000 level again. The current drop was coincided with slightly higher traded volumes. Bullish divergence, however, remains on the RSI.
QNBFS Daily Technical Trader - Qatar September 04, 2016QNB Group
The Index continued with its correction
last Thursday and reached its 61.8%
Fibonacci retracement from its up-move
that started last August. There is no sign
of recovery yet. As a result, we wait and
see how the market develops in the
coming sessions.
QNBFS Daily Technical Trader - Qatar for October 04, 2017QNB Group
The Index dropped slightly on lower volumes which is not a sign for a concern yet. The current levels (from here all the way down to 8,000) are expected to be strong support levels due to their location around an old consolidation area.
QNBFS Daily Technical Trader - Qatar for October 18, 2017QNB Group
The Index is back inside the corrective channel (see intraday chart), but trying to burst through the upper border of that channel. Successful attempt would mean the positive divergence of the daily RSI against the Index remains intact and there is still a chance for recovery.
The QSE Index dropped 1.65% on lower trading volumes, creating a bearish candlestick pattern that indicates a possible short-term correction. Key support levels are seen at 11,500 and resistance at 11,760. The technical analysis of stock QGMD notes it bounced off its 200-day moving average, and its MACD and RSI indicate it could rise further if it breaks above resistance at QR14. The document provides analysis of market indicators, index levels, and technical details on individual stocks.
QNBFS Daily Technical Trader - Qatar May 10, 2016QNB Group
The QSE Index ended the previous session
with a pullback. This move is positive but
it remains against the downtrend seen on
the daily and the intraday charts. As a
result, traders should be cautious on the
prospect of this short-term recovery.
QNBFS Daily Technical Trader - Qatar for December 21, 2017QNB Group
The Index created a bearish signal that has not been confirmed at around strong resistance level; it is the Doji candlestick accompanied with higher volumes. There is a strong possibility for a correction after the strong relief rally which has been experienced recently.
QNBFS Daily Technical Trader - Qatar for January 8, 2018QNB Group
The Index continued with its bullish move away from downtrend channel seen on the daily chart. That is good news, and now the top border of that channel is expected to be a strong support for any correction.
QNBFS Daily Technical Trader - Qatar for September 06, 2017QNB Group
The Index managed to close above the 8,800 level at the end of the last session; relatively higher volumes were noticed. The Index needs to sustain a close above 8,800 for a chance to see a relief rally. Expect volumes to be muted.
QNBFS Daily Technical Trader - Qatar June 09, 2016QNB Group
The document provides a daily market summary and technical analysis of the Qatar Stock Exchange (QSE) from June 9, 2016. It includes the following key points:
1) The QSE index has been trending upward recently with no major corrections, which could lead to profit-taking that interrupts the upward movement.
2) Support and resistance levels for the index are identified as 9,800 and 10,000 respectively.
3) Market indicators like trading volume and number of transactions declined compared to the previous day, while the market breadth was negative.
4) Technical analyses are provided for various stocks and indices listing support and resistance levels based on moving averages and Fibonacci retracements.
QNBFS Daily Technical Trader - Qatar for September 28, 2017QNB Group
The Index started to give mixed signals. But to be fair, the Bearish Engulfing pattern created by yesterday’s closing suggests further weakness to be expected. We reiterate the idea that the levels between 8,000 and 8,350 are important to act as support levels; the support is derived from old consolidation areas.
QNBFS Daily Technical Trader - Qatar for October 15, 2017QNB Group
The Index reached an intra-day resistance any may correct. That being said, if the Index does not break below the recent low, it may correct for another bullish movement upwards.
QNBFS Daily Technical Trader - Qatar for September 18, 2017QNB Group
The Index managed to close above the strong support between 8,350 and 8,200. Another Hammer candlestick has been created, which turns the pattern into a Tweezer’s bottom formation (a bullish reversal formation). As a result, there is a stronger chance to see a short-term relief rally.
QNBFS Daily Technical Trader Qatar - August 27, 2020 التحليل الفني اليومي لبو...QNB Group
The document provides a daily technical analysis of the QE Index and Masraf Al Rayan stock in Qatar. For the QE Index, it notes the index reached a previously identified resistance level of 9,850 points and surpassed it, reaching strong resistance around 10,000 points. For Masraf Al Rayan stock, it indicates the price has been trending up towards critical levels and needs to break above resistance levels of QR4.163-QR4.693 for the upward trend to continue stronger. It also defines various technical analysis terms and indicators discussed in the analysis.
QNBFS Daily Technical Trader Qatar - May 07, 2020 التحليل الفني اليومي لبورصة...QNB Group
The Index bounced off the support stemming from the corrective uptrend line. However, that level is expected to be tested as the Index remains to be under selling pressure.
QNBFS Daily Technical Trader - Qatar for September 24, 2018 التحليل الفني الي...QNB Group
The document provides a daily technical analysis and overview of the Qatar Stock Exchange Index and the Commercial Bank stock. For the index, it notes that prices continue to drop below 10,000 points and may continue lower to 9,750 points, though the overall trend remains upward. It identifies expected resistance and support levels. For the bank stock, it notes prices have been flat recently but the overall trend remains upward, and identifies expected target prices and stop-loss levels. It also defines various technical analysis terms and indicators mentioned.
QNBFS Daily Technical Trader Qatar - January 13, 2020 التحليل الفني اليومي لب...QNB Group
The document provides a daily technical analysis and overview of the Qatar Stock Exchange index and two Qatari stocks - Doha Bank and Industries Qatar. For the QSE index, it notes the formation of a bullish flag pattern and provides expected resistance and support levels. For Doha Bank stock, it analyzes a bullish symmetrical triangle pattern and gives expected price targets and stop-loss levels. Key market indicators for the QSE are also summarized. Technical definitions and indicators mentioned in the analysis are explained.
QNBFS Daily Technical Trader Qatar - March 02, 2020 التحليل الفني اليومي لبور...QNB Group
The document provides a daily technical analysis of the Qatar Stock Exchange index. It notes that the index is testing the 9,500 support level as selling pressure mounts, with further expected support at 9,200 and 8,850. Market indicators for the past two days are also presented, along with definitions of technical analysis terms like candlesticks, support and resistance levels, and moving averages.
QNBFS Daily Technical Trader Qatar - February 18, 2020 التحليل الفني اليومي ل...QNB Group
The General Index breached our previously expected support level at the 9,750 and closed below it. As a result, we update our immediate support level around the 9,500 level.
QNBFS Daily Technical Trader - Qatar for November 08, 2017Aicha El-Mamy
The Index dropped sharply through the session and reached our expected support at 7,800, but it closed closer to the 8,000
resistance. Relief rallies are possible against the trend but traders should be cautious.
QNBFS Daily Technical Trader - Qatar for November 08, 2017QNB Group
The document is a daily technical analysis report from QNBFS that provides:
1) An overview of the Qatari stock market dropping sharply and closing near the 8,000 resistance level.
2) A list of resistance and support levels for the QSE Index and individual stocks.
3) Charts and indicators showing market trends and levels.
QNBFS Daily Technical Trader Qatar - July 22, 2020 التحليل الفني اليومي لبورص...QNB Group
The document provides a daily technical analysis of the Qatari stock market index and two stocks - Gulf International Services and an unidentified stock. For the index, it notes the index bounced off a corrective channel but remains below its 200-day moving average and is expected to test that level with increased volatility. For Gulf International Services, it analyzes the daily chart and expects the stock price to move towards recent highs of QR1.799. It also provides expected price targets, resistance and support levels for both securities. The document concludes with definitions of technical analysis terms used in the analysis.
QNBFS Daily Technical Trader - Qatar for November 21, 2017QNB Group
The Index managed to close above the 7,800 level, creating a Doji candlestick on the daily chart. We are still hopeful that the positive divergence between the daily MACD and the RSI against the Index would be fruitful to the extent of a relief rally.
QNBFS Daily Technical Trader Qatar - February 05, 2020 التحليل الفني اليومي ل...QNB Group
The document provides a daily technical analysis of the Qatar Stock Exchange Index and two Qatari stocks - Masraf Al Rayan and a technical definitions section. For the index, it notes it is testing previous support levels and may bounce from current levels if it moves above its major moving averages. For Masraf Al Rayan stock, it provides a price target range and resistance/support levels and notes the recent correction could form a base for another upward move. Technical terms like candlesticks, support, resistance and moving averages are also defined.
QNBFS Daily Technical Trader - Qatar for May 08, 2019 التحليل الفني اليومي لب...QNB Group
The Index continued to go up inside its uptrend channel in the short term, but it remains under the pressure of the rising-wedge formation in the longer term.
QNBFS Daily Technical Trader - Qatar for April 09, 2018 التحليل الفني اليومي ...Aicha El-Mamy
The daily technical analysis discusses the performance of the Qatari stock market index and selected stocks. The index saw typical trading to start the week with no significant movement and lower volumes. The analysis remains positive on the index breaking above 8,800 resistance. Qatar Fuel stock is still seen as bullish for breaking above a flag formation with moving averages confirming the positive price direction. Target prices and support/resistance levels are provided for the stock.
QNBFS Daily Market Report April 08, 2018Aicha El-Mamy
The QSE Index rose 1.0% to close at 8,792.9. Gains were led by the Banks & Financial Services and Real Estate indices, gaining 2.0% and 1.8%, respectively.
QNBFS Daily Technical Trader - Qatar for April 08, 2018 التحليل الفني اليومي ...Aicha El-Mamy
The Index managed to breakout and remain above
the corrective channel (see chart), which is positive. As a result, we expect the Index to continue its uptick as long as it stays above the 8,500 level.
QNBFS Daily Technical Trader - Qatar for April 05, 2018 التحليل الفني اليومي ...Aicha El-Mamy
The market ended yet another session in the red zone and formed a Doji candle. In our assessment, the Index should rise toward the 9,000 mark in the coming sessions.
QNBFS Daily Technical Trader - Qatar for April 04, 2018 التحليل الفني اليومي ...Aicha El-Mamy
The market edged down marginally by 0.08%. However, the Index is gradually moving towards the upper end of the correction channel. Further confirmation is needed through a breakout from this channel towards the 9,000 level.
QNBFS Daily Technical Trader - Qatar for April 03, 2018 التحليل الفني اليومي ...Aicha El-Mamy
The QSE Index ended higher for another session, with the MACD moving towards zero. The index is currently trading above the 50SMA and below the 100SMA and 200SMA. Qatar First Bank has been in a downtrend recently and trading below the 50SMA and 200SMA, with the MACD dipping below zero. Support levels for Qatar First Bank are expected between QR6.13-QR5.90, with resistance at QR6.80.
QNBFS Daily Technical Trader - Qatar for April 01, 2018 التحليل الفني اليومي ...Aicha El-Mamy
The QSE index remained within a corrective channel but formed an indecision candlestick pattern, indicating uncertainty among market participants. The index finds support at the 200SMA level. Mesai'eed Petrochemical stock has formed a strong price structure above its long-term downtrend channel and is expected to move higher if it breaks above QR15 per share. The analysis provides resistance and support levels for the index and Mesai'eed stock.
QNBFS Daily Technical Trader - Qatar for March 29, 2018 التحليل الفني اليومي ...Aicha El-Mamy
The Index moved inside the previously created corrective channel, and this is an alarming situation. The only positive side of the situation is the Index reached the 200SMA, which may act as a
support level. Further decline on the Index inside the channel signals sharper weakness could be unfolding.
QNBFS Daily Technical Trader - Qatar for March 28, 2018 التحليل الفني اليومي ...Aicha El-Mamy
The Index moved further down but remains above the upper side of the corrective channel. We are a bit concerned because the
MACD indicator is has tilted downwards and remains under the zero line, which means bearish momentum has been in control and may continue further.
QNBFS Daily Technical Trader - Qatar for March 27, 2018 التحليل الفني اليومي ...Aicha El-Mamy
Another day in the red but the general Index remains above the 8,650 points, which is slightly positive. The bulls need to take
control of the situation above or around the mentioned level; sustaining an entry inside the corrective channel means weakness could persist.
QNBFS Daily Technical Trader - Qatar for March 26, 2018 التحليل الفني اليومي ...Aicha El-Mamy
The general Index regressed in the beginning of the week but remains above the upper side of the corrective channel. We expect to see some support around that side which is just above our expected support of the 8,650 mark.
QNBFS Daily Technical Trader - Qatar for March 25, 2018 التحليل الفني اليومي ...Aicha El-Mamy
The market closed down 0.54% from vs the previous session, indicating then weakness has persisted. That been said, the index
remains above the corrective channel seen on the chart, proving the uncertainty seen on the expected direction of the market.
QNBFS Daily Technical Trader - Qatar for March 22, 2018 التحليل الفني اليومي ...Aicha El-Mamy
The Index is giving us conflicting signals, between a possible correction because it could not break above the 9,000 level and the expected upward motion stemming from a breakout above the
corrective channel. Our assessment remains in favor
of the positive momentum, given that the Index breaks and sustains its level above.
the 9,000 mark.
QNBFS Daily Technical Trader - Qatar for March 21, 2018 التحليل الفني اليومي ...Aicha El-Mamy
Another day in the green and the Index flirted with the 9,000 level (6 points away), which is positive. Traded volumes were higher
and as a result, we expect the Index to move above the mentioned level.
QNBFS Daily Technical Trader - Qatar for March 20, 2018 التحليل الفني اليومي ...Aicha El-Mamy
The Index managed to close above the corrective channel
which extended since January. The uptick was accompanied with relatively higher volumes and we are becoming more optimistic for the breakout above the 9,000 level.
QNBFS Daily Technical Trader - Qatar for March 19, 2018 التحليل الفني اليومي ...Aicha El-Mamy
The Index is testing the upper side of the recent correction’s channel; the Index needs to break above it, and preferably above the 9,000 level for the Index to be on the safe side.
QNBFS Daily Technical Trader - Qatar for March 18, 2018 التحليل الفني اليومي ...Aicha El-Mamy
The Index managed to penetrate above the flag continuation pattern last Thursday; it looks positive over the coming session and in the medium term. That been said, it should cross above the psychological level of 9,000 to be on the safe side.
QNBFS Daily Technical Trader - Qatar for March 15, 2018 التحليل الفني اليومي ...Aicha El-Mamy
The document provides a daily technical analysis of the Qatari stock market index and United Development Company stock. It notes that the index dropped and filled the price gap from the previous day's session. It remains cautious on the index until it breaks above the 9,000 resistance level. For United Development, it expects the stock to continue its short-term uptrend if the price breaks above yesterday's high of QR16.06 and confirms a falling wedge pattern above QR16.40. Key support and resistance levels are identified for both the index and stock.
QNBFS Daily Technical Trader - Qatar for March 14, 2018 التحليل الفني اليومي ...Aicha El-Mamy
The Index gapped up yesterday but could not reach the 9,000 level. It needs to clear the mentioned level; the 50SMA has been
moving around it, it is also needed to confirm the bullish flag formation. The recent gap could be filled before the breakout.
QNBFS Daily Technical Trader - Qatar for March 13, 2018 التحليل الفني اليومي ...Aicha El-Mamy
The strength of yesterday’s move could mark the end of the recent correction. The Index is bouncing off its 200SMA and that is a strong support to depart from. Further confirmation is needed through a breakout above the 9,000 level, which will clear the other moving averages and to confirm a bullish flag formation.
13 Jun 24 ILC Retirement Income Summit - slides.pptxILC- UK
ILC's Retirement Income Summit was hosted by M&G and supported by Canada Life. The event brought together key policymakers, influencers and experts to help identify policy priorities for the next Government and ensure more of us have access to a decent income in retirement.
Contributors included:
Jo Blanden, Professor in Economics, University of Surrey
Clive Bolton, CEO, Life Insurance M&G Plc
Jim Boyd, CEO, Equity Release Council
Molly Broome, Economist, Resolution Foundation
Nida Broughton, Co-Director of Economic Policy, Behavioural Insights Team
Jonathan Cribb, Associate Director and Head of Retirement, Savings, and Ageing, Institute for Fiscal Studies
Joanna Elson CBE, Chief Executive Officer, Independent Age
Tom Evans, Managing Director of Retirement, Canada Life
Steve Groves, Chair, Key Retirement Group
Tish Hanifan, Founder and Joint Chair of the Society of Later life Advisers
Sue Lewis, ILC Trustee
Siobhan Lough, Senior Consultant, Hymans Robertson
Mick McAteer, Co-Director, The Financial Inclusion Centre
Stuart McDonald MBE, Head of Longevity and Democratic Insights, LCP
Anusha Mittal, Managing Director, Individual Life and Pensions, M&G Life
Shelley Morris, Senior Project Manager, Living Pension, Living Wage Foundation
Sarah O'Grady, Journalist
Will Sherlock, Head of External Relations, M&G Plc
Daniela Silcock, Head of Policy Research, Pensions Policy Institute
David Sinclair, Chief Executive, ILC
Jordi Skilbeck, Senior Policy Advisor, Pensions and Lifetime Savings Association
Rt Hon Sir Stephen Timms, former Chair, Work & Pensions Committee
Nigel Waterson, ILC Trustee
Jackie Wells, Strategy and Policy Consultant, ILC Strategic Advisory Board
Budgeting as a Control Tool in Government Accounting in Nigeria
Being a Paper Presented at the Nigerian Maritime Administration and Safety Agency (NIMASA) Budget Office Staff at Sojourner Hotel, GRA, Ikeja Lagos on Saturday 8th June, 2024.
Fabular Frames and the Four Ratio ProblemMajid Iqbal
Digital, interactive art showing the struggle of a society in providing for its present population while also saving planetary resources for future generations. Spread across several frames, the art is actually the rendering of real and speculative data. The stereographic projections change shape in response to prompts and provocations. Visitors interact with the model through speculative statements about how to increase savings across communities, regions, ecosystems and environments. Their fabulations combined with random noise, i.e. factors beyond control, have a dramatic effect on the societal transition. Things get better. Things get worse. The aim is to give visitors a new grasp and feel of the ongoing struggles in democracies around the world.
Stunning art in the small multiples format brings out the spatiotemporal nature of societal transitions, against backdrop issues such as energy, housing, waste, farmland and forest. In each frame we see hopeful and frightful interplays between spending and saving. Problems emerge when one of the two parts of the existential anaglyph rapidly shrinks like Arctic ice, as factors cross thresholds. Ecological wealth and intergenerational equity areFour at stake. Not enough spending could mean economic stress, social unrest and political conflict. Not enough saving and there will be climate breakdown and ‘bankruptcy’. So where does speculative design start and the gambling and betting end? Behind each fabular frame is a four ratio problem. Each ratio reflects the level of sacrifice and self-restraint a society is willing to accept, against promises of prosperity and freedom. Some values seem to stabilise a frame while others cause collapse. Get the ratios right and we can have it all. Get them wrong and things get more desperate.
Monthly Market Risk Update: June 2024 [SlideShare]Commonwealth
Markets rallied in May, with all three major U.S. equity indices up for the month, said Sam Millette, director of fixed income, in his latest Market Risk Update.
For more market updates, subscribe to The Independent Market Observer at https://blog.commonwealth.com/independent-market-observer.
A toxic combination of 15 years of low growth, and four decades of high inequality, has left Britain poorer and falling behind its peers. Productivity growth is weak and public investment is low, while wages today are no higher than they were before the financial crisis. Britain needs a new economic strategy to lift itself out of stagnation.
Scotland is in many ways a microcosm of this challenge. It has become a hub for creative industries, is home to several world-class universities and a thriving community of businesses – strengths that need to be harness and leveraged. But it also has high levels of deprivation, with homelessness reaching a record high and nearly half a million people living in very deep poverty last year. Scotland won’t be truly thriving unless it finds ways to ensure that all its inhabitants benefit from growth and investment. This is the central challenge facing policy makers both in Holyrood and Westminster.
What should a new national economic strategy for Scotland include? What would the pursuit of stronger economic growth mean for local, national and UK-wide policy makers? How will economic change affect the jobs we do, the places we live and the businesses we work for? And what are the prospects for cities like Glasgow, and nations like Scotland, in rising to these challenges?
Navigating Your Financial Future: Comprehensive Planning with Mike Baumannmikebaumannfinancial
Learn how financial planner Mike Baumann helps individuals and families articulate their financial aspirations and develop tailored plans. This presentation delves into budgeting, investment strategies, retirement planning, tax optimization, and the importance of ongoing plan adjustments.
In World Expo 2010 Shanghai – the most visited Expo in the World History
https://www.britannica.com/event/Expo-Shanghai-2010
China’s official organizer of the Expo, CCPIT (China Council for the Promotion of International Trade https://en.ccpit.org/) has chosen Dr. Alyce Su as the Cover Person with Cover Story, in the Expo’s official magazine distributed throughout the Expo, showcasing China’s New Generation of Leaders to the World.
“Amidst Tempered Optimism” Main economic trends in May 2024 based on the results of the New Monthly Enterprises Survey, #NRES
On 12 June 2024 the Institute for Economic Research and Policy Consulting (IER) held an online event “Economic Trends from a Business Perspective (May 2024)”.
During the event, the results of the 25-th monthly survey of business executives “Ukrainian Business during the war”, which was conducted in May 2024, were presented.
The field stage of the 25-th wave lasted from May 20 to May 31, 2024. In May, 532 companies were surveyed.
The enterprise managers compared the work results in May 2024 with April, assessed the indicators at the time of the survey (May 2024), and gave forecasts for the next two, three, or six months, depending on the question. In certain issues (where indicated), the work results were compared with the pre-war period (before February 24, 2022).
✅ More survey results in the presentation.
✅ Video presentation: https://youtu.be/4ZvsSKd1MzE
The Rise and Fall of Ponzi Schemes in America.pptxDiana Rose
Ponzi schemes, a notorious form of financial fraud, have plagued America’s investment landscape for decades. Named after Charles Ponzi, who orchestrated one of the most infamous schemes in the early 20th century, these fraudulent operations promise high returns with little or no risk, only to collapse and leave investors with significant losses. This article explores the nature of Ponzi schemes, notable cases in American history, their impact on victims, and measures to prevent falling prey to such scams.
Understanding Ponzi Schemes
A Ponzi scheme is an investment scam where returns are paid to earlier investors using the capital from newer investors, rather than from legitimate profit earned. The scheme relies on a constant influx of new investments to continue paying the promised returns. Eventually, when the flow of new money slows down or stops, the scheme collapses, leaving the majority of investors with substantial financial losses.
Historical Context: Charles Ponzi and His Legacy
Charles Ponzi is the namesake of this deceptive practice. In the 1920s, Ponzi promised investors in Boston a 50% return within 45 days or 100% return in 90 days through arbitrage of international reply coupons. Initially, he paid returns as promised, not from profits, but from the investments of new participants. When his scheme unraveled, it resulted in losses exceeding $20 million (equivalent to about $270 million today).
Notable American Ponzi Schemes
1. Bernie Madoff: Perhaps the most notorious Ponzi scheme in recent history, Bernie Madoff’s fraud involved $65 billion. Madoff, a well-respected figure in the financial industry, promised steady, high returns through a secretive investment strategy. His scheme lasted for decades before collapsing in 2008, devastating thousands of investors, including individuals, charities, and institutional clients.
2. Allen Stanford: Through his company, Stanford Financial Group, Allen Stanford orchestrated a $7 billion Ponzi scheme, luring investors with fraudulent certificates of deposit issued by his offshore bank. Stanford promised high returns and lavish lifestyle benefits to his investors, which ultimately led to a 110-year prison sentence for the financier in 2012.
3. Tom Petters: In a scheme that lasted more than a decade, Tom Petters ran a $3.65 billion Ponzi scheme, using his company, Petters Group Worldwide. He claimed to buy and sell consumer electronics, but in reality, he used new investments to pay off old debts and fund his extravagant lifestyle. Petters was convicted in 2009 and sentenced to 50 years in prison.
4. Eric Dalius and Saivian: Eric Dalius, a prominent figure behind Saivian, a cashback program promising high returns, is under scrutiny for allegedly orchestrating a Ponzi scheme. Saivian enticed investors with promises of up to 20% cash back on everyday purchases. However, investigations suggest that the returns were paid using new investments rather than legitimate profits. The collapse of Saivian l
The Rise and Fall of Ponzi Schemes in America.pptx
QNBFS Daily Market Report February 05, 2018
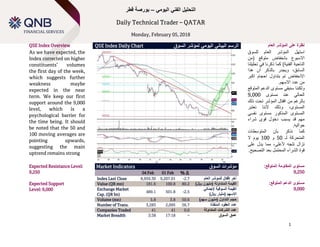
1. Technical Spotlight
Sunday, January 14, 2018
1
اليومي الفني التحليل–قطر بورصة
Daily Technical Trader – QATAR
Monday, February 05, 2018
QSE Index Overview QSE Index Daily Chart السوق لمؤشر اليومي البياني الرسم على نظرةالعام المؤشر
As we have expected, the
Index corrected on higher
constituents’ volumes
the first day of the week,
which suggests further
weakness maybe
expected in the near
term. We keep our first
support around the 9,000
level, which is a
psychological barrier for
the time being. It should
be noted that the 50 and
100 moving averages are
pointing upwards,
suggesting the main
uptrend remains strong
استهلالمؤشرالعامللسوق
االسبوعبانخفاضمتوقع(من
الناحيةالفنية)كماذكرنافيتحليلنا
،السابقويجدربالذكرأنهذا
االنخفاضتمبتداولاحجاماكبر
منعدداالسهم.
ولكنناسنبقيمستوىالدعمالمتوقع
الحاليعندمستوى9,000
بالرغممناقفالالمؤشرتحتذلك
،المستوىوذلكألننانعتبر
المستوىالمذكورمستوىنفسي
مهمقديسببدخولقوىشراء
حواليه.
كمانذكربأنالمتوسطات
المتحركةلـ50و100يومال
تزالتتجه،ألعلىممايدلعلى
قوةالشراءالمحتملبعدالتصحيح.
Expected Resistance Level:
9,250
Expected Support
Level: 9,000
Market Indicators السوق مؤشرات
04 Feb 01 Feb % ∆
Index Last Close 8,959.30 9,207.01 -2.7 آخرالعام للمؤشر إقفال
Value (QR mn) 181.6 100.8 80.2 )لاير (مليون المتداولة القيمة
Exchange Market
Cap. (QR bn)
489.1 501.8 -2.5
السوقية القيمةإلجمالي
االسهم)لاير (مليار
Volume (mn) 5.8 3.8 50.6 )سهم (مليون التداول حجم
Number of Trans. 3,283 2,095 56.7 المنفذة العقود عدد
Companies Traded 41 41 0.0 المتداولة الشركات عدد
Market Breadth 3:38 17:18 – السوق عمق
:المتوقع المقاومة مستوى
9,250
:المتوقع الدعم مستوى
9,000
2. 2
MEDICARE GROUP (MCGS) الرعاية
Stock Overview Daily Chart البياني الرسماليومي على نظرةالسهم
The price has created a
possible Head &
Shoulders formation; it is
a bearish reversal
pattern. Moreover, the
traded volumes have
increased on the
downticks, which
suggest bearish pressure
has been in control for
the past few weeks. RSI
confirms the expected
corrective wave. That
been said, the moving
averages and the MACD
shows the trend remains
up in the short term.
كونالنم السهم سعرالسعري وذج
( التصحيحيوأكد )والكتفين الرأس
اثناء التداول احجام تزايد ذلك
الملحوظة السعرية االنخفاضات
.السابقة االسابيع فيوذلكيدل
علىسعر على البيع قوى سيطرة
.السهم
ويعززاحتمال النسبية القوة مؤشر
.السعري التصحيح
ولكنمؤشر أن على التنويه يجب
MACDالمتحركة والمتوسطات
للسهم العام االتجاه أن على تدلنا
الضعف احتمال من (بالرغم
يزال ال )المتوقع السعري والتصحيح
.ألعلى
Expected Price Retreat:
QR70.00 – QR65.80
A price breach below
QR73.50 triggers the sell
idea.
Last Px. سعراالقفال % ∆ التغير % Volume التداول حجم
74.00 -3.88 83,411
Resistance/Support Levels والمقاومة الدعم مستويات
Level 1st
األول 2nd
الثاني 3rd
الثالث المستوى
Resistance 80.00 88.00 92.30 مقاومة
Support 73.50 70.00 65.80 دعم
:المتوقعة السعرية األهداف
70.00لاير–65.80لاير
ال نرجحبيعالسعر اختراق حال في
مستوى تحت73.50لاير.
3. 3
Definitions
Candlestick: A chart that displays the high, low, opening and closing prices for a security in a single period. The body of the candle is made up by
the opening and the closing prices, i.e., the taller the body the greater the range between these two prices and vice versa. A colored candle
denotes a closing price that is lower than the opening price, while a white candle shows the opposite. The candlestick's shadows or wicks show
the period's high and low prices and how they compare to the opening and closing price. In general, the shape of the candle will vary upon the
positions of the period's high, low, opening and closing prices.
Support: A level that could cause more buyers to step in in order to prevent the security from falling or causing the security price to head higher.
Resistance: An inverse of a support level. A resistance area or level could cause more sellers to step in in order to prevent the security from rising
or causing the security price to head lower.
SMA (Simple Moving Average): Is an arithmetic average, which calculates the average price of a security over a defined number of periods and is
thus considered a lagging indicator. SMAs used in our analysis refer to closing prices. In general, SMAs serve many purposes, such as a
smoothing tool, an indicative price direction and potential support/resistance levels.
Market Breadth: Breadth indicates the number of securities that have closed higher vs. the number of decliners in a particular exchange.
MACD (Moving Average Convergence/Divergence): Is a trading indicator, which shows changes in the strength, direction, momentum and
duration of a trend in a stock's price through a collection of three time series calculated from historical closing price data.
RSI (Relative Strength Index): Is a momentum indicator that compares a security’s price gains to its losses for a predetermined number of periods
(we generally use 14 periods). The RSI attempts to point out how a security, in relative terms, is in the overbought/oversold zone. Securities with
a RSI above 70 could be considered as overbought, and below 30 could be considered as oversold.
Pattern/Formation: Is a graphical presentation of a security’s price activity over a certain period of time. Formations come in different shapes
(such as, head & shoulders, triangles, flags, and so on). They can be used to identify potential trends, reversal of trends, price targets, entry and
exit points, etc.
Fibonacci Retracements: Are horizontal lines that indicate expected areas of support/resistance for a security based on a predetermined price
movement. These levels are usually indicated by Fibonacci ratios of 23.6%, 38.2%, 50.0%, 61.8% and 100% from that particular movement.
Fibonacci Pivot and Intraday Support/Resistance: A Pivot Point is generally used to formulate expected future support/resistance levels. From
the base Pivot Point, Fibonacci multiples of the high-low differential are added to form resistance levels and subtracted to form support levels.
4. 4
Contacts
Zaid al-Nafoosi, CMT, CFTe
Senior Research Analyst
Tel: (+974) 4476 6535
zaid.alnafoosi@qnbfs.com.qa
Saugata Sarkar, CFA, CAIA
Head of Research
Tel: (+974) 4476 6534
saugata.sarkar@qnbfs.com.qa
Shahan Keushgerian
Senior Research Analyst
Tel: (+974) 4476 6509
shahan.keushgerian@qnbfs.com.qa
Mohamed Abo Daff
Senior Research Analyst
Tel: (+974) 4476 6589
mohd.abodaff@qnbfs.com.qa
Ahmed El-Khudary
Head of Trading
Tel: (+974) 4476 6533
ahmed.elkhudary@qnbfs.com.qa
Feras al-Sarraj
Head of Sales
Tel: (+974) 4476 6514
feras.alsarraj@qnbfs.com.qa
QNB Financial Services
Contact Center: (+974) 4476 6666
PO Box 24025
Doha, Qatar
Disclaimer and Copyright Notice: This publication has been prepared by QNB Financial Services Co. W.L.L. (“QNBFS”) a wholly-owned subsidiary of Qatar National Bank (Q.P.S.C.)
(“QNB”). QNBFS is regulated by the Qatar Financial Markets Authority and the Qatar Exchange QNB SAQ is regulated by the Qatar Central Bank. This publication expresses the
views and opinions of QNBFS at a given time only. It is not an offer, promotion or recommendation to buy or sell securities or other investments, nor is it intended to constitute legal,
tax, accounting, or financial advice. QNBFS accepts no liability whatsoever for any direct or indirect losses arising from use of this report. Any investment decision should depend on
the individual circumstances of the investor and be based on specifically engaged investment advice. We therefore strongly advise potential investors to seek independent
professional advice before making any investment decision. Although the information in this report has been obtained from sources that QNBFS believes to be reliable, we have not
independently verified such information and it may not be accurate or complete. QNBFS does not make any representations or warranties as to the accuracy and completeness of the
information it may contain, and declines any liability in that respect. For reports dealing with Technical Analysis, expressed opinions and/or recommendations may be different or
contrary to the opinions/recommendations of QNBFS Fundamental Research as a result of depending solely on the historical technical data (price and volume). QNBFS reserves the
right to amend the views and opinions expressed in this publication at any time. It may also express viewpoints or make investment decisions that differ significantly from, or even
contradict, the views and opinions included in this report. This report may not be reproduced in whole or in part without permission from QNBFS.