The Index managed to breakout and remain above
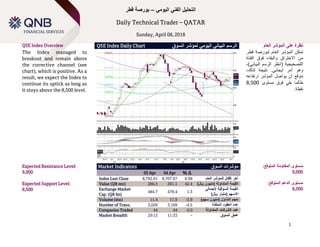
the corrective channel (see chart), which is positive. As a result, we expect the Index to continue its uptick as long as it stays above the 8,500 level.
QNBFS Daily Technical Trader - Qatar for October 18, 2018 التحليل الفني اليوم...QNB Group
The Index managed to break above the 10,000 major psychological level on relatively higher volumes; the main trend remains up and as a result, we expect the Index to continue with its rally.
QNBFS Daily Technical Trader - Qatar for September 10, 2018 التحليل الفني الي...QNB Group
The General Index stabilized as seen from the chart but the main trend remains up. We await a reversal signal against the recent correction to accumulate.
QNBFS Daily Technical Trader - Qatar for November 08, 2018 التحليل الفني اليو...QNB Group
The trend has been up on the Index and seems to be intact. Corrections are possible and can be used to add positions. A solid breakout above the 10,360 would take the index to the 10,550-10,600 levels.
QNBFS Daily Technical Trader - Qatar for April 24, 2018 التحليل الفني اليومي ...QNB Group
An indecision candlestick has
been created yesterday on
the Qatar’s general Index;
traded volumes were also
higher. As a result, we may
see a correction, but we
expect the 9,000 to be a
strong support.
QNBFS Daily Technical Trader - Qatar for July 21 2019 التحليل الفني اليومي لب...QNB Group
The Index started to breakout above the corrective channel and has moved above its moving averages; both actions are favorable, but need to be sustained.
QNBFS Daily Technical Trader - Qatar for April 29, 2019 التحليل الفني اليومي ...QNB Group
The Index continued to go up inside its uptrend channel in the short term, but it remains under the pressure of the rising-wedge formation in the longer term.
QNBFS Daily Technical Trader - Qatar - September 11 2019 التحليل الفني اليومي...QNB Group
The Index started a move above its SMAS, which is a good sign and we may see the Index move to our next expected resistance between the 10,700 and the 10,800 levels.
QNBFS Daily Technical Trader Qatar - April 14, 2020 التحليل الفني اليومي لبور...QNB Group
After the QE Index reached extreme levels, it has moved slightly up. At this stage, however, the Index is clearly lacking direction as the selling pressure remains a strong factor in the next expected move.
QNBFS Daily Technical Trader - Qatar for April 30, 2019 التحليل الفني اليومي ...QNB Group
The Index continued to go up inside its uptrend channel in the short term, but it remains under the pressure of the rising-wedge formation in the longer term.
QNBFS Daily Technical Trader - Qatar for April 16, 2018 التحليل الفني اليومي ...QNB Group
The Index moved slightly down as we expected in the corrective wave. That being said, there is a potential for the Index to reach the 8,700 level, but it remains bullish. Breaking below the level could change our perspective on the Index.
QNBFS Daily Technical Trader - Qatar for July 03, 2019 التحليل الفني اليومي ل...QNB Group
The Index started to breakout above the corrective channel and has moved above its moving averages; both actions are favorable, but need to be sustained.
QNBFS Daily Technical Trader - Qatar for April 21, 2019 التحليل الفني اليومي ...QNB Group
The Index continued to go up inside its uptrend channel in the short term, but it remains under the pressure of the rising-wedge formation in the longer term.
QNBFS Daily Technical Trader - Qatar for April 23, 2018 التحليل الفني اليومي ...QNB Group
The Index remains strong
after it broke above the 9,200
level and we are positive on
the general direction of the
Index. That being said,
corrections are possible and
the 9,000 level is now our
strong support.
QNBFS Daily Technical Trader - Qatar for June 23, 2019 التحليل الفني اليومي ل...QNB Group
The Index started to breakout above the corrective channel and has moved above its moving averages; both actions are favorable, but need to be sustained.
QNBFS Daily Technical Trader - Qatar for June 04 2018 التحليل الفني اليومي لب...QNB Group
The MSCI EM Index rebalancing, which took place last Thursday, has created a strong support level at the 8,730 level (instead of the previous 8,800 level).
QNBFS Daily Technical Trader - Qatar for November 14, 2018 التحليل الفني اليو...QNB Group
The QSE Index declined 1.0% to close at 10,314.6. Losses were led by the Telecoms and Industrials indices, falling 1.8% and 1.1%, respectively. Top losers were Qatar National Cement Company and Medicare Group, falling 3.3% each. Among the top gainers, Mannai Corporation gained 2.2%, while Gulf International Services was up 1.5%.
QNBFS Daily Technical Trader Qatar - April 07, 2020 التحليل الفني اليومي لبور...QNB Group
After the QE Index reached extreme levels, it has moved slightly up. At this stage, however, the Index is clearly lacking direction as the selling pressure remains a strong factor in the next expected move.
QNBFS Daily Technical Trader - Qatar for April 09, 2018 التحليل الفني اليومي ...Aicha El-Mamy
A typical start for the week; no significant change noticed on the Index with significant drop in volumes. We remain positive on the Index especially if the Index breaks above the 8,800 intraday
resistance level.
QNBFS Daily Technical Trader - Qatar for April 10, 2018 التحليل الفني اليومي ...QNB Group
The Index ended Monday’s session with a strong, and positive, move. We remain optimistic and we are watching the 9,000 level closely; a breakout above the mentioned level means further upside would be expected.
QNBFS Daily Technical Trader - Qatar for May 06 2018 التحليل الفني اليومي لبو...QNB Group
The Index reached the 8,800
support; the level is expected
to be tested. Failure to hold
above the mentioned level
means the 8,600 level is our
next possible support.
QNBFS Daily Technical Trader - Qatar for May 20 2018 التحليل الفني اليومي لبو...QNB Group
Even though the Index closed
in the red vs Wednesday’s
close, no significant change
has been noted on it. It
remains trapped between the
9,000 resistance level and the
8,600 daily-support level.
QNBFS Daily Technical Trader - Qatar for April 19, 2018 التحليل الفني اليومي ...QNB Group
The general Index managed to close above the 9,000 level and it is poised to move further up. Increase in traded volumes on the uptick strengthens our bullish outlook on the Index. It should be mentioned that sustaining above the 9,000 level is important to remain bullish.
QNBFS Daily Technical Trader - Qatar for September 05, 2018 التحليل الفني الي...QNB Group
The General Index started a correction on the daily chart but the main trend remains up. We await a reversal signal against the current correction to accumulate. That being said, we stress the points that the main trend remains up.
QNBFS Daily Technical Trader Qatar - October 08 2019 التحليل الفني اليومي لبو...QNB Group
The Index reached the upper side of the flattish, and now testing the moving averages after it broke below the short- term uptrend channel. That being said, a breakout above that side of the flattish channel means a stronger possibility of a bullish move towards the 11,000 mark.
QNBFS Daily Technical Trader - Qatar for June 30, 2019 التحليل الفني اليومي ل...QNB Group
The Index started to breakout above the corrective channel and has moved above its moving averages; both actions are favorable, but need to be sustained.
QNBFS Daily Technical Trader - Qatar for October 21, 2018 التحليل الفني اليوم...QNB Group
The Index managed to break above the 10,000 major psychological level on relatively higher volumes; the main trend remains up and as a result, we expect the Index to continue with its rally.
QNBFS Daily Technical Trader - Qatar for September 09, 2018 التحليل الفني الي...QNB Group
The General Index stabilized as seen from the chart but the main trend remains up. We await a reversal signal against the recent correction to accumulate.
QNBFS Daily Technical Trader - Qatar for August 20 2019 التحليل الفني اليومي ...QNB Group
The general Index continued with its correction and reached the strong support level of 9,600; the Index has also created a bullish reversal candlestick signal at that support. We are expecting a relief rally from here and we update the immediate resistance level to the 10,000 mark.
QNBFS Daily Technical Trader - Qatar for June 11, 2019 التحليل الفني اليومي ل...QNB Group
The Index started to breakout above the corrective channel and has moved above its moving averages; both actions are favorable, but needs to be sustained.
QNBFS Daily Technical Trader - Qatar for April 29, 2018 التحليل الفني اليومي ...QNB Group
The Index closed slightly
down last Thursday and may
continue its correction
towards the 9,000 level. That
being said, if the Index
manages to move and stay
above the 9,170, then the
trend is expected to continue
up.
Similar to QNBFS Daily Technical Trader - Qatar for April 08, 2018 التحليل الفني اليومي لبورصة قطر (20)
QNBFS Daily Market Report April 08, 2018Aicha El-Mamy
The QSE Index rose 1.0% to close at 8,792.9. Gains were led by the Banks & Financial Services and Real Estate indices, gaining 2.0% and 1.8%, respectively.
QNBFS Daily Technical Trader - Qatar for April 05, 2018 التحليل الفني اليومي ...Aicha El-Mamy
The market ended yet another session in the red zone and formed a Doji candle. In our assessment, the Index should rise toward the 9,000 mark in the coming sessions.
QNBFS Daily Technical Trader - Qatar for April 04, 2018 التحليل الفني اليومي ...Aicha El-Mamy
The market edged down marginally by 0.08%. However, the Index is gradually moving towards the upper end of the correction channel. Further confirmation is needed through a breakout from this channel towards the 9,000 level.
QNBFS Daily Technical Trader - Qatar for April 03, 2018 التحليل الفني اليومي ...Aicha El-Mamy
The Index ended another session in the green zone, with the MACD moving towards the zero line. Moreover, the Index sits on the 50SMA, having already crossed the 100SMA and 200SMA support levels.
QNBFS Daily Technical Trader - Qatar for April 01, 2018 التحليل الفني اليومي ...Aicha El-Mamy
The Index remained inside the corrective channel but created a Doji candlestick, which signifies indecision among market participants. That means these participants are looking for a
direction after the recent weakness. The good news is that the Index sits on the 200SMA, which is a strong support level.
QNBFS Daily Technical Trader - Qatar for March 29, 2018 التحليل الفني اليومي ...Aicha El-Mamy
The Index moved inside the previously created corrective channel, and this is an alarming situation. The only positive side of the situation is the Index reached the 200SMA, which may act as a
support level. Further decline on the Index inside the channel signals sharper weakness could be unfolding.
QNBFS Daily Technical Trader - Qatar for March 28, 2018 التحليل الفني اليومي ...Aicha El-Mamy
The Index moved further down but remains above the upper side of the corrective channel. We are a bit concerned because the
MACD indicator is has tilted downwards and remains under the zero line, which means bearish momentum has been in control and may continue further.
QNBFS Daily Technical Trader - Qatar for March 27, 2018 التحليل الفني اليومي ...Aicha El-Mamy
Another day in the red but the general Index remains above the 8,650 points, which is slightly positive. The bulls need to take
control of the situation above or around the mentioned level; sustaining an entry inside the corrective channel means weakness could persist.
QNBFS Daily Technical Trader - Qatar for March 26, 2018 التحليل الفني اليومي ...Aicha El-Mamy
The general Index regressed in the beginning of the week but remains above the upper side of the corrective channel. We expect to see some support around that side which is just above our expected support of the 8,650 mark.
QNBFS Daily Technical Trader - Qatar for March 25, 2018 التحليل الفني اليومي ...Aicha El-Mamy
The market closed down 0.54% from vs the previous session, indicating then weakness has persisted. That been said, the index
remains above the corrective channel seen on the chart, proving the uncertainty seen on the expected direction of the market.
QNBFS Daily Technical Trader - Qatar for March 22, 2018 التحليل الفني اليومي ...Aicha El-Mamy
The Index is giving us conflicting signals, between a possible correction because it could not break above the 9,000 level and the expected upward motion stemming from a breakout above the
corrective channel. Our assessment remains in favor
of the positive momentum, given that the Index breaks and sustains its level above.
the 9,000 mark.
QNBFS Daily Technical Trader - Qatar for March 21, 2018 التحليل الفني اليومي ...Aicha El-Mamy
Another day in the green and the Index flirted with the 9,000 level (6 points away), which is positive. Traded volumes were higher
and as a result, we expect the Index to move above the mentioned level.
QNBFS Daily Technical Trader - Qatar for March 20, 2018 التحليل الفني اليومي ...Aicha El-Mamy
The Index managed to close above the corrective channel
which extended since January. The uptick was accompanied with relatively higher volumes and we are becoming more optimistic for the breakout above the 9,000 level.
QNBFS Daily Technical Trader - Qatar for March 19, 2018 التحليل الفني اليومي ...Aicha El-Mamy
The Index is testing the upper side of the recent correction’s channel; the Index needs to break above it, and preferably above the 9,000 level for the Index to be on the safe side.
QNBFS Daily Technical Trader - Qatar for March 18, 2018 التحليل الفني اليومي ...Aicha El-Mamy
The Index managed to penetrate above the flag continuation pattern last Thursday; it looks positive over the coming session and in the medium term. That been said, it should cross above the psychological level of 9,000 to be on the safe side.
QNBFS Daily Technical Trader - Qatar for March 15, 2018 التحليل الفني اليومي ...Aicha El-Mamy
As we expected, the Index filled the price gap through a drop in yesterday’s session. The good news is that the Index managed to reduce much of its intraday losses and closed slightly lower. That been said, we remains cautious on the Index until it manages to break above the 9,000 resistance level.
QNBFS Daily Technical Trader - Qatar for March 14, 2018 التحليل الفني اليومي ...Aicha El-Mamy
The Index gapped up yesterday but could not reach the 9,000 level. It needs to clear the mentioned level; the 50SMA has been
moving around it, it is also needed to confirm the bullish flag formation. The recent gap could be filled before the breakout.
QNBFS Daily Technical Trader - Qatar for March 13, 2018 التحليل الفني اليومي ...Aicha El-Mamy
The strength of yesterday’s move could mark the end of the recent correction. The Index is bouncing off its 200SMA and that is a strong support to depart from. Further confirmation is needed through a breakout above the 9,000 level, which will clear the other moving averages and to confirm a bullish flag formation.
QNBFS Daily Technical Trader - Qatar for March 08, 2018 التحليل الفني اليومي ...Aicha El-Mamy
The Index is reaching the 8,350 level we have expected all along. The current level happens to be just around the 61.8% Fibonacci retracement of the previous bullish move (which took place between last November 2017 and January 2018). The mentioned retracement could add to strength of the support. However, we await a strong reversal signal on the daily chart before we suggest a rally from the current levels.
QNBFS Daily Technical Trader - Qatar for March 07, 2018 التحليل الفني اليومي ...Aicha El-Mamy
Another day was concluded in the red zone and the MACD is moving below the zero line. We keep our first support level at the 8,350 mark and we await a reversal signal there.
how to sell pi coins effectively (from 50 - 100k pi)DOT TECH
Anywhere in the world, including Africa, America, and Europe, you can sell Pi Network Coins online and receive cash through online payment options.
Pi has not yet been launched on any exchange because we are currently using the confined Mainnet. The planned launch date for Pi is June 28, 2026.
Reselling to investors who want to hold until the mainnet launch in 2026 is currently the sole way to sell.
Consequently, right now. All you need to do is select the right pi network provider.
Who is a pi merchant?
An individual who buys coins from miners on the pi network and resells them to investors hoping to hang onto them until the mainnet is launched is known as a pi merchant.
debuts.
I'll provide you the Telegram username
@Pi_vendor_247
how to sell pi coins in South Korea profitably.DOT TECH
Yes. You can sell your pi network coins in South Korea or any other country, by finding a verified pi merchant
What is a verified pi merchant?
Since pi network is not launched yet on any exchange, the only way you can sell pi coins is by selling to a verified pi merchant, and this is because pi network is not launched yet on any exchange and no pre-sale or ico offerings Is done on pi.
Since there is no pre-sale, the only way exchanges can get pi is by buying from miners. So a pi merchant facilitates these transactions by acting as a bridge for both transactions.
How can i find a pi vendor/merchant?
Well for those who haven't traded with a pi merchant or who don't already have one. I will leave the telegram id of my personal pi merchant who i trade pi with.
Tele gram: @Pi_vendor_247
#pi #sell #nigeria #pinetwork #picoins #sellpi #Nigerian #tradepi #pinetworkcoins #sellmypi
Introduction to Indian Financial System ()Avanish Goel
The financial system of a country is an important tool for economic development of the country, as it helps in creation of wealth by linking savings with investments.
It facilitates the flow of funds form the households (savers) to business firms (investors) to aid in wealth creation and development of both the parties
how to sell pi coins at high rate quickly.DOT TECH
Where can I sell my pi coins at a high rate.
Pi is not launched yet on any exchange. But one can easily sell his or her pi coins to investors who want to hold pi till mainnet launch.
This means crypto whales want to hold pi. And you can get a good rate for selling pi to them. I will leave the telegram contact of my personal pi vendor below.
A vendor is someone who buys from a miner and resell it to a holder or crypto whale.
Here is the telegram contact of my vendor:
@Pi_vendor_247
NO1 Uk Black Magic Specialist Expert In Sahiwal, Okara, Hafizabad, Mandi Bah...Amil Baba Dawood bangali
Contact with Dawood Bhai Just call on +92322-6382012 and we'll help you. We'll solve all your problems within 12 to 24 hours and with 101% guarantee and with astrology systematic. If you want to take any personal or professional advice then also you can call us on +92322-6382012 , ONLINE LOVE PROBLEM & Other all types of Daily Life Problem's.Then CALL or WHATSAPP us on +92322-6382012 and Get all these problems solutions here by Amil Baba DAWOOD BANGALI
#vashikaranspecialist #astrologer #palmistry #amliyaat #taweez #manpasandshadi #horoscope #spiritual #lovelife #lovespell #marriagespell#aamilbabainpakistan #amilbabainkarachi #powerfullblackmagicspell #kalajadumantarspecialist #realamilbaba #AmilbabainPakistan #astrologerincanada #astrologerindubai #lovespellsmaster #kalajaduspecialist #lovespellsthatwork #aamilbabainlahore#blackmagicformarriage #aamilbaba #kalajadu #kalailam #taweez #wazifaexpert #jadumantar #vashikaranspecialist #astrologer #palmistry #amliyaat #taweez #manpasandshadi #horoscope #spiritual #lovelife #lovespell #marriagespell#aamilbabainpakistan #amilbabainkarachi #powerfullblackmagicspell #kalajadumantarspecialist #realamilbaba #AmilbabainPakistan #astrologerincanada #astrologerindubai #lovespellsmaster #kalajaduspecialist #lovespellsthatwork #aamilbabainlahore #blackmagicforlove #blackmagicformarriage #aamilbaba #kalajadu #kalailam #taweez #wazifaexpert #jadumantar #vashikaranspecialist #astrologer #palmistry #amliyaat #taweez #manpasandshadi #horoscope #spiritual #lovelife #lovespell #marriagespell#aamilbabainpakistan #amilbabainkarachi #powerfullblackmagicspell #kalajadumantarspecialist #realamilbaba #AmilbabainPakistan #astrologerincanada #astrologerindubai #lovespellsmaster #kalajaduspecialist #lovespellsthatwork #aamilbabainlahore #Amilbabainuk #amilbabainspain #amilbabaindubai #Amilbabainnorway #amilbabainkrachi #amilbabainlahore #amilbabaingujranwalan #amilbabainislamabad
Resume
• Real GDP growth slowed down due to problems with access to electricity caused by the destruction of manoeuvrable electricity generation by Russian drones and missiles.
• Exports and imports continued growing due to better logistics through the Ukrainian sea corridor and road. Polish farmers and drivers stopped blocking borders at the end of April.
• In April, both the Tax and Customs Services over-executed the revenue plan. Moreover, the NBU transferred twice the planned profit to the budget.
• The European side approved the Ukraine Plan, which the government adopted to determine indicators for the Ukraine Facility. That approval will allow Ukraine to receive a EUR 1.9 bn loan from the EU in May. At the same time, the EU provided Ukraine with a EUR 1.5 bn loan in April, as the government fulfilled five indicators under the Ukraine Plan.
• The USA has finally approved an aid package for Ukraine, which includes USD 7.8 bn of budget support; however, the conditions and timing of the assistance are still unknown.
• As in March, annual consumer inflation amounted to 3.2% yoy in April.
• At the April monetary policy meeting, the NBU again reduced the key policy rate from 14.5% to 13.5% per annum.
• Over the past four weeks, the hryvnia exchange rate has stabilized in the UAH 39-40 per USD range.
what is the best method to sell pi coins in 2024DOT TECH
The best way to sell your pi coins safely is trading with an exchange..but since pi is not launched in any exchange, and second option is through a VERIFIED pi merchant.
Who is a pi merchant?
A pi merchant is someone who buys pi coins from miners and pioneers and resell them to Investors looking forward to hold massive amounts before mainnet launch in 2026.
I will leave the telegram contact of my personal pi merchant to trade pi coins with.
@Pi_vendor_247
NO1 Uk Divorce problem uk all amil baba in karachi,lahore,pakistan talaq ka m...Amil Baba Dawood bangali
Contact with Dawood Bhai Just call on +92322-6382012 and we'll help you. We'll solve all your problems within 12 to 24 hours and with 101% guarantee and with astrology systematic. If you want to take any personal or professional advice then also you can call us on +92322-6382012 , ONLINE LOVE PROBLEM & Other all types of Daily Life Problem's.Then CALL or WHATSAPP us on +92322-6382012 and Get all these problems solutions here by Amil Baba DAWOOD BANGALI
#vashikaranspecialist #astrologer #palmistry #amliyaat #taweez #manpasandshadi #horoscope #spiritual #lovelife #lovespell #marriagespell#aamilbabainpakistan #amilbabainkarachi #powerfullblackmagicspell #kalajadumantarspecialist #realamilbaba #AmilbabainPakistan #astrologerincanada #astrologerindubai #lovespellsmaster #kalajaduspecialist #lovespellsthatwork #aamilbabainlahore#blackmagicformarriage #aamilbaba #kalajadu #kalailam #taweez #wazifaexpert #jadumantar #vashikaranspecialist #astrologer #palmistry #amliyaat #taweez #manpasandshadi #horoscope #spiritual #lovelife #lovespell #marriagespell#aamilbabainpakistan #amilbabainkarachi #powerfullblackmagicspell #kalajadumantarspecialist #realamilbaba #AmilbabainPakistan #astrologerincanada #astrologerindubai #lovespellsmaster #kalajaduspecialist #lovespellsthatwork #aamilbabainlahore #blackmagicforlove #blackmagicformarriage #aamilbaba #kalajadu #kalailam #taweez #wazifaexpert #jadumantar #vashikaranspecialist #astrologer #palmistry #amliyaat #taweez #manpasandshadi #horoscope #spiritual #lovelife #lovespell #marriagespell#aamilbabainpakistan #amilbabainkarachi #powerfullblackmagicspell #kalajadumantarspecialist #realamilbaba #AmilbabainPakistan #astrologerincanada #astrologerindubai #lovespellsmaster #kalajaduspecialist #lovespellsthatwork #aamilbabainlahore #Amilbabainuk #amilbabainspain #amilbabaindubai #Amilbabainnorway #amilbabainkrachi #amilbabainlahore #amilbabaingujranwalan #amilbabainislamabad
how can I sell my pi coins for cash in a pi APPDOT TECH
You can't sell your pi coins in the pi network app. because it is not listed yet on any exchange.
The only way you can sell is by trading your pi coins with an investor (a person looking forward to hold massive amounts of pi coins before mainnet launch) .
You don't need to meet the investor directly all the trades are done with a pi vendor/merchant (a person that buys the pi coins from miners and resell it to investors)
I Will leave The telegram contact of my personal pi vendor, if you are finding a legitimate one.
@Pi_vendor_247
#pi network
#pi coins
#money
The European Unemployment Puzzle: implications from population agingGRAPE
We study the link between the evolving age structure of the working population and unemployment. We build a large new Keynesian OLG model with a realistic age structure, labor market frictions, sticky prices, and aggregate shocks. Once calibrated to the European economy, we quantify the extent to which demographic changes over the last three decades have contributed to the decline of the unemployment rate. Our findings yield important implications for the future evolution of unemployment given the anticipated further aging of the working population in Europe. We also quantify the implications for optimal monetary policy: lowering inflation volatility becomes less costly in terms of GDP and unemployment volatility, which hints that optimal monetary policy may be more hawkish in an aging society. Finally, our results also propose a partial reversal of the European-US unemployment puzzle due to the fact that the share of young workers is expected to remain robust in the US.
USDA Loans in California: A Comprehensive Overview.pptxmarketing367770
USDA Loans in California: A Comprehensive Overview
If you're dreaming of owning a home in California's rural or suburban areas, a USDA loan might be the perfect solution. The U.S. Department of Agriculture (USDA) offers these loans to help low-to-moderate-income individuals and families achieve homeownership.
Key Features of USDA Loans:
Zero Down Payment: USDA loans require no down payment, making homeownership more accessible.
Competitive Interest Rates: These loans often come with lower interest rates compared to conventional loans.
Flexible Credit Requirements: USDA loans have more lenient credit score requirements, helping those with less-than-perfect credit.
Guaranteed Loan Program: The USDA guarantees a portion of the loan, reducing risk for lenders and expanding borrowing options.
Eligibility Criteria:
Location: The property must be located in a USDA-designated rural or suburban area. Many areas in California qualify.
Income Limits: Applicants must meet income guidelines, which vary by region and household size.
Primary Residence: The home must be used as the borrower's primary residence.
Application Process:
Find a USDA-Approved Lender: Not all lenders offer USDA loans, so it's essential to choose one approved by the USDA.
Pre-Qualification: Determine your eligibility and the amount you can borrow.
Property Search: Look for properties in eligible rural or suburban areas.
Loan Application: Submit your application, including financial and personal information.
Processing and Approval: The lender and USDA will review your application. If approved, you can proceed to closing.
USDA loans are an excellent option for those looking to buy a home in California's rural and suburban areas. With no down payment and flexible requirements, these loans make homeownership more attainable for many families. Explore your eligibility today and take the first step toward owning your dream home.
how to swap pi coins to foreign currency withdrawable.DOT TECH
As of my last update, Pi is still in the testing phase and is not tradable on any exchanges.
However, Pi Network has announced plans to launch its Testnet and Mainnet in the future, which may include listing Pi on exchanges.
The current method for selling pi coins involves exchanging them with a pi vendor who purchases pi coins for investment reasons.
If you want to sell your pi coins, reach out to a pi vendor and sell them to anyone looking to sell pi coins from any country around the globe.
Below is the contact information for my personal pi vendor.
Telegram: @Pi_vendor_247
Even tho Pi network is not listed on any exchange yet.
Buying/Selling or investing in pi network coins is highly possible through the help of vendors. You can buy from vendors[ buy directly from the pi network miners and resell it]. I will leave the telegram contact of my personal vendor.
@Pi_vendor_247
QNBFS Daily Technical Trader - Qatar for April 08, 2018 التحليل الفني اليومي لبورصة قطر
1. Technical Spotlight
Sunday, January 14, 2018
1
اليومي الفني التحليل–قطر بورصة
Daily Technical Trader – QATAR
Sunday, April 08, 2018
QSE Index Overview QSE Index Daily Chart السوق لمؤشر اليومي البياني الرسم على نظرةالعام المؤشر
The Index managed to
breakout and remain above
the corrective channel (see
chart), which is positive. As a
result, we expect the Index to
continue its uptick as long as
it stays above the 8,500 level.
تمكنالمؤشرل العامقطر بورصة
مناالختراقوالبقاءفوقالقناة
التصحيحية(انظرالرسمالبياني)،
وهوأمرإيجابي.نتيجةلذلك،
نتوقعأنيواصلالمؤشرارتفاعه
طالمابقيفوقمستوى8,500
نقطة.
Expected Resistance Level:
9,000
Expected Support Level:
8,500
Market Indicators السوق مؤشرات
05 Apr 04 Apr % ∆
Index Last Close 8,792.91 8,707.67 0.98 العام للمؤشر إقفال آخر
Value (QR mn) 286.5 201.1 42.4 )لاير (مليون المتداولة القيمة
Exchange Market
Cap. (QR bn)
484.7 478.4 1.3
السوقية القيمةإلجمالي
االسهم)لاير (مليار
Volume (mn) 11.4 11.9 -3.9 )سهم (مليون التداول حجم
Number of Trans. 3,026 3,169 -4.5 المنفذة العقود عدد
Companies Traded 44 44 0.0 المتداولة الشركات عدد
Market Breadth 29:13 11:33 – السوق عمق
:المتوقع المقاومة مستوى
9,000
:المتوقع الدعم مستوى
8,500
2. 2
VODAFONE QATAR فودافونقطر
Stock Overview Daily Chart البياني الرسماليومي على نظرةالسهم
The name is poised to move
higher on the longer term as
it succeeded to remain above
the downtrend. Moving
averages are pointing
upwards which suggests the
move is going to be strong
upwards. That being said, we
expect the dips to take place
but use these corrections for
accumulation.
يستعدسالسهم عرلالرتفاععلى
المدىا،لطويلحيثنجحفي
البقاءفوقاالالعام السعر تجا
والهابط.حيثتشيرالمتوسطات
المتحركةإلىاالتجاالصعود
السهم على المحتمل،ممايدلعلى
أنالحركةستكونقويةإلى
األعلى.ومعذلك،نتوقعحدوث
انخفاضاتالممكن من سعرية
المدى على شراء كنقاط استغاللها
.الطويل
Expected Target Price:
QR10.00 – QR10.40
A price breakout above
QR9.34 triggers the buy idea.
Suggested Stop-Loss Level:
Discretionary
Last Px. سعراالقفال % ∆ التغير % Volume التداول حجم
9.26 1.20 3,426,600
Resistance/Support Levels والمقاومة الدعم مستويات
Level 1st
األول 2nd
الثاني 3rd
الثالث المستوى
Resistance 9.34 10.00 10.40 مقاومة
Support 8.25 7.80 7.25 دعم
:المتوقعة السعرية األهداف
10.00لاير–10.40لاير
نرجحالشراءفيحالاختراق
السعرفوقمستوى9.34لاير
قطر.
:المقترح الخسارة ايقاف مستوى
حسبمايحددهالمتداول
4. 4
Definitions
Candlestick: A chart that displays the high, low, opening and closing prices for a security in a single period. The body of the candle is made up by
the opening and the closing prices, i.e., the taller the body the greater the range between these two prices and vice versa. A colored candle
denotes a closing price that is lower than the opening price, while a white candle shows the opposite. The candlestick's shadows or wicks show
the period's high and low prices and how they compare to the opening and closing price. In general, the shape of the candle will vary upon the
positions of the period's high, low, opening and closing prices.
Support: A level that could cause more buyers to step in in order to prevent the security from falling or causing the security price to head higher.
Resistance: An inverse of a support level. A resistance area or level could cause more sellers to step in in order to prevent the security from rising
or causing the security price to head lower.
SMA (Simple Moving Average): Is an arithmetic average, which calculates the average price of a security over a defined number of periods and is
thus considered a lagging indicator. SMAs used in our analysis refer to closing prices. In general, SMAs serve many purposes, such as a
smoothing tool, an indicative price direction and potential support/resistance levels.
Market Breadth: Breadth indicates the number of securities that have closed higher vs. the number of decliners in a particular exchange.
MACD (Moving Average Convergence/Divergence): Is a trading indicator, which shows changes in the strength, direction, momentum and
duration of a trend in a stock's price through a collection of three time series calculated from historical closing price data.
RSI (Relative Strength Index): Is a momentum indicator that compares a security’s price gains to its losses for a predetermined number of periods
(we generally use 14 periods). The RSI attempts to point out how a security, in relative terms, is in the overbought/oversold zone. Securities with
a RSI above 70 could be considered as overbought, and below 30 could be considered as oversold.
Pattern/Formation: Is a graphical presentation of a security’s price activity over a certain period of time. Formations come in different shapes
(such as, head & shoulders, triangles, flags, and so on). They can be used to identify potential trends, reversal of trends, price targets, entry and
exit points, etc.
Fibonacci Retracements: Are horizontal lines that indicate expected areas of support/resistance for a security based on a predetermined price
movement. These levels are usually indicated by Fibonacci ratios of 23.6%, 38.2%, 50.0%, 61.8% and 100% from that particular movement.
Fibonacci Pivot and Intraday Support/Resistance: A Pivot Point is generally used to formulate expected future support/resistance levels. From
the base Pivot Point, Fibonacci multiples of the high-low differential are added to form resistance levels and subtracted to form support levels.
5. 5
Contacts
Zaid al-Nafoosi, CMT, CFTe
Senior Research Analyst
Tel: (+974) 4476 6535
zaid.alnafoosi@qnbfs.com.qa
Saugata Sarkar, CFA, CAIA
Head of Research
Tel: (+974) 4476 6534
saugata.sarkar@qnbfs.com.qa
Shahan Keushgerian
Senior Research Analyst
Tel: (+974) 4476 6509
shahan.keushgerian@qnbfs.com.qa
Mohamed Abo Daff
Senior Research Analyst
Tel: (+974) 4476 6589
mohd.abodaff@qnbfs.com.qa
Ahmed El-Khudary
Head of Trading
Tel: (+974) 4476 6533
ahmed.elkhudary@qnbfs.com.qa
Feras al-Sarraj
Head of Sales
Tel: (+974) 4476 6514
feras.alsarraj@qnbfs.com.qa
QNB Financial Services
Contact Center: (+974) 4476 6666
PO Box 24025
Doha, Qatar
Disclaimer and Copyright Notice: This publication has been prepared by QNB Financial Services Co. W.L.L. (“QNBFS”) a wholly-owned subsidiary of Qatar National Bank (Q.P.S.C.)
(“QNB”). QNBFS is regulated by the Qatar Financial Markets Authority and the Qatar Exchange QNB SAQ is regulated by the Qatar Central Bank. This publication expresses the
views and opinions of QNBFS at a given time only. It is not an offer, promotion or recommendation to buy or sell securities or other investments, nor is it intended to constitute legal,
tax, accounting, or financial advice. QNBFS accepts no liability whatsoever for any direct or indirect losses arising from use of this report. Any investment decision should depend on
the individual circumstances of the investor and be based on specifically engaged investment advice. We therefore strongly advise potential investors to seek independent
professional advice before making any investment decision. Although the information in this report has been obtained from sources that QNBFS believes to be reliable, we have not
independently verified such information and it may not be accurate or complete. QNBFS does not make any representations or warranties as to the accuracy and completeness of the
information it may contain, and declines any liability in that respect. For reports dealing with Technical Analysis, expressed opinions and/or recommendations may be different or
contrary to the opinions/recommendations of QNBFS Fundamental Research as a result of depending solely on the historical technical data (price and volume). QNBFS reserves the
right to amend the views and opinions expressed in this publication at any time. It may also express viewpoints or make investment decisions that differ significantly from, or even
contradict, the views and opinions included in this report. This report may not be reproduced in whole or in part without permission from QNBFS.