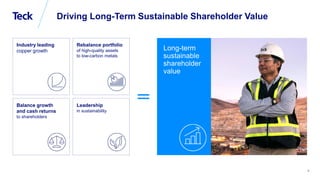
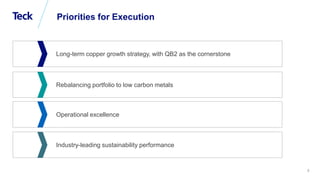
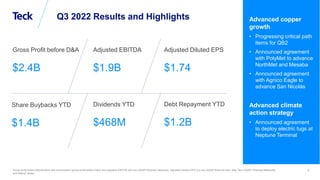
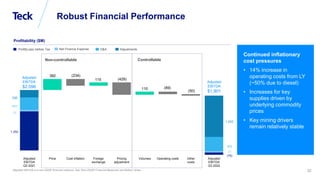
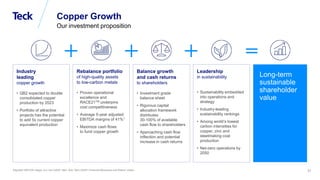
Global Metals and Mining Conference
1
Third Quarter 2022
Results
October 27, 2022
Global Metals and Mining Conference
2
Caution Regarding Forward-Looking Statements
Both these slides and the accompanying oral presentation contain certain forward-looking information and forward-looking statements as defined in applicable securities laws (collectively referred to as forward-looking statements).
These statements relate to future events or our future performance. All statements other than statements of historical fact are forward-looking statements. The use of any of the words “anticipate”, “plan”, “continue”, “estimate”,
“expect”, “may”, “will”, “project”, “predict”, “potential”, “should”, “believe” and similar expressions is intended to identify forward-looking statements. These statements involve known and unknown risks, uncertainties and other factors
that may cause actual results or events to differ materially from those anticipated in such forward-looking statements. These statements speak only as of the date of this presentation.
These forward-looking statements include, but are not limited to, statements concerning: forecast production, including planned outages; forecast operating costs, unit costs, capital investments and other costs; sales forecasts; our
strategies, priorities, objectives and goals; all guidance, including, but not limited to, guidance relating to production, sales and unit cost, capital expenditure and water treatment; future prices and price volatility for copper, zinc,
steelmaking coal, blended bitumen and other products and commodities that we produce and sell, as well as oil, natural gas and petroleum products; the demand for and supply of copper, zinc, steelmaking coal, blended bitumen
and other products and commodities that we produce and sell; the expected restart of production at our Elkview Plant and expected impact of the outage on production volumes; our expectations regarding our QB2 project, including
expectations regarding timing of first production, capital costs, and COVID-19 impacts; our capital investments profile and changes thereto; expectations regarding our copper growth pipeline and copper development projects,
including statements that QB2 is expected to double our consolidated copper production by 2023 and that our portfolio has the potential to add 5x current copper equivalent production; our target to achieve net-zero operations by
2050; and all statements under the subheadings “Looking Forward”. Inherent in forward-looking statements are risks and uncertainties beyond our ability to predict or control, including risks associated with: our operating or capital
plans; the permitting and development of mineral and oil and gas properties such as unusual or unexpected geological formations; the COVID-19 pandemic; unanticipated metallurgical difficulties; permit appeals or other regulatory
processes, ground control problems, adverse weather conditions or process upsets or equipment malfunctions; damage to our reputation; labour disturbances and availability of skilled labour; fluctuations in the market prices of our
principal commodities; changes to the tax and royalty regimes in which we operate; competition for mining and oil and gas properties; lack of access to capital or to markets; mineral and oil and gas reserve estimates; fluctuations in
exchange rates and interest rates, as well as general economic conditions; changes to our credit ratings; our material financing arrangements and our covenants thereunder; climate change, environmental compliance, changes in
environmental legislation and regulation, and changes to our reclamation obligations; procurement of goods and services for our business, projects and operations; non-performance by contractual counterparties; potential disputes
with partners and co-owners; operations in foreign countries; information technology; and tax reassessments and legal proceedings.
Actual results and developments are likely to differ, and may differ materially, from those expressed or implied by the forward-looking statements contained in this presentation. Such statements are based on a number of
assumptions that may prove to be incorrect, including, but not limited to, assumptions regarding: general business and economic conditions; commodity and power prices; the supply and demand for, deliveries of, and the level and
volatility of prices of copper, zinc, steelmaking coal, and blended bitumen and our other metals and minerals, as well as oil, natural gas and other petroleum products; the timing of receipt of permits and other regulatory and
governmental approvals for our development projects and other operations, including mine extensions; our costs of production, and our production and productivity levels, as well as those of our competitors; continuing availability of
water and power resources for our operations; credit market conditions and conditions in financial markets generally; our ability to procure equipment and operating supplies and services in sufficient quantities on a timely basis; the
availability of qualified employees and contractors for our operations, including our new developments and our ability to attract and retain skilled employees; the satisfactory negotiation of collective agreements with unionized
employees; the impact of changes in Canadian-U.S. dollar exchange rates, Canadian dollar-Chilean Peso exchange rates and other foreign exchange rates on our costs; the accuracy of our mineral, steelmaking coal and oil reserve
and resource estimates (including with respect to size, grade and recoverability) and the geological, operational and price assumptions on which these are based; tax benefits and tax rates; the impacts of the COVID-19 pandemic
on our operations and projects and on global markets; and our ongoing relations with our employees and with our business and joint venture partners. Assumptions regarding QB2 include current project assumptions and
assumptions contained in the final feasibility study, as well as there being no further unexpected material and negative impact to the various contractors, suppliers and subcontractors for the QB2 project relating to COVID-19 or
otherwise that would impair their ability to provide goods and services as anticipated. Statements concerning future production costs or volumes are based on numerous assumptions of management regarding operating matters and
on assumptions that demand for products develops as anticipated; that customers and other counterparties perform their contractual obligations; that operating and capital plans will not be disrupted by issues such as mechanical
failure, unavailability of parts and supplies, labour disturbances, COVID-19, interruption in transportation or utilities, or adverse weather conditions; and that there are no material unanticipated variations in the cost of energy or
supplies. Our sustainability goals are based on a number of additional assumptions, including regarding the availability and effectiveness of technologies needed to achieve our sustainability goals and priorities; the availability of
clean energy sources and zero-emissions alternatives for transportation on reasonable terms; our ability to implement new source control or mine design strategies on commercially reasonable terms without impacting production
objectives; our ability to successfully implement our technology and innovation strategy; and the performance of new technologies in accordance with our expectations.
The foregoing list of important factors and assumptions is not exhaustive. Other events or circumstances could cause our actual results to differ materially from those estimated or projected and expressed in, or implied by, our
forward-looking statements. See also the risks and assumptions discussed under “Risk Factors” in our Annual Information Form and in subsequent filings, which can be found under our profile on SEDAR (www.sedar.com) and on
EDGAR (www.sec.gov). Except as required by law, we undertake no obligation to update publicly or otherwise revise any forward-looking statements or the foregoing list of factors, whether as a result of new information or future
events or otherwise.
Global Metals and Mining Conference
3
Jonathan Price
Chief Executive Officer
Global Metals and Mining Conference
4
Industry leading
copper growth
Rebalance portfolio
of high-quality assets
to low-carbon metals
Balance growth
and cash returns
to shareholders
Leadership
in sustainability
Long-term
sustainable
shareholder
value
Driving Long-Term Sustainable Shareholder Value
Global Metals and Mining Conference
5
Priorities for Execution
Rebalancing portfolio to low carbon metals
Operational excellence
Long-term copper growth strategy, with QB2 as the cornerstone
Industry-leading sustainability performance
Global Metals and Mining Conference
6
Sale of Fort Hills Interest
• Announced agreement to sell 21.3% interest in Fort Hills to Suncor Energy for gross proceeds of
approximately $1 billion in cash on October 26th, 2022
• Sale of our energy assets advances our strategy of pursuing industry leading copper growth and
rebalancing our portfolio of high-quality assets to low carbon metals
• Transaction value consistent with the current outlook for the Fort Hills business reflected in
Suncor’s long-range plan
• An after-tax, non-cash impairment charge of $952 million is recorded in Q3 as a result of the
transaction
• Use of proceeds will be reviewed in accordance with Teck’s capital allocation framework in early
2023
Global Metals and Mining Conference
7
Q3 2022 Results and Highlights
Gross Profit before D&A
$2.4B
Adjusted EBITDA
$1.9B
Dividends YTD
$468M
Share Buybacks YTD
$1.4B
Debt Repayment YTD
$1.2B
Adjusted Diluted EPS
$1.74
Advanced copper
growth
• Progressing critical path
items for QB2
• Announced agreement
with PolyMet to advance
NorthMet and Mesaba
• Announced agreement
with Agnico Eagle to
advance San Nicolás
Advanced climate
action strategy
• Announced agreement
to deploy electric tugs at
Neptune Terminal
Gross profit before depreciation and amortization (gross profit before D&A) and adjusted EBITDA are non-GAAP financial measures. Adjusted diluted EPS is a non-GAAP financial ratio. See “Non-GAAP Financial Measures
and Ratios” slides.
Global Metals and Mining Conference
8
Guidance Update
QB2
• Capital cost guidance to US$7.4–7.75B, from US$6.9–7.0B
• QB three-year production to 170–300 kt, from 245–300 kt, with
2023 at the lower end of the guidance range
Steelmaking Coal
• Three-year production to 25–26 Mt, from 26–27 Mt
2023 Capex Outlook
• Still expected to be lower than 2022, but with a smaller
reduction than previously anticipated
Global Metals and Mining Conference
9
Red Conger
President and Chief Operating Officer
Global Metals and Mining Conference
10
Elkview Plant Outage
• Structural failure of plant conveyor belt on
September 20th, 2022
• No injuries as a result of the incident
• Substantially completed the sourcing of
materials and labour required to conduct the
replacement
• Expect to restart production by late
November
• 2022 coal production volumes impacted by
1.5 Mt
Global Metals and Mining Conference
11
Focused on Managing Controllable Costs
• Inflationary pressures increased operating
costs by 14% compared to last year, with
similar pressures on capital costs
• Underlying mining drivers remain relatively
stable
• Realized tangible cost savings and
productivity improvements through
continuous improvement and RACE
programs
Global Metals and Mining Conference
12
Building Capacity for Copper Growth
• Building organizational capacity ahead of next wave of product delivery
• Setting ourselves up with experienced leaders
• Appointed Tyler Mitchelson as SVP, Copper Growth, with broad
responsibility for the execution of Teck’s worldwide copper development
• Efforts from across the business directed towards effective execution of our
copper growth strategy
Global Metals and Mining Conference
13
Main jetty at the Port area, September 2022
Focus remains on system completion and handover
• Completed commissioning of the 220kV transmission line
• Well advanced in commissioning of the pre-treatment area and pre-ops
testing of the reverse osmosis units in the desalination plant
• All sub-systems for Ball Mill No. 1 and SAG Mill No. 1 are in in
pre-operational testing
• Completed the ore stockpile dome, installation of all the in-plant
conveyor belts, and the 12 km long tailings launder
Executing our Copper Growth Strategy Through QB2
Delivering to key milestones as we drive towards first copper
Cost and schedule guidance update
• Revised capital cost guidance is $7.4-7.75B based on foreign
exchange assumptions, cost pressures related to weather and
subsurface conditions, and other risk factors
• Continue to target first copper for late this year; however, if productivity
impacts persist, this will be delayed into January 2023
• First copper production is part of the continuous commissioning plan
for mechanical completion of Line 1, which will be followed by
mechanical completion of Line 2 and ramp-up through 2023
Global Metals and Mining Conference
14
QB2 Photo Tour
September 2022
Pretreatment tanks in commissioning at
the desalination plant
QB2 Port Area
Global Metals and Mining Conference
15
August 2022
QB2 Photo Tour
Overland conveyor and transfer tower
QB2 Crushing and Conveying
Global Metals and Mining Conference
16
August 2022
QB2 Photo Tour
Ore stacker structure and
stockpile dome with concentrator
building in the background
QB2 Concentrator Area
Global Metals and Mining Conference
17
September 2022
QB2 Photo Tour
Grinding mills
QB2 Concentrator Area
Global Metals and Mining Conference
18
September 2022
QB2 Photo Tour
Flotation area
QB2 Concentrator Area
Global Metals and Mining Conference
19
September 2022
QB2 Photo Tour
Concentrate thickener hydrotesting
QB2 Concentrator Area
Global Metals and Mining Conference
20
QB2 Photo Tour
September 2022
12km long Tailings Launder completed
QB2 Tailings Management Facility
Global Metals and Mining Conference
21
Crystal Prystai
Interim Chief Financial Officer
Global Metals and Mining Conference
22
382
115
110
(234)
(429)
(89)
(50)
Adjusted
EBITDA
Q3 2021
Price Cost inflation Foreign
exchange
Pricing
adjustment
Volumes Operating costs Other
costs
Adjusted
EBITDA
Q3 2022
Adjusted EBITDA is a non-GAAP financial measure. See “Non-GAAP Financial Measures and Ratios” slides.
Non-controllable
Robust Financial Performance
Adjusted
EBITDA
$2,096
Adjusted
EBITDA
$1,901
Controllable
D&A
Profitability ($M)
51
(76)
Adjustments
Net Finance Expense
Profit(Loss) before Tax
493
Continued inflationary
cost pressures
• 14% increase in
operating costs from LY
(~50% due to diesel)
• Increases for key
supplies driven by
underlying commodity
prices
• Key mining drivers
remain relatively stable
1,433
256
1,354
55
431
Global Metals and Mining Conference
23
Copper Business Unit
Operating Metrics
Financial Metrics
• Copper prices remained above historic averages, despite
the decline in the quarter
• Lower production at Carmen de Andacollo due to
significant precipitation event in July
• Lower sales volumes as a result of timing of shipments
• Higher unit costs primarily driven by higher diesel,
maintenance and repair, and contractor expenses
Q3 2022 Highlights
• FY2022 production guidance remains unchanged
• 3-year Highland Valley production guidance changed to
110–170 kt from 130–160 kt
• FY2022 net cash unit cost guidance remains unchanged
Looking Forward
Q3 2022 Δ Q3 2021
FY22
Guidance
Realized price US$/lb 3.49 (18)%
Production kt 66 (6)% 273-290
Sales kt 67 (12)%
Total cash unit costs US$/lb 1.96 17% 1.93-2.03
Net cash unit costs US$/lb 1.54 19% 1.48-1.58
Q3 2022 Δ Q3 2021 YTD
Gross revenue $M 725 (23)% 2,628
Gross profit $M 250 (50)% 1,151
EBITDA $M 142 (67)% 875
Capital expenditures
(ex-QB2)
$M 194 56% 491
Capital expenditures
(QB2)
$M 753 11% 2,226
EBITDA is a non-GAAP financial measure. Total cash unit costs per pound and net cash unit costs per pound are non-GAAP ratios. See “Non-GAAP Financial Measures and Ratios” slides.
Global Metals and Mining Conference
24
Operating Metrics
Financial Metrics
• Zinc prices remained above historic averages, despite
the decline in the quarter
• Increased concentrate production at Red Dog
• Lower refined production at Trail due to asset renewal
activities
• Higher unit costs at Red Dog due to increased
consumables and ocean freight costs
Q3 2022 Highlights
• FY2022 zinc production guidance remains unchanged
• Q4 2022 zinc sales expected to be 130–150 kt
• FY2022 refined zinc production guidance lowered to
257–267 Mt from 270–285 Mt
• FY2022 net cash unit cost guidance remains unchanged
Looking Forward
Zinc Business Unit
Q3 2022 Δ Q3 2021
FY22
Guidance
Realized price US$/lb 1.44 6%
Production (concentrate) Kt 158 34% 630-665
Sales (concentrate) Kt 235 45%
Production (refined) Kt 64 (12)% 257-267
Sales (refined) Kt 64 (11)%
Total cash unit costs US$/lb 0.64 14% 0.54-0.59
Net cash unit costs US$/lb 0.37 185% 0.37-0.43
Q3 2022 Δ Q3 2021 YTD
Gross revenue $M 1,262 21% 2,815
Gross profit $M 311 9% 714
EBITDA $M 388 14% 922
Capital expenditures $M 110 22% 218
EBITDA is a non-GAAP financial measure. Total cash unit costs per pound and net cash unit costs per pound are non-GAAP ratios. See “Non-GAAP Financial Measures and Ratios” slides.
Global Metals and Mining Conference
25
Operating Metrics
Financial Metrics
• Steelmaking coal prices remained well above historic
averages, despite the decline in the quarter
• Lower production and sales volumes due to the Elkview
plant outage and labour action at Westshore
• Higher unit costs due to inflationary pressures, with diesel
accounting for 24% of the increase
Q3 2022 Highlights
• FY2022 production guidance decreased to 22.0–22.5 Mt
from 23.5–24.0 Mt
• FY2022 transportation cost guidance changed to
US$46–49/t from US$43–46/t
• Q4 2022 sales expected to be 5.0–5.4 Mt
Looking Forward
Q3 2022 Δ Q3 2021
FY22
Guidance
Realized price US$/t 304 28%
Production Mt 5.7 (5)% 22.0-22.5
Sales Mt 5.6 (5)%
Adj. site cash cost of sales $/t 92 46% 87-92
Transportation costs $/t 48 4% 46-49
Total unit costs $/t 140 21%
Steelmaking Coal Business Unit
Q3 2022 Δ Q3 2021 YTD
Gross revenue $M 2,273 26% 8,733
Gross profit $M 1,236 37% 5,552
EBITDA $M 1,306 4% 6,141
Capital expenditures $M 253 (12)% 757
EBITDA is a non-GAAP financial measure. Adjusted site cash cost of sales per tonne and total unit costs per tonne are non-GAAP ratios. See “Non-GAAP Financial Measures and Ratios” slides.
Global Metals and Mining Conference
26
Operating Metrics
Financial Metrics
• Significant increase in global benchmark prices
compared to Q3 2021
• Ramp up to two-train operations resulted in higher
production, sales volumes, and lower unit costs
• An after-tax, non-cash impairment charge of ~$950M
was recorded in Q3
Q3 2022 Highlights
Energy Business Unit
Q3 2022 Δ Q3 2021 YTD
Gross revenue $M 409 128% 1,312
Gross profit $M 84 279% 320
EBITDA $M (1,119) (826)
Capital expenditures $M 33 14% 91
Q3 2022 Δ Q3 2021
Realized price US$/bbl 73.68 21%
Production Mbbl 3.5 84%
Production bbl/d 37,736 89%
Sales Mbbl 4.5 105%
Adjusted operating costs $/bbl 34.87
Operating netback $/bbl 33.56 1,710%
EBITDA is a non-GAAP financial measure. Adjusted operating costs per barrel and operating netback per barrel are non-GAAP ratios. See “Non-GAAP Financial Measures and Ratios” slides.
Global Metals and Mining Conference
27
1,182
1,023
903
1,325
680
499 667
870
386
463
563
305
1,220 1,643
2,580
2019A 2020A 2021A 2022E
Capital Investments
Capital Investments Profile (C$M)
QB2 (100%) Growth Capitalized Stripping Sustaining
Changes to 2022 Guidance
• QB2 revised guidance of US$7.4–7.75B
• 2022 capex increased by $100–200M as a
result of revised QB2 guidance
Implied QB2 capex of US$0.9–1.3B in 2023
2,900
to
3,000
Global Metals and Mining Conference
28
108
537
350
480
404 399
377
2022
2023
2024
2025
2026
2027
2028
2029
2030
2031
2032
2033
2034
2035
2036
2037
2038
2039
2040
2041
2042
2043
Strong Financial Position
Liquidity1
$8.3B
Net Debt to Adjusted EBITDA2
0.5x
Debt Maturity Ladder2 (US$M)
Strong Balance Sheet
Net debt to adjusted EBITDA is a non-GAAP ratio. See “Non-GAAP Financial Measures and Ratios” slides.
Dividends
$64M
Share Buybacks
$730M
Debt Repayment
$42M
Returns to Shareholders and Debt Repaid in Q3 2022
Dividends
$468M
Share Buybacks
$1.4B
Returns to Shareholders and Debt Repaid in YTD 2022
Debt Repayment
$1.2B
Moody’s
Baa3
Fitch
BBB-
Credit Ratings1
S&P
BBB-
Global Metals and Mining Conference
29
Jonathan Price
Chief Executive Officer
Global Metals and Mining Conference
30
320
61
151
134 43
QB2
(100%)
San
Nicolás
(50%)
QB Mill
Expansion
(100%)
Zafranal
(100%)
NorthMet
(50%)
Galore
Creek
(50%)
Future QB
Expansions
(100%)
Nueva
UniĂłn
(50%)
Mesaba
(50%)
Schaft Creek
(100%)
Unrivaled suite of options diversified
by geography, scale, time to
development and by-products
• Balance growth with returns
to shareholders
• De-risk through integrated technical,
social, environmental and commercial
evaluations
• Prudent optimization of funding
sources
Industry Leading Copper Growth Pipeline
Potential to add ~5x of current copper equivalent production
30
Calculated using asset’s first five full years average annual copper equivalent production. Consolidated (100%) production shown for Quebrada Blanca 2, QB Mill Expansion, Zafranal and Schaft Creek. Attributable production shown for
NorthMet, San Nicolás, Galore Creek, NuevaUnión and Mesaba.
Assumes closing of an agreement with PolyMet to advance their NorthMet project and our Mesaba mineral deposit, and an agreement with Agnico Eagle to advance our San Nicolás project. Closing is subject to customary closing conditions,
including receipt of all of the required regulatory approvals. See Teck’s press releases dated July 20, 2022 and September 16, 2022.
Near Term (2023-2028) Medium Term (2029-2033) Future Potential (2034+)
337
2021 Actual
CuEq
production2
~1.5 Mt
~1.0 Mt
~2.2 Mt
+200%
+350%
+470%
Cu-Au
Cu-Zn
Au-Ag
Cu-Au-Ag
Cu-Ni
PGM-Co
Cu-Mo
Au-Ag
Cu-Ag-Mo
Cu-Ag-Mo
Cu-Au
Ag-Mo
Cu-Ni
PGM-Co
~1.9 Mt
Potential Annual Copper Equivalent Production Growth (kt)1
Global Metals and Mining Conference
31
Industry
leading
copper growth
• QB2 expected to double
consolidated copper
production by 2023
• Portfolio of attractive
projects has the potential
to add 5x current copper
equivalent production
Rebalance portfolio
of high-quality assets
to low-carbon metals
• Proven operational
excellence and
RACE21TM underpins
cost competitiveness
• Average 5-year adjusted
EBITDA margins of 41%1
• Maximize cash flows
to fund copper growth
Balance growth
and cash returns
to shareholders
• Investment grade
balance sheet
• Rigorous capital
allocation framework
distributes
30-100% of available
cash flow to shareholders
• Approaching cash flow
inflection and potential
increase in cash returns
Leadership
in sustainability
• Sustainability embedded
into operations and
strategy
• Industry-leading
sustainability rankings
• Among world’s lowest
carbon intensities for
copper, zinc and
steelmaking coal
production
• Net-zero operations by
2050
Adjusted EBITDA margin is a non-GAAP ratio. See “Non-GAAP Financial Measures and Ratios” slides.
Long-term
sustainable
shareholder
value
Copper Growth
Our investment proposition
Global Metals and Mining Conference
32
Appendix
Global Metals and Mining Conference
33
Production Guidance
2021 Actual
Previous
2022 Guidance
Current
2022 Guidance1
Previous 3-Year
Guidance (2023-2025)
Current 3-Year
Guidance1 (2023-2025)
Copper2,3,4
Highland Valley 130.8 127-133 127-133 130-160 110-170
Antamina 100.2 91-96 91-96 90-95 90-95
Carmen de Andacollo 44.8 45-50 45-50 50-60 50-60
Quebrada Blanca6 11.5 10-11 10-11 245-300 170-300
Total copper6 287.3 273-290 273-290 515-615 420-625
Zinc2,3,5
Red Dog 503.4 540-570 540-570 510-550 510-550
Antamina 104.0 90-95 90-95 80-100 80-100
Total zinc 607.4 630-665 630-665 590-650 590-650
Refined zinc
Trail 279.0 270-285 257-267 295-315 295-315
Steelmaking coal (Mt) 24.6 23.5-24.0 22.0-22.5 26.0-27.0 25.0-26.0
Lead2
Red Dog 97.4 80-90 80-90 85-95 85-95
Molybdenum2,3
(Mlbs)
Highland Valley 1.1 0.8-1.3 0.8-1.3 3.0-5.0 1.0-5.0
Antamina 1.1 1.8-2.2 1.8-2.2 3.0-4.0 3.0-4.0
Quebrada Blanca6 - - - 4.0-13.0 4.0-13.0
Total molybdenum 2.2 2.6-3.5 2.6-3.5 10.0-22.0 8.0-22.0
Production (000’s tonnes except as noted)
Global Metals and Mining Conference
34
Sales and Unit Cost Guidance
Total cash unit costs per pound, net cash unit costs per pound, adjusted site cash cost of sales per tonne and adjusted operating costs per barrel are non-GAAP ratios. See “Non-GAAP Financial Measures and Ratios” slides.
Q3 2022
Actual
Q4 2022
Guidance1
Zinc in concentrate
Red Dog (kt) 235 130-150
Steelmaking coal (Mt) 5.6 5.0-5.4
2021 Actual
Previous
2022 Guidance
Current
2022 Guidance1
Copper2
(US$/lb)
Total cash unit costs 1.80 1.93-2.03 1.93-2.03
Net cash unit costs 1.39 1.48-1.58 1.48-1.58
Zinc3
(US$/lb)
Total cash unit costs 0.56 0.54-0.59 0.54-0.59
Net cash unit costs 0.30 0.37-0.43 0.37-0.43
Steelmaking coal (C$/tonne)
Adjusted site cash cost of sales 65 87-92 87-92
Transportation costs 44 43-46 46-49
Sales Unit Costs
Global Metals and Mining Conference
35
2021 Actual
Previous 2022
Guidance
Current 2022
Guidance1
Sustaining
Copper $ 184 $ 340 $ 340
Zinc 154 190 190
Steelmaking coal2 475 650 650
Energy5 80 140 90
Corporate 10 5 5
$ 903 $ 1,325 $ 1,275
Growth3
Copper4 $ 103 $ 235 $ 235
Zinc 14 35 35
Steelmaking coal 440 35 35
Energy 3 – –
Corporate 3 – –
$ 563 $ 305 $ 305
Total
Copper $ 287 $ 575 $ 575
Zinc 168 225 225
Steelmaking coal 915 685 685
Energy 83 140 90
Corporate 13 5 5
$ 1,466 $ 1,630 $ 1,580
Capital Expenditures Guidance
Sustaining and Growth Capital Sustaining and Growth Capital (cont.)
Capitalized Stripping
2021 Actual
Previous 2022
Guidance
Current 2022
Guidance1
Total sustaining and growth $ 1,466 $ 1,630 $ 1,580
QB2 capital expenditures 2,580 2,700 - 2,900 2,900–3,000
Total before SMM/SC contributions 4,046 4,330-4,530 4,480–4,580
Estimated SMM/SC contributions
to capital expenditures
(401) (800)-(860) (860)-(890)
Estimated QB2 project financing
draw to capital expenditures
(1,376) (315) (315)
Total, net of partner contributions
and project financing
$ 2,269 $ 3,215-3,355 $ 3,305-3,375
2021 Actual
Previous 2022
Guidance
Current 2022
Guidance1
Capitalized Stripping
Copper $ 207 $ 250 $ 250
Zinc 91 90 90
Steelmaking coal 369 530 530
$ 667 $ 870 $ 870
Teck’s share in C$ millions, except as noted
Global Metals and Mining Conference
36
(C$ millions, unless otherwise noted)
2021
Actual
Previous 2022
Guidance
Current 2022
Guidance1
3-Year
Guidance1
(2022-2024)
Long-Term
Guidance1,3
(C$/tonne)
Capital Expenditures
Sustaining capital (water management and water treatment, including
October 2020 direction issued by Environment and Climate Change
Canada)2
$ 226 $ 200 $ 200 $ 650-750 $ 2.00
Operating Costs
Operating costs associated with water treatment (C$/tonne) $ 0.75 – – $ 3.00
Steelmaking Coal Capital Expenditures and Operating Costs Related to Water Treatment
Water Treatment Guidance
Global Metals and Mining Conference
37
Sensitivities
2022 Mid-Range
Production Estimates2 Changes
Estimated Effect of Change on
Profit Attributable to Shareholders3
($ in millions)
Estimated Effect
on EBITDA3
($ in millions)
US$ exchange C$0.01 $ 67 $ 103
Copper (kt) 281.5 US$0.01/lb 4 7
Zinc (kt)4 909.5 US$0.01/lb 9 12
Steelmaking Coal (Mt) 22.25 US$1/t 17 27
WTI5 US$1/bbl 3 5
Sensitivity of our Annualized Profit Attributable to Shareholders and EBITDA1
EBITDA is a non-GAAP financial measure. See “Non-GAAP Financial Measures and Ratios” slides.
Global Metals and Mining Conference
38
Settlement Pricing Adjustments
Outstanding at
September 30, 2022
Outstanding at
June 30, 2022
Quarterly
Pricing
Adjustments
Mlbs US$/lb Mlbs US$/lb C$M
Copper 196 $ 3.46 174 $ 3.75 $ (66)
Zinc 411 1.36 118 1.44 (46)
Steelmaking Coal (191)
Other (12)
Total $ (315)
Simplified Settlement Pricing Adjustment Model for Base Metals (Pre-tax settlement pricing adjustment in C$M)
Global Metals and Mining Conference
39
Endnotes
Slide 28: Strong Financial Position
1. As at October 26, 2022.
2. As at September 30, 2022.
Slide 30: Industry Leading Copper Growth Pipeline
1. CuEq calcs use US$3.50/lb Cu, US$1.15/lb Zn, US$10.00/lb Mo, US$8.00/lb Ni, US$21.50/lb Co, US$1,550/oz Au,
US$20.00/oz Ag, US$1,100/oz Pt and US$1,450/oz Pd.
2. 2021 actual includes Antamina, Andacollo, Highland Valley, and Quebrada Blanca. Excludes Highland Valley Copper and
Antamina mine life extensions. Excludes Highland Valley Copper and Antamina mine life extensions. 2021 actual copper
equivalent production was previously reported as 345kt using metal prices of US$3.39/lb Cu, US$1.32/lb Zn, US$9.44/lb Mo,
US$7.53/lb Ni, US$20.59/lb Co, US$1,602/oz Au, US$21.07/oz Ag, US$1,103/oz Pt and US$1,429/oz Pd. 2021 actual copper
equivalent production assuming metal price assumptions mentioned in Endnotes 1 returned 337kt.
Slide 31: Copper Growth
1. Five years from January 1, 2017 to December 31, 2021.
Slide 33: Production Guidance
1. As at October 26, 2022. See Teck’s Q3 2022 press release for further details.
2. Metal contained in concentrate.
3. We include 100% of production and sales from our Quebrada Blanca and Carmen de Andacollo mines in our production and
sales volumes, even though we do not own 100% of these operations, because we fully consolidate their results in our financial
statements. We include 22.5% of production and sales from Antamina, representing our proportionate ownership interest.
4. Copper production includes cathode production at Quebrada Blanca and Carmen de Andacollo.
5. Total zinc includes co-product zinc production from our 22.5% proportionate interest in Antamina.
6. 2022 guidance excludes production from Quebrada Blanca concentrate production. Three-year guidance 2023—2025 includes
Quebrada Blanca concentrate production.
Slide 34: Sales and Unit Cost Guidance
1. As at October 26, 2022. See Teck’s Q3 2022 press release for further details.
2. Copper unit costs are reported in U.S. dollars per payable pound of metal contained in concentrate. Copper net cash unit costs
include adjusted cash cost of sales and smelter processing charges, less cash margins for by-products including co-products.
Guidance for 2022 assumes a zinc price of US$1.57 per pound, a molybdenum price of US$18.00 per pound, a silver price of
US$22 per ounce, a gold price of US$1,800 per ounce and a Canadian/U.S. dollar exchange rate of $1.29.
3. Zinc unit costs are reported in U.S. dollars per payable pound of metal contained in concentrate. Zinc net cash unit costs are
mine costs including adjusted cash cost of sales and smelter processing charges, less cash margins for by-products. Guidance
for 2022 assumes a lead price of US$0.88 per pound, a silver price of US$22 per ounce and a Canadian/U.S. dollar exchange
rate of $1.29. By-products include both by-products and co-products.
Slide 35: Capital Expenditures Guidance
1. As at October 26, 2022. See Teck’s Q3 2022 press release for further details.
2. Steelmaking coal 2022 sustaining capital guidance includes $200 million of water treatment capital. 2021 includes $226 million
of water treatment capital.
3. Growth capital expenditures include RACE capital expenditures for 2022 of $50 million, of which $10 million relates to copper,
$5 million relates to zinc, and $35 million relates to steelmaking coal.
4. Copper growth capital guidance for 2022 includes studies for HVC 2040, Antamina, QBME, Zafranal, San Nicolás and Galore
Creek. Copper sustaining capital guidance for 2022 includes Quebrada Blanca concentrate operations.
5. Energy capital guidance is to September 30, 2022.
Slide 36: Water Treatment Guidance
1. As at October 26, 2022. See Teck’s Q3 2022 press release for further details.
2. The 2022 portion is included in 2022 guidance. See Teck’s Q3 2022 press release for further details on the October 2020
Direction issued by Environment and Climate Change Canada.
3. Assumes 21 million tonnes in 2020 and 27 million tonnes long term.
Slide 37: Sensitivities
1. As at October 26, 2022. The sensitivity of our annualized profit(loss) attributable to shareholders and EBITDA to changes in the
Canadian/U.S. dollar exchange rate and commodity prices, before pricing adjustments, based on our current balance sheet, our
2022 mid-range production estimates, current commodity prices and a Canadian/U.S. dollar exchange rate of $1.30.
2. All production estimates are subject to change based on market and operating conditions.
3. The effect on our profit(loss) attributable to shareholders and on EBITDA of commodity price and exchange rate movements will
vary from quarter to quarter depending on sales volumes. Our estimate of the sensitivity of profit and EBITDA to changes in the
U.S. dollar exchange rate is sensitive to commodity price assumptions.
4. Zinc includes 262,000 tonnes of refined zinc and 647,500 tonnes of zinc contained in concentrate.
5. Our WTI oil price sensitivity takes into account the change in operating costs across our business units, as our operations use a
significant amount of diesel fuel.
Global Metals and Mining Conference
40
Non-GAAP Financial
Measures and Ratios
Global Metals and Mining Conference
41
Non-GAAP Financial Measures and Ratios
Our financial results are prepared in accordance with International Financial Reporting Standards (IFRS) as issued by the International Accounting Standards Board. This presentation includes reference to certain non-GAAP financial measures and
non-GAAP ratios, which are not measures recognized under IFRS, do not have a standardized meaning prescribed by IFRS and may not be comparable to similar financial measures or ratios disclosed by other issuers. These financial measures
and ratios have been derived from our financial statements and applied on a consistent basis as appropriate. We disclose these financial measures and ratios because we believe they assist readers in understanding the results of our operations
and financial position and provide further information about our financial results to investors. These measures should not be considered in isolation or used in substitute for other measures of performance prepared in accordance with IFRS. For more
information on our use of non-GAAP financial measures and ratios, see the section titled “Use of Non-GAAP Financial Measures and Ratios” in our most recent Management Discussion & Analysis, which is incorporated by reference herein and is
available on SEDAR at www.sedar.com. Additional information on certain non-GAAP ratios is below.
Non-GAAP Ratios
Adjusted EBITDA margins – Adjusted EBITDA margins are Adjusted EBITDA, divided by revenue. There is no similar financial measure in our financial statements with which to compare. Adjusted EBITDA is a non-GAAP financial measure. We
believe this measure assists us and readers to compare margins on a percentage basis among our business units.
Adjusted site cash cost of sales per tonne – Adjusted site cash cost of sales per tonne for our steelmaking coal operations is defined as the cost of the product as it leaves the mine excluding depreciation and amortization charges, out-bound
transportation costs and any one-time collective agreement charges and inventory write-down provisions.
Total cash unit costs per pound – Total cash unit costs per pound for our copper and zinc operations includes adjusted cash costs of sales, as described below, plus the smelter and refining charges added back in determining adjusted revenue.
This presentation allows a comparison of total cash unit costs, including smelter charges, to the underlying price of copper or zinc in order to assess the margin for the mine on a per unit basis.
Net cash unit costs per pound – Net cash unit costs of principal product per pound, after deducting co-product and by-product margins, are also a common industry measure. By deducting the co- and by-product margin per unit of the principal
product, the margin for the mine on a per unit basis may be presented in a single metric for comparison to other operations.
Unit costs per tonne - Unit costs per tonne for our steelmaking coal operations are total cost of goods sold, divided by tonnes sold in the period, excluding depreciation and amortization charges. We include this information as it is frequently
requested by investors and investment analysts who use it to assess our cost structure and margins and compare it to similar information provided by many companies in the industry.
Adjusted operating costs per barrel – Adjusted operating costs per barrel for our energy business unit is defined as the costs of product as it leaves the mine, excluding depreciation and amortization charges, cost of diluent for blending to
transport our bitumen by pipeline, cost of non-proprietary product purchased and transportation costs of our product and non-proprietary product and any one-time collective agreement charges or inventory write-down provisions.
Operating netback per barrel – Operating netback per barrel in our energy business unit is calculated as blended bitumen sales revenue net of diluent expenses (also referred to as bitumen price realized), less Crown royalties, transportation and
operating expenses divided by barrels of bitumen sold. We include this information as investors and investment analysts use it to measure our profitability on a per barrel basis and compare it to similar information provided by other companies in the
oil sands industry.
Net debt to adjusted EBITDA ratio – Net debt to adjusted EBITDA ratio is net debt divided by adjusted EBITDA for the twelve months ended at the reporting period, expressed as the number of times adjusted EBITDA needs to be earned to repay
the net debt.
Adjusted diluted earnings per share – Adjusted diluted earnings per share is adjusted profit attributable to shareholders divided by average number of fully diluted shares in a period.
Global Metals and Mining Conference
42
Reconciliation of Segment EBITDA
Reconciliation between Segmented Profit and Segmented EBITDA1
EBITDA is a non-GAAP financial measure. See “Non-GAAP Financial Measures and Ratios” slides.
3 months ending September 30, 2022 Copper Zinc
Steelmaking
Coal Energy Corporate Total
Profit (Loss) before Taxes $M (55) 275 1,040 (1,160) (176) (76)
Net finance expense $M 89 8 21 6 (73) 51
Depreciation and amortization $M 108 105 245 35 - 493
Segmented EBITDA $M 142 388 1,306 (1,119) (249) 468
9 months ending September 30, 2022 Copper Zinc
Steelmaking
Coal Energy Corporate Total
Profit (Loss) before Taxes $M 390 691 5,309 (949) (404) 5,037
Net finance expense $M 163 30 65 19 (131) 146
Depreciation and amortization $M 322 201 767 104 1,394
Segmented EBITDA $M 875 922 6,141 (826) (535) 6,577

Q3 2022 Financial Report Presentation Slides

  • 1.
    Global Metals andMining Conference 1 Third Quarter 2022 Results October 27, 2022
  • 2.
    Global Metals andMining Conference 2 Caution Regarding Forward-Looking Statements Both these slides and the accompanying oral presentation contain certain forward-looking information and forward-looking statements as defined in applicable securities laws (collectively referred to as forward-looking statements). These statements relate to future events or our future performance. All statements other than statements of historical fact are forward-looking statements. The use of any of the words “anticipate”, “plan”, “continue”, “estimate”, “expect”, “may”, “will”, “project”, “predict”, “potential”, “should”, “believe” and similar expressions is intended to identify forward-looking statements. These statements involve known and unknown risks, uncertainties and other factors that may cause actual results or events to differ materially from those anticipated in such forward-looking statements. These statements speak only as of the date of this presentation. These forward-looking statements include, but are not limited to, statements concerning: forecast production, including planned outages; forecast operating costs, unit costs, capital investments and other costs; sales forecasts; our strategies, priorities, objectives and goals; all guidance, including, but not limited to, guidance relating to production, sales and unit cost, capital expenditure and water treatment; future prices and price volatility for copper, zinc, steelmaking coal, blended bitumen and other products and commodities that we produce and sell, as well as oil, natural gas and petroleum products; the demand for and supply of copper, zinc, steelmaking coal, blended bitumen and other products and commodities that we produce and sell; the expected restart of production at our Elkview Plant and expected impact of the outage on production volumes; our expectations regarding our QB2 project, including expectations regarding timing of first production, capital costs, and COVID-19 impacts; our capital investments profile and changes thereto; expectations regarding our copper growth pipeline and copper development projects, including statements that QB2 is expected to double our consolidated copper production by 2023 and that our portfolio has the potential to add 5x current copper equivalent production; our target to achieve net-zero operations by 2050; and all statements under the subheadings “Looking Forward”. Inherent in forward-looking statements are risks and uncertainties beyond our ability to predict or control, including risks associated with: our operating or capital plans; the permitting and development of mineral and oil and gas properties such as unusual or unexpected geological formations; the COVID-19 pandemic; unanticipated metallurgical difficulties; permit appeals or other regulatory processes, ground control problems, adverse weather conditions or process upsets or equipment malfunctions; damage to our reputation; labour disturbances and availability of skilled labour; fluctuations in the market prices of our principal commodities; changes to the tax and royalty regimes in which we operate; competition for mining and oil and gas properties; lack of access to capital or to markets; mineral and oil and gas reserve estimates; fluctuations in exchange rates and interest rates, as well as general economic conditions; changes to our credit ratings; our material financing arrangements and our covenants thereunder; climate change, environmental compliance, changes in environmental legislation and regulation, and changes to our reclamation obligations; procurement of goods and services for our business, projects and operations; non-performance by contractual counterparties; potential disputes with partners and co-owners; operations in foreign countries; information technology; and tax reassessments and legal proceedings. Actual results and developments are likely to differ, and may differ materially, from those expressed or implied by the forward-looking statements contained in this presentation. Such statements are based on a number of assumptions that may prove to be incorrect, including, but not limited to, assumptions regarding: general business and economic conditions; commodity and power prices; the supply and demand for, deliveries of, and the level and volatility of prices of copper, zinc, steelmaking coal, and blended bitumen and our other metals and minerals, as well as oil, natural gas and other petroleum products; the timing of receipt of permits and other regulatory and governmental approvals for our development projects and other operations, including mine extensions; our costs of production, and our production and productivity levels, as well as those of our competitors; continuing availability of water and power resources for our operations; credit market conditions and conditions in financial markets generally; our ability to procure equipment and operating supplies and services in sufficient quantities on a timely basis; the availability of qualified employees and contractors for our operations, including our new developments and our ability to attract and retain skilled employees; the satisfactory negotiation of collective agreements with unionized employees; the impact of changes in Canadian-U.S. dollar exchange rates, Canadian dollar-Chilean Peso exchange rates and other foreign exchange rates on our costs; the accuracy of our mineral, steelmaking coal and oil reserve and resource estimates (including with respect to size, grade and recoverability) and the geological, operational and price assumptions on which these are based; tax benefits and tax rates; the impacts of the COVID-19 pandemic on our operations and projects and on global markets; and our ongoing relations with our employees and with our business and joint venture partners. Assumptions regarding QB2 include current project assumptions and assumptions contained in the final feasibility study, as well as there being no further unexpected material and negative impact to the various contractors, suppliers and subcontractors for the QB2 project relating to COVID-19 or otherwise that would impair their ability to provide goods and services as anticipated. Statements concerning future production costs or volumes are based on numerous assumptions of management regarding operating matters and on assumptions that demand for products develops as anticipated; that customers and other counterparties perform their contractual obligations; that operating and capital plans will not be disrupted by issues such as mechanical failure, unavailability of parts and supplies, labour disturbances, COVID-19, interruption in transportation or utilities, or adverse weather conditions; and that there are no material unanticipated variations in the cost of energy or supplies. Our sustainability goals are based on a number of additional assumptions, including regarding the availability and effectiveness of technologies needed to achieve our sustainability goals and priorities; the availability of clean energy sources and zero-emissions alternatives for transportation on reasonable terms; our ability to implement new source control or mine design strategies on commercially reasonable terms without impacting production objectives; our ability to successfully implement our technology and innovation strategy; and the performance of new technologies in accordance with our expectations. The foregoing list of important factors and assumptions is not exhaustive. Other events or circumstances could cause our actual results to differ materially from those estimated or projected and expressed in, or implied by, our forward-looking statements. See also the risks and assumptions discussed under “Risk Factors” in our Annual Information Form and in subsequent filings, which can be found under our profile on SEDAR (www.sedar.com) and on EDGAR (www.sec.gov). Except as required by law, we undertake no obligation to update publicly or otherwise revise any forward-looking statements or the foregoing list of factors, whether as a result of new information or future events or otherwise.
  • 3.
    Global Metals andMining Conference 3 Jonathan Price Chief Executive Officer
  • 4.
    Global Metals andMining Conference 4 Industry leading copper growth Rebalance portfolio of high-quality assets to low-carbon metals Balance growth and cash returns to shareholders Leadership in sustainability Long-term sustainable shareholder value Driving Long-Term Sustainable Shareholder Value
  • 5.
    Global Metals andMining Conference 5 Priorities for Execution Rebalancing portfolio to low carbon metals Operational excellence Long-term copper growth strategy, with QB2 as the cornerstone Industry-leading sustainability performance
  • 6.
    Global Metals andMining Conference 6 Sale of Fort Hills Interest • Announced agreement to sell 21.3% interest in Fort Hills to Suncor Energy for gross proceeds of approximately $1 billion in cash on October 26th, 2022 • Sale of our energy assets advances our strategy of pursuing industry leading copper growth and rebalancing our portfolio of high-quality assets to low carbon metals • Transaction value consistent with the current outlook for the Fort Hills business reflected in Suncor’s long-range plan • An after-tax, non-cash impairment charge of $952 million is recorded in Q3 as a result of the transaction • Use of proceeds will be reviewed in accordance with Teck’s capital allocation framework in early 2023
  • 7.
    Global Metals andMining Conference 7 Q3 2022 Results and Highlights Gross Profit before D&A $2.4B Adjusted EBITDA $1.9B Dividends YTD $468M Share Buybacks YTD $1.4B Debt Repayment YTD $1.2B Adjusted Diluted EPS $1.74 Advanced copper growth • Progressing critical path items for QB2 • Announced agreement with PolyMet to advance NorthMet and Mesaba • Announced agreement with Agnico Eagle to advance San Nicolás Advanced climate action strategy • Announced agreement to deploy electric tugs at Neptune Terminal Gross profit before depreciation and amortization (gross profit before D&A) and adjusted EBITDA are non-GAAP financial measures. Adjusted diluted EPS is a non-GAAP financial ratio. See “Non-GAAP Financial Measures and Ratios” slides.
  • 8.
    Global Metals andMining Conference 8 Guidance Update QB2 • Capital cost guidance to US$7.4–7.75B, from US$6.9–7.0B • QB three-year production to 170–300 kt, from 245–300 kt, with 2023 at the lower end of the guidance range Steelmaking Coal • Three-year production to 25–26 Mt, from 26–27 Mt 2023 Capex Outlook • Still expected to be lower than 2022, but with a smaller reduction than previously anticipated
  • 9.
    Global Metals andMining Conference 9 Red Conger President and Chief Operating Officer
  • 10.
    Global Metals andMining Conference 10 Elkview Plant Outage • Structural failure of plant conveyor belt on September 20th, 2022 • No injuries as a result of the incident • Substantially completed the sourcing of materials and labour required to conduct the replacement • Expect to restart production by late November • 2022 coal production volumes impacted by 1.5 Mt
  • 11.
    Global Metals andMining Conference 11 Focused on Managing Controllable Costs • Inflationary pressures increased operating costs by 14% compared to last year, with similar pressures on capital costs • Underlying mining drivers remain relatively stable • Realized tangible cost savings and productivity improvements through continuous improvement and RACE programs
  • 12.
    Global Metals andMining Conference 12 Building Capacity for Copper Growth • Building organizational capacity ahead of next wave of product delivery • Setting ourselves up with experienced leaders • Appointed Tyler Mitchelson as SVP, Copper Growth, with broad responsibility for the execution of Teck’s worldwide copper development • Efforts from across the business directed towards effective execution of our copper growth strategy
  • 13.
    Global Metals andMining Conference 13 Main jetty at the Port area, September 2022 Focus remains on system completion and handover • Completed commissioning of the 220kV transmission line • Well advanced in commissioning of the pre-treatment area and pre-ops testing of the reverse osmosis units in the desalination plant • All sub-systems for Ball Mill No. 1 and SAG Mill No. 1 are in in pre-operational testing • Completed the ore stockpile dome, installation of all the in-plant conveyor belts, and the 12 km long tailings launder Executing our Copper Growth Strategy Through QB2 Delivering to key milestones as we drive towards first copper Cost and schedule guidance update • Revised capital cost guidance is $7.4-7.75B based on foreign exchange assumptions, cost pressures related to weather and subsurface conditions, and other risk factors • Continue to target first copper for late this year; however, if productivity impacts persist, this will be delayed into January 2023 • First copper production is part of the continuous commissioning plan for mechanical completion of Line 1, which will be followed by mechanical completion of Line 2 and ramp-up through 2023
  • 14.
    Global Metals andMining Conference 14 QB2 Photo Tour September 2022 Pretreatment tanks in commissioning at the desalination plant QB2 Port Area
  • 15.
    Global Metals andMining Conference 15 August 2022 QB2 Photo Tour Overland conveyor and transfer tower QB2 Crushing and Conveying
  • 16.
    Global Metals andMining Conference 16 August 2022 QB2 Photo Tour Ore stacker structure and stockpile dome with concentrator building in the background QB2 Concentrator Area
  • 17.
    Global Metals andMining Conference 17 September 2022 QB2 Photo Tour Grinding mills QB2 Concentrator Area
  • 18.
    Global Metals andMining Conference 18 September 2022 QB2 Photo Tour Flotation area QB2 Concentrator Area
  • 19.
    Global Metals andMining Conference 19 September 2022 QB2 Photo Tour Concentrate thickener hydrotesting QB2 Concentrator Area
  • 20.
    Global Metals andMining Conference 20 QB2 Photo Tour September 2022 12km long Tailings Launder completed QB2 Tailings Management Facility
  • 21.
    Global Metals andMining Conference 21 Crystal Prystai Interim Chief Financial Officer
  • 22.
    Global Metals andMining Conference 22 382 115 110 (234) (429) (89) (50) Adjusted EBITDA Q3 2021 Price Cost inflation Foreign exchange Pricing adjustment Volumes Operating costs Other costs Adjusted EBITDA Q3 2022 Adjusted EBITDA is a non-GAAP financial measure. See “Non-GAAP Financial Measures and Ratios” slides. Non-controllable Robust Financial Performance Adjusted EBITDA $2,096 Adjusted EBITDA $1,901 Controllable D&A Profitability ($M) 51 (76) Adjustments Net Finance Expense Profit(Loss) before Tax 493 Continued inflationary cost pressures • 14% increase in operating costs from LY (~50% due to diesel) • Increases for key supplies driven by underlying commodity prices • Key mining drivers remain relatively stable 1,433 256 1,354 55 431
  • 23.
    Global Metals andMining Conference 23 Copper Business Unit Operating Metrics Financial Metrics • Copper prices remained above historic averages, despite the decline in the quarter • Lower production at Carmen de Andacollo due to significant precipitation event in July • Lower sales volumes as a result of timing of shipments • Higher unit costs primarily driven by higher diesel, maintenance and repair, and contractor expenses Q3 2022 Highlights • FY2022 production guidance remains unchanged • 3-year Highland Valley production guidance changed to 110–170 kt from 130–160 kt • FY2022 net cash unit cost guidance remains unchanged Looking Forward Q3 2022 Δ Q3 2021 FY22 Guidance Realized price US$/lb 3.49 (18)% Production kt 66 (6)% 273-290 Sales kt 67 (12)% Total cash unit costs US$/lb 1.96 17% 1.93-2.03 Net cash unit costs US$/lb 1.54 19% 1.48-1.58 Q3 2022 Δ Q3 2021 YTD Gross revenue $M 725 (23)% 2,628 Gross profit $M 250 (50)% 1,151 EBITDA $M 142 (67)% 875 Capital expenditures (ex-QB2) $M 194 56% 491 Capital expenditures (QB2) $M 753 11% 2,226 EBITDA is a non-GAAP financial measure. Total cash unit costs per pound and net cash unit costs per pound are non-GAAP ratios. See “Non-GAAP Financial Measures and Ratios” slides.
  • 24.
    Global Metals andMining Conference 24 Operating Metrics Financial Metrics • Zinc prices remained above historic averages, despite the decline in the quarter • Increased concentrate production at Red Dog • Lower refined production at Trail due to asset renewal activities • Higher unit costs at Red Dog due to increased consumables and ocean freight costs Q3 2022 Highlights • FY2022 zinc production guidance remains unchanged • Q4 2022 zinc sales expected to be 130–150 kt • FY2022 refined zinc production guidance lowered to 257–267 Mt from 270–285 Mt • FY2022 net cash unit cost guidance remains unchanged Looking Forward Zinc Business Unit Q3 2022 Δ Q3 2021 FY22 Guidance Realized price US$/lb 1.44 6% Production (concentrate) Kt 158 34% 630-665 Sales (concentrate) Kt 235 45% Production (refined) Kt 64 (12)% 257-267 Sales (refined) Kt 64 (11)% Total cash unit costs US$/lb 0.64 14% 0.54-0.59 Net cash unit costs US$/lb 0.37 185% 0.37-0.43 Q3 2022 Δ Q3 2021 YTD Gross revenue $M 1,262 21% 2,815 Gross profit $M 311 9% 714 EBITDA $M 388 14% 922 Capital expenditures $M 110 22% 218 EBITDA is a non-GAAP financial measure. Total cash unit costs per pound and net cash unit costs per pound are non-GAAP ratios. See “Non-GAAP Financial Measures and Ratios” slides.
  • 25.
    Global Metals andMining Conference 25 Operating Metrics Financial Metrics • Steelmaking coal prices remained well above historic averages, despite the decline in the quarter • Lower production and sales volumes due to the Elkview plant outage and labour action at Westshore • Higher unit costs due to inflationary pressures, with diesel accounting for 24% of the increase Q3 2022 Highlights • FY2022 production guidance decreased to 22.0–22.5 Mt from 23.5–24.0 Mt • FY2022 transportation cost guidance changed to US$46–49/t from US$43–46/t • Q4 2022 sales expected to be 5.0–5.4 Mt Looking Forward Q3 2022 Δ Q3 2021 FY22 Guidance Realized price US$/t 304 28% Production Mt 5.7 (5)% 22.0-22.5 Sales Mt 5.6 (5)% Adj. site cash cost of sales $/t 92 46% 87-92 Transportation costs $/t 48 4% 46-49 Total unit costs $/t 140 21% Steelmaking Coal Business Unit Q3 2022 Δ Q3 2021 YTD Gross revenue $M 2,273 26% 8,733 Gross profit $M 1,236 37% 5,552 EBITDA $M 1,306 4% 6,141 Capital expenditures $M 253 (12)% 757 EBITDA is a non-GAAP financial measure. Adjusted site cash cost of sales per tonne and total unit costs per tonne are non-GAAP ratios. See “Non-GAAP Financial Measures and Ratios” slides.
  • 26.
    Global Metals andMining Conference 26 Operating Metrics Financial Metrics • Significant increase in global benchmark prices compared to Q3 2021 • Ramp up to two-train operations resulted in higher production, sales volumes, and lower unit costs • An after-tax, non-cash impairment charge of ~$950M was recorded in Q3 Q3 2022 Highlights Energy Business Unit Q3 2022 Δ Q3 2021 YTD Gross revenue $M 409 128% 1,312 Gross profit $M 84 279% 320 EBITDA $M (1,119) (826) Capital expenditures $M 33 14% 91 Q3 2022 Δ Q3 2021 Realized price US$/bbl 73.68 21% Production Mbbl 3.5 84% Production bbl/d 37,736 89% Sales Mbbl 4.5 105% Adjusted operating costs $/bbl 34.87 Operating netback $/bbl 33.56 1,710% EBITDA is a non-GAAP financial measure. Adjusted operating costs per barrel and operating netback per barrel are non-GAAP ratios. See “Non-GAAP Financial Measures and Ratios” slides.
  • 27.
    Global Metals andMining Conference 27 1,182 1,023 903 1,325 680 499 667 870 386 463 563 305 1,220 1,643 2,580 2019A 2020A 2021A 2022E Capital Investments Capital Investments Profile (C$M) QB2 (100%) Growth Capitalized Stripping Sustaining Changes to 2022 Guidance • QB2 revised guidance of US$7.4–7.75B • 2022 capex increased by $100–200M as a result of revised QB2 guidance Implied QB2 capex of US$0.9–1.3B in 2023 2,900 to 3,000
  • 28.
    Global Metals andMining Conference 28 108 537 350 480 404 399 377 2022 2023 2024 2025 2026 2027 2028 2029 2030 2031 2032 2033 2034 2035 2036 2037 2038 2039 2040 2041 2042 2043 Strong Financial Position Liquidity1 $8.3B Net Debt to Adjusted EBITDA2 0.5x Debt Maturity Ladder2 (US$M) Strong Balance Sheet Net debt to adjusted EBITDA is a non-GAAP ratio. See “Non-GAAP Financial Measures and Ratios” slides. Dividends $64M Share Buybacks $730M Debt Repayment $42M Returns to Shareholders and Debt Repaid in Q3 2022 Dividends $468M Share Buybacks $1.4B Returns to Shareholders and Debt Repaid in YTD 2022 Debt Repayment $1.2B Moody’s Baa3 Fitch BBB- Credit Ratings1 S&P BBB-
  • 29.
    Global Metals andMining Conference 29 Jonathan Price Chief Executive Officer
  • 30.
    Global Metals andMining Conference 30 320 61 151 134 43 QB2 (100%) San Nicolás (50%) QB Mill Expansion (100%) Zafranal (100%) NorthMet (50%) Galore Creek (50%) Future QB Expansions (100%) Nueva Unión (50%) Mesaba (50%) Schaft Creek (100%) Unrivaled suite of options diversified by geography, scale, time to development and by-products • Balance growth with returns to shareholders • De-risk through integrated technical, social, environmental and commercial evaluations • Prudent optimization of funding sources Industry Leading Copper Growth Pipeline Potential to add ~5x of current copper equivalent production 30 Calculated using asset’s first five full years average annual copper equivalent production. Consolidated (100%) production shown for Quebrada Blanca 2, QB Mill Expansion, Zafranal and Schaft Creek. Attributable production shown for NorthMet, San Nicolás, Galore Creek, NuevaUnión and Mesaba. Assumes closing of an agreement with PolyMet to advance their NorthMet project and our Mesaba mineral deposit, and an agreement with Agnico Eagle to advance our San Nicolás project. Closing is subject to customary closing conditions, including receipt of all of the required regulatory approvals. See Teck’s press releases dated July 20, 2022 and September 16, 2022. Near Term (2023-2028) Medium Term (2029-2033) Future Potential (2034+) 337 2021 Actual CuEq production2 ~1.5 Mt ~1.0 Mt ~2.2 Mt +200% +350% +470% Cu-Au Cu-Zn Au-Ag Cu-Au-Ag Cu-Ni PGM-Co Cu-Mo Au-Ag Cu-Ag-Mo Cu-Ag-Mo Cu-Au Ag-Mo Cu-Ni PGM-Co ~1.9 Mt Potential Annual Copper Equivalent Production Growth (kt)1
  • 31.
    Global Metals andMining Conference 31 Industry leading copper growth • QB2 expected to double consolidated copper production by 2023 • Portfolio of attractive projects has the potential to add 5x current copper equivalent production Rebalance portfolio of high-quality assets to low-carbon metals • Proven operational excellence and RACE21TM underpins cost competitiveness • Average 5-year adjusted EBITDA margins of 41%1 • Maximize cash flows to fund copper growth Balance growth and cash returns to shareholders • Investment grade balance sheet • Rigorous capital allocation framework distributes 30-100% of available cash flow to shareholders • Approaching cash flow inflection and potential increase in cash returns Leadership in sustainability • Sustainability embedded into operations and strategy • Industry-leading sustainability rankings • Among world’s lowest carbon intensities for copper, zinc and steelmaking coal production • Net-zero operations by 2050 Adjusted EBITDA margin is a non-GAAP ratio. See “Non-GAAP Financial Measures and Ratios” slides. Long-term sustainable shareholder value Copper Growth Our investment proposition
  • 32.
    Global Metals andMining Conference 32 Appendix
  • 33.
    Global Metals andMining Conference 33 Production Guidance 2021 Actual Previous 2022 Guidance Current 2022 Guidance1 Previous 3-Year Guidance (2023-2025) Current 3-Year Guidance1 (2023-2025) Copper2,3,4 Highland Valley 130.8 127-133 127-133 130-160 110-170 Antamina 100.2 91-96 91-96 90-95 90-95 Carmen de Andacollo 44.8 45-50 45-50 50-60 50-60 Quebrada Blanca6 11.5 10-11 10-11 245-300 170-300 Total copper6 287.3 273-290 273-290 515-615 420-625 Zinc2,3,5 Red Dog 503.4 540-570 540-570 510-550 510-550 Antamina 104.0 90-95 90-95 80-100 80-100 Total zinc 607.4 630-665 630-665 590-650 590-650 Refined zinc Trail 279.0 270-285 257-267 295-315 295-315 Steelmaking coal (Mt) 24.6 23.5-24.0 22.0-22.5 26.0-27.0 25.0-26.0 Lead2 Red Dog 97.4 80-90 80-90 85-95 85-95 Molybdenum2,3 (Mlbs) Highland Valley 1.1 0.8-1.3 0.8-1.3 3.0-5.0 1.0-5.0 Antamina 1.1 1.8-2.2 1.8-2.2 3.0-4.0 3.0-4.0 Quebrada Blanca6 - - - 4.0-13.0 4.0-13.0 Total molybdenum 2.2 2.6-3.5 2.6-3.5 10.0-22.0 8.0-22.0 Production (000’s tonnes except as noted)
  • 34.
    Global Metals andMining Conference 34 Sales and Unit Cost Guidance Total cash unit costs per pound, net cash unit costs per pound, adjusted site cash cost of sales per tonne and adjusted operating costs per barrel are non-GAAP ratios. See “Non-GAAP Financial Measures and Ratios” slides. Q3 2022 Actual Q4 2022 Guidance1 Zinc in concentrate Red Dog (kt) 235 130-150 Steelmaking coal (Mt) 5.6 5.0-5.4 2021 Actual Previous 2022 Guidance Current 2022 Guidance1 Copper2 (US$/lb) Total cash unit costs 1.80 1.93-2.03 1.93-2.03 Net cash unit costs 1.39 1.48-1.58 1.48-1.58 Zinc3 (US$/lb) Total cash unit costs 0.56 0.54-0.59 0.54-0.59 Net cash unit costs 0.30 0.37-0.43 0.37-0.43 Steelmaking coal (C$/tonne) Adjusted site cash cost of sales 65 87-92 87-92 Transportation costs 44 43-46 46-49 Sales Unit Costs
  • 35.
    Global Metals andMining Conference 35 2021 Actual Previous 2022 Guidance Current 2022 Guidance1 Sustaining Copper $ 184 $ 340 $ 340 Zinc 154 190 190 Steelmaking coal2 475 650 650 Energy5 80 140 90 Corporate 10 5 5 $ 903 $ 1,325 $ 1,275 Growth3 Copper4 $ 103 $ 235 $ 235 Zinc 14 35 35 Steelmaking coal 440 35 35 Energy 3 – – Corporate 3 – – $ 563 $ 305 $ 305 Total Copper $ 287 $ 575 $ 575 Zinc 168 225 225 Steelmaking coal 915 685 685 Energy 83 140 90 Corporate 13 5 5 $ 1,466 $ 1,630 $ 1,580 Capital Expenditures Guidance Sustaining and Growth Capital Sustaining and Growth Capital (cont.) Capitalized Stripping 2021 Actual Previous 2022 Guidance Current 2022 Guidance1 Total sustaining and growth $ 1,466 $ 1,630 $ 1,580 QB2 capital expenditures 2,580 2,700 - 2,900 2,900–3,000 Total before SMM/SC contributions 4,046 4,330-4,530 4,480–4,580 Estimated SMM/SC contributions to capital expenditures (401) (800)-(860) (860)-(890) Estimated QB2 project financing draw to capital expenditures (1,376) (315) (315) Total, net of partner contributions and project financing $ 2,269 $ 3,215-3,355 $ 3,305-3,375 2021 Actual Previous 2022 Guidance Current 2022 Guidance1 Capitalized Stripping Copper $ 207 $ 250 $ 250 Zinc 91 90 90 Steelmaking coal 369 530 530 $ 667 $ 870 $ 870 Teck’s share in C$ millions, except as noted
  • 36.
    Global Metals andMining Conference 36 (C$ millions, unless otherwise noted) 2021 Actual Previous 2022 Guidance Current 2022 Guidance1 3-Year Guidance1 (2022-2024) Long-Term Guidance1,3 (C$/tonne) Capital Expenditures Sustaining capital (water management and water treatment, including October 2020 direction issued by Environment and Climate Change Canada)2 $ 226 $ 200 $ 200 $ 650-750 $ 2.00 Operating Costs Operating costs associated with water treatment (C$/tonne) $ 0.75 – – $ 3.00 Steelmaking Coal Capital Expenditures and Operating Costs Related to Water Treatment Water Treatment Guidance
  • 37.
    Global Metals andMining Conference 37 Sensitivities 2022 Mid-Range Production Estimates2 Changes Estimated Effect of Change on Profit Attributable to Shareholders3 ($ in millions) Estimated Effect on EBITDA3 ($ in millions) US$ exchange C$0.01 $ 67 $ 103 Copper (kt) 281.5 US$0.01/lb 4 7 Zinc (kt)4 909.5 US$0.01/lb 9 12 Steelmaking Coal (Mt) 22.25 US$1/t 17 27 WTI5 US$1/bbl 3 5 Sensitivity of our Annualized Profit Attributable to Shareholders and EBITDA1 EBITDA is a non-GAAP financial measure. See “Non-GAAP Financial Measures and Ratios” slides.
  • 38.
    Global Metals andMining Conference 38 Settlement Pricing Adjustments Outstanding at September 30, 2022 Outstanding at June 30, 2022 Quarterly Pricing Adjustments Mlbs US$/lb Mlbs US$/lb C$M Copper 196 $ 3.46 174 $ 3.75 $ (66) Zinc 411 1.36 118 1.44 (46) Steelmaking Coal (191) Other (12) Total $ (315) Simplified Settlement Pricing Adjustment Model for Base Metals (Pre-tax settlement pricing adjustment in C$M)
  • 39.
    Global Metals andMining Conference 39 Endnotes Slide 28: Strong Financial Position 1. As at October 26, 2022. 2. As at September 30, 2022. Slide 30: Industry Leading Copper Growth Pipeline 1. CuEq calcs use US$3.50/lb Cu, US$1.15/lb Zn, US$10.00/lb Mo, US$8.00/lb Ni, US$21.50/lb Co, US$1,550/oz Au, US$20.00/oz Ag, US$1,100/oz Pt and US$1,450/oz Pd. 2. 2021 actual includes Antamina, Andacollo, Highland Valley, and Quebrada Blanca. Excludes Highland Valley Copper and Antamina mine life extensions. Excludes Highland Valley Copper and Antamina mine life extensions. 2021 actual copper equivalent production was previously reported as 345kt using metal prices of US$3.39/lb Cu, US$1.32/lb Zn, US$9.44/lb Mo, US$7.53/lb Ni, US$20.59/lb Co, US$1,602/oz Au, US$21.07/oz Ag, US$1,103/oz Pt and US$1,429/oz Pd. 2021 actual copper equivalent production assuming metal price assumptions mentioned in Endnotes 1 returned 337kt. Slide 31: Copper Growth 1. Five years from January 1, 2017 to December 31, 2021. Slide 33: Production Guidance 1. As at October 26, 2022. See Teck’s Q3 2022 press release for further details. 2. Metal contained in concentrate. 3. We include 100% of production and sales from our Quebrada Blanca and Carmen de Andacollo mines in our production and sales volumes, even though we do not own 100% of these operations, because we fully consolidate their results in our financial statements. We include 22.5% of production and sales from Antamina, representing our proportionate ownership interest. 4. Copper production includes cathode production at Quebrada Blanca and Carmen de Andacollo. 5. Total zinc includes co-product zinc production from our 22.5% proportionate interest in Antamina. 6. 2022 guidance excludes production from Quebrada Blanca concentrate production. Three-year guidance 2023—2025 includes Quebrada Blanca concentrate production. Slide 34: Sales and Unit Cost Guidance 1. As at October 26, 2022. See Teck’s Q3 2022 press release for further details. 2. Copper unit costs are reported in U.S. dollars per payable pound of metal contained in concentrate. Copper net cash unit costs include adjusted cash cost of sales and smelter processing charges, less cash margins for by-products including co-products. Guidance for 2022 assumes a zinc price of US$1.57 per pound, a molybdenum price of US$18.00 per pound, a silver price of US$22 per ounce, a gold price of US$1,800 per ounce and a Canadian/U.S. dollar exchange rate of $1.29. 3. Zinc unit costs are reported in U.S. dollars per payable pound of metal contained in concentrate. Zinc net cash unit costs are mine costs including adjusted cash cost of sales and smelter processing charges, less cash margins for by-products. Guidance for 2022 assumes a lead price of US$0.88 per pound, a silver price of US$22 per ounce and a Canadian/U.S. dollar exchange rate of $1.29. By-products include both by-products and co-products. Slide 35: Capital Expenditures Guidance 1. As at October 26, 2022. See Teck’s Q3 2022 press release for further details. 2. Steelmaking coal 2022 sustaining capital guidance includes $200 million of water treatment capital. 2021 includes $226 million of water treatment capital. 3. Growth capital expenditures include RACE capital expenditures for 2022 of $50 million, of which $10 million relates to copper, $5 million relates to zinc, and $35 million relates to steelmaking coal. 4. Copper growth capital guidance for 2022 includes studies for HVC 2040, Antamina, QBME, Zafranal, San Nicolás and Galore Creek. Copper sustaining capital guidance for 2022 includes Quebrada Blanca concentrate operations. 5. Energy capital guidance is to September 30, 2022. Slide 36: Water Treatment Guidance 1. As at October 26, 2022. See Teck’s Q3 2022 press release for further details. 2. The 2022 portion is included in 2022 guidance. See Teck’s Q3 2022 press release for further details on the October 2020 Direction issued by Environment and Climate Change Canada. 3. Assumes 21 million tonnes in 2020 and 27 million tonnes long term. Slide 37: Sensitivities 1. As at October 26, 2022. The sensitivity of our annualized profit(loss) attributable to shareholders and EBITDA to changes in the Canadian/U.S. dollar exchange rate and commodity prices, before pricing adjustments, based on our current balance sheet, our 2022 mid-range production estimates, current commodity prices and a Canadian/U.S. dollar exchange rate of $1.30. 2. All production estimates are subject to change based on market and operating conditions. 3. The effect on our profit(loss) attributable to shareholders and on EBITDA of commodity price and exchange rate movements will vary from quarter to quarter depending on sales volumes. Our estimate of the sensitivity of profit and EBITDA to changes in the U.S. dollar exchange rate is sensitive to commodity price assumptions. 4. Zinc includes 262,000 tonnes of refined zinc and 647,500 tonnes of zinc contained in concentrate. 5. Our WTI oil price sensitivity takes into account the change in operating costs across our business units, as our operations use a significant amount of diesel fuel.
  • 40.
    Global Metals andMining Conference 40 Non-GAAP Financial Measures and Ratios
  • 41.
    Global Metals andMining Conference 41 Non-GAAP Financial Measures and Ratios Our financial results are prepared in accordance with International Financial Reporting Standards (IFRS) as issued by the International Accounting Standards Board. This presentation includes reference to certain non-GAAP financial measures and non-GAAP ratios, which are not measures recognized under IFRS, do not have a standardized meaning prescribed by IFRS and may not be comparable to similar financial measures or ratios disclosed by other issuers. These financial measures and ratios have been derived from our financial statements and applied on a consistent basis as appropriate. We disclose these financial measures and ratios because we believe they assist readers in understanding the results of our operations and financial position and provide further information about our financial results to investors. These measures should not be considered in isolation or used in substitute for other measures of performance prepared in accordance with IFRS. For more information on our use of non-GAAP financial measures and ratios, see the section titled “Use of Non-GAAP Financial Measures and Ratios” in our most recent Management Discussion & Analysis, which is incorporated by reference herein and is available on SEDAR at www.sedar.com. Additional information on certain non-GAAP ratios is below. Non-GAAP Ratios Adjusted EBITDA margins – Adjusted EBITDA margins are Adjusted EBITDA, divided by revenue. There is no similar financial measure in our financial statements with which to compare. Adjusted EBITDA is a non-GAAP financial measure. We believe this measure assists us and readers to compare margins on a percentage basis among our business units. Adjusted site cash cost of sales per tonne – Adjusted site cash cost of sales per tonne for our steelmaking coal operations is defined as the cost of the product as it leaves the mine excluding depreciation and amortization charges, out-bound transportation costs and any one-time collective agreement charges and inventory write-down provisions. Total cash unit costs per pound – Total cash unit costs per pound for our copper and zinc operations includes adjusted cash costs of sales, as described below, plus the smelter and refining charges added back in determining adjusted revenue. This presentation allows a comparison of total cash unit costs, including smelter charges, to the underlying price of copper or zinc in order to assess the margin for the mine on a per unit basis. Net cash unit costs per pound – Net cash unit costs of principal product per pound, after deducting co-product and by-product margins, are also a common industry measure. By deducting the co- and by-product margin per unit of the principal product, the margin for the mine on a per unit basis may be presented in a single metric for comparison to other operations. Unit costs per tonne - Unit costs per tonne for our steelmaking coal operations are total cost of goods sold, divided by tonnes sold in the period, excluding depreciation and amortization charges. We include this information as it is frequently requested by investors and investment analysts who use it to assess our cost structure and margins and compare it to similar information provided by many companies in the industry. Adjusted operating costs per barrel – Adjusted operating costs per barrel for our energy business unit is defined as the costs of product as it leaves the mine, excluding depreciation and amortization charges, cost of diluent for blending to transport our bitumen by pipeline, cost of non-proprietary product purchased and transportation costs of our product and non-proprietary product and any one-time collective agreement charges or inventory write-down provisions. Operating netback per barrel – Operating netback per barrel in our energy business unit is calculated as blended bitumen sales revenue net of diluent expenses (also referred to as bitumen price realized), less Crown royalties, transportation and operating expenses divided by barrels of bitumen sold. We include this information as investors and investment analysts use it to measure our profitability on a per barrel basis and compare it to similar information provided by other companies in the oil sands industry. Net debt to adjusted EBITDA ratio – Net debt to adjusted EBITDA ratio is net debt divided by adjusted EBITDA for the twelve months ended at the reporting period, expressed as the number of times adjusted EBITDA needs to be earned to repay the net debt. Adjusted diluted earnings per share – Adjusted diluted earnings per share is adjusted profit attributable to shareholders divided by average number of fully diluted shares in a period.
  • 42.
    Global Metals andMining Conference 42 Reconciliation of Segment EBITDA Reconciliation between Segmented Profit and Segmented EBITDA1 EBITDA is a non-GAAP financial measure. See “Non-GAAP Financial Measures and Ratios” slides. 3 months ending September 30, 2022 Copper Zinc Steelmaking Coal Energy Corporate Total Profit (Loss) before Taxes $M (55) 275 1,040 (1,160) (176) (76) Net finance expense $M 89 8 21 6 (73) 51 Depreciation and amortization $M 108 105 245 35 - 493 Segmented EBITDA $M 142 388 1,306 (1,119) (249) 468 9 months ending September 30, 2022 Copper Zinc Steelmaking Coal Energy Corporate Total Profit (Loss) before Taxes $M 390 691 5,309 (949) (404) 5,037 Net finance expense $M 163 30 65 19 (131) 146 Depreciation and amortization $M 322 201 767 104 1,394 Segmented EBITDA $M 875 922 6,141 (826) (535) 6,577