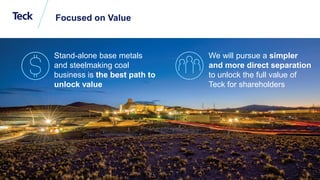
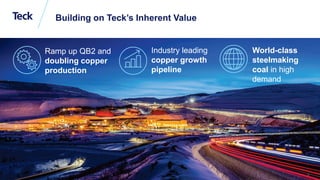
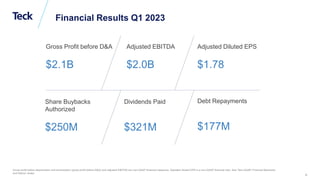
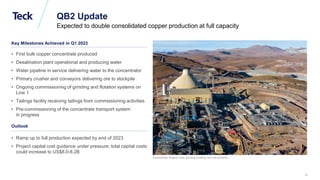
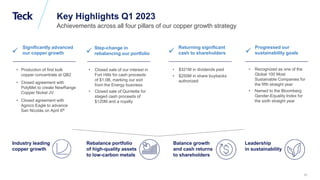
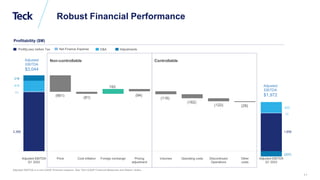
Global Metals and Mining Conference
April 26, 2023
First Quarter 2023
Conference Call
Global Metals and Mining Conference
Caution Regarding Forward-Looking Statements
Both these slides and the accompanying presentation contain certain forward-looking information and forward-looking statements as defined in applicable securities laws (collectively referred to as forward-looking statements). These forward-looking
statements relate to future events or our future performance. All statements other than statements of historical fact are forward-looking statements. The use of any of the words “anticipate”, “plan”, “continue”, “estimate”, “expect”, “may”, “will”, “project”,
“predict”, “potential”, “should”, “believe” and similar expressions is intended to identify forward-looking statements. These statements involve known and unknown risks, uncertainties and other factors that may cause actual results or events to differ
materially from those anticipated in such forward-looking statements.
These forward-looking statements include, but are not limited to, statements relating to: a stand-alone base metals and steelmaking coal business as the best path to unlock value; the expectation of a simpler and more direct separation unlocking full
value of Teck; expectation of doubling of copper production; our expectations regarding our Quebrada Blanca Phase 2 project, including expectations regarding timing for reaching full production and capital cost guidance; expected growth in copper
production; expectations regarding return of cash to shareholders; all guidance, including but not limited to Red Dog Q2 zinc in concentrate sales guidance and Q2 steelmaking coal sales guidance and all other expectations regarding the
performance of our business units and our company.
Inherent in forward-looking statements are risks and uncertainties beyond our ability to predict or control, including risks associated with: risk that market or other conditions become unfavourable to completing a separation; our operating or capital
plans; the permitting and development of mineral properties such as unusual or unexpected geological formations; unanticipated metallurgical difficulties; permit appeals or other regulatory processes, ground control problems, adverse weather
conditions or process upsets or equipment malfunctions; damage to our reputation; labour disturbances and availability of skilled labour; fluctuations in the market prices of our principal commodities; changes to the tax and royalty regimes in which
we operate; competition for mining properties; lack of access to capital or to markets; mineral and oil and gas reserve estimates; fluctuations in exchange rates (including but not limited to the Canadian-U.S. dollar exchange rates and Canadian
dollar-Chilean Pesos exchange rates) and interest rates, as well as general economic conditions; changes to our credit ratings; our material financing arrangements and our covenants thereunder; climate change, environmental compliance, changes
in environmental legislation and regulation, and changes to our reclamation obligations; procurement of goods and services for our business, projects and operations; non-performance by contractual counterparties; potential disputes with partners
and co-owners; operations in foreign countries; information technology; and tax reassessments and legal proceedings. Certain of our operations and projects are operated through joint arrangements where we may not have control over all
decisions, which may cause outcomes to differ from current expectations. Declaration and payment of dividends and capital allocation are generally the discretion of the Board, and our dividend policy and capital allocation framework will be reviewed
regularly and may change.
Such statements are based on a number of assumptions that may prove to be incorrect, including, but not limited to, assumptions regarding: availability of acceptable alternative separation structures; general business and economic conditions;
commodity and power prices; the supply and demand for, and prices of copper, zinc and steelmaking coal; the timing of receipt of permits and other regulatory and governmental approvals for our development projects and operations; timing for full
production at Quebrada Blanca Phase 2; our costs of production, and our production and productivity levels; availability of water and power resources for our projects and operations; credit market conditions and conditions in financial markets
generally; foreign exchange rates: the accuracy of our mineral and steelmaking coal reserve and resource estimates; and tax benefits and tax rates. Our liquidity depends in part on the continuing availability of our credit facilities. Assumptions
regarding Quebrada Blanca Phase 2 include current project assumptions and assumptions contained in the final feasibility study, and also includes exchange rate assumptions. In addition to the above, statements regarding a separation are based
on assumptions regarding satisfaction of conditions to separation and that market and other conditions remain favourable to completing a separation. Statements concerning future production costs or volumes are based on numerous assumptions of
management regarding operating matters and on assumptions that demand for products develops as anticipated; that customers and other counterparties perform their contractual obligations; that operating and capital plans will not be disrupted by
issues such as mechanical failure, unavailability of parts and supplies, labour disturbances, COVID-19, interruption in transportation or utilities, or adverse weather conditions; and that there are no material unanticipated variations in the cost of
energy or supplies. Our sustainability goals are based on a number of additional assumptions, including regarding the availability and effectiveness of technologies needed to achieve our sustainability goals and priorities; the availability of clean
energy sources and zero-emissions alternatives for transportation on reasonable terms; our ability to implement new source control or mine design strategies on commercially reasonable terms without impacting production objectives; our ability to
successfully implement our technology and innovation strategy; and the performance of new technologies in accordance with our expectations. The foregoing list of important factors and assumptions is not exhaustive.
Teck cautions that the foregoing list of important factors and assumptions is not exhaustive and other factors could also adversely affect its results. Further information concerning risks and uncertainties associated with these forward-looking
statements and our business can be found in our Annual Information Form for the year ended December 31, 2022, filed under our profile on SEDAR (www.sedar.com) and on EDGAR (www.sec.gov) under cover of Form 40-F, as well as subsequent
filings that can also be found under our profile.
The forward-looking statements contained in these slides and accompanying presentation describe Teck’s expectations at the date hereof and are subject to change after such date. Except as may be required by applicable securities laws, Teck
does not undertake any obligation to update or revise any forward-looking statements contained in these slides or the accompanying presentation, whether as a result of new information, future events or otherwise. Readers are cautioned not to
place undue reliance on these forward-looking statements.
Scientific and technical information in this presentation relating to our base metals assets was reviewed and approved by Rodrigo Alves Marinho, P.Geo., an employee of Teck and a Qualified Person under National Instrument 43-101.
2
Global Metals and Mining Conference
Jonathan Price
Chief Executive Officer
Global Metals and Mining Conference
Focused on Value
4
Stand-alone base metals
and steelmaking coal
business is the best path to
unlock value
We will pursue a simpler
and more direct separation
to unlock the full value of
Teck for shareholders
Global Metals and Mining Conference
Building on Teck’s Inherent Value
5
World-class
steelmaking
coal in high
demand
Ramp up QB2 and
doubling copper
production
Industry leading
copper growth
pipeline
Global Metals and Mining Conference
Moving Forward
6
Heard shareholder
feedback on
separation proposal
Will pursue a simpler and
more direct separation
Will not pursue any transaction
that exposes shareholders to
unacceptable risk and uncertainty
Global Metals and Mining Conference
Crystal Prystai
Senior Vice President and
Chief Financial Officer
Global Metals and Mining Conference
Financial Results Q1 2023
Gross Profit before D&A
$2.1B
Adjusted EBITDA
$2.0B
Dividends Paid
$321M
Share Buybacks
Authorized
$250M
Debt Repayments
$177M
Adjusted Diluted EPS
$1.78
Gross profit before depreciation and amortization (gross profit before D&A) and adjusted EBITDA are non-GAAP financial measures. Adjusted diluted EPS is a non-GAAP financial ratio. See “Non-GAAP Financial Measures
and Ratios” slides.
8
Global Metals and Mining Conference
Concentrator flotation area, grinding building, and ore stockpile.
QB2 Update
Expected to double consolidated copper production at full capacity
Outlook
• Ramp up to full production expected by end of 2023
• Project capital cost guidance under pressure; total capital costs
could increase to US$8.0-8.2B
Key Milestones Achieved in Q1 2023
• First bulk copper concentrate produced
• Desalination plant operational and producing water
• Water pipeline in service delivering water to the concentrator
• Primary crusher and conveyors delivering ore to stockpile
• Ongoing commissioning of grinding and flotation systems on
Line 1
• Tailings facility receiving tailings from commissioning activities
• Pre-commissioning of the concentrate transport system
in progress
9
Global Metals and Mining Conference
Key Highlights Q1 2023
Achievements across all four pillars of our copper growth strategy
Industry leading
copper growth
• Production of first bulk
copper concentrate at QB2
• Closed agreement with
PolyMet to create NewRange
Copper Nickel JV
• Closed agreement with
Agnico Eagle to advance
San Nicolás on April 6th

Significantly advanced
our copper growth
Rebalance portfolio
of high-quality assets
to low-carbon metals
• Closed sale of our interest in
Fort Hills for cash proceeds
of $1.0B, marking our exit
from the Energy business
• Closed sale of Quintette for
staged cash proceeds of
$120M and a royalty

Step-change in
rebalancing our portfolio
Balance growth
and cash returns
to shareholders
• $321M in dividends paid
• $250M in share buybacks
authorized

Returning significant
cash to shareholders
Leadership
in sustainability
• Recognized as one of the
Global 100 Most
Sustainable Companies for
the fifth straight year
• Named to the Bloomberg
Gender-Equality Index for
the sixth straight year

Progressed our
sustainability goals
10
Global Metals and Mining Conference
(661)
193
(116)
(81)
(94)
(162)
(122) (29)
Adjusted EBITDA
Q1 2022
Price Cost inflation Foreign exchange Pricing
adjustment
Volumes Operating costs Discontinued
Operations
Other
costs
Adjusted EBITDA
Q1 2023
Adjusted EBITDA is a non-GAAP financial measure. See “Non-GAAP Financial Measures and Ratios” slides.
Non-controllable
Robust Financial Performance
Adjusted
EBITDA
$3,044
Adjusted
EBITDA
$1,972
Controllable
D&A
Profitability ($M)
30
1,856
Adjustments
Net Finance Expense
Profit(Loss) before Tax
423
(337)
218
2,368
43
415
11
Global Metals and Mining Conference
Copper Business Unit
Operating Metrics
Financial Metrics
• Production of our first bulk copper concentrate at QB2
• Copper prices remained above long-term historic
averages, despite the decline in the quarter
• Lower production at HVC as expected, driven by harder
ore and lower grades
• Antamina production impacted by severe weather events
Q1 2023 Highlights
• FY2023 production and unit cost guidance remains
unchanged
Looking Forward
Q1 2023 Q1 2022
FY23
Guidance
Price (LME Cash) US$/lb 4.05 4.53
Production kt 57 67 390-445
Sales kt 59 69
Total cash unit costs US$/lb 2.30 1.91 2.05-2.25
Net cash unit costs US$/lb 1.83 1.37 1.60-1.80
Q1 2023 Q1 2022
Gross revenue $M 763 930
Gross profit $M 261 451
EBITDA $M 655 523
Capital expenditures
(ex-QB2)
$M 295 129
Capital expenditures (QB2) $M 903 654
EBITDA is a non-GAAP financial measure. Total cash unit costs per pound and net cash unit costs per pound are non-GAAP ratios. See “Non-GAAP Financial Measures and Ratios” slides.
12
Global Metals and Mining Conference
Operating Metrics
Financial Metrics
• Zinc concentrate and refined zinc production impacted by
weather impacts
• Trail operations impacted by maintenance requirements
• Trail has committed to the Zinc Mark, a framework which
aims to promote responsible production practices
Q1 2023 Highlights
• FY2023 guidance remains unchanged
• Expect Red Dog zinc in concentrate sales of 45-55kt
in Q2 2023
Looking Forward
Zinc Business Unit
Q1 2023 Q1 2022
FY22
Guidance
Price (LME Cash) US$/lb 1.43 1.65
Production (zinc in concentrate) Kt 62 69 550-580
Sales (zinc in concentrate) Kt 126 132
Production (refined zinc) Kt 55 69 270-290
Sales (refined zinc) Kt 89 145
Total cash unit costs US$/lb 0.68 0.49 0.68-0.78
Net cash unit costs US$/lb 0.69 0.46 0.50-0.60
Q1 2023 Q1 2022
Gross revenue $M 616 920
Gross profit $M 128 247
EBITDA $M 161 298
Capital expenditures $M 49 43
EBITDA is a non-GAAP financial measure. Total cash unit costs per pound and net cash unit costs per pound are non-GAAP ratios. See “Non-GAAP Financial Measures and Ratios” slides.
13
Global Metals and Mining Conference
Operating Metrics
Financial Metrics
• Steelmaking coal prices remained well above historic
averages, despite the decline in the quarter
• Strong mining productivity and utilization of available
equipment rates, reflective of pre-pandemic rates
• Higher transportation costs due to rail rates and port
costs from increased utilization of third-party terminals
Q1 2023 Highlights
• FY2023 guidance remains unchanged.
• Expected sales of 6.2-6.6Mt in Q2 2023
Looking Forward
Q1 2023 Q1 2022
FY23
Guidance
Realized price US$/t 282 357
Production Mt 6.0 5.6 24.0-26.0
Sales Mt 6.2 6.0
Adj. site cash cost of sales $/t 89 77 88-96
Transportation costs $/t 50 46 45-48
Total unit costs $/t 139 123
Steelmaking Coal Business Unit
Q1 2023 Q1 2022
Gross revenue $M 2,406 2,766
Gross profit $M 1,277 1,780
EBITDA $M 1,783 2,095
Capital expenditures $M 328 240
EBITDA is a non-GAAP financial measure. Adjusted site cash cost of sales per tonne and total unit costs per tonne are non-GAAP ratios. See “Non-GAAP Financial Measures and Ratios” slides.
14
Global Metals and Mining Conference
Strong Financial Position
Liquidity1
$8.0B
Net Debt to Adjusted EBITDA2
0.6x
Strong Balance Sheet
Net debt to adjusted EBITDA is a non-GAAP ratio. See “Non-GAAP Financial Measures and Ratios” slides.
Moody’s
Baa3
Fitch
BBB-
Credit Ratings1
S&P
BBB-
Debt Maturity Ladder2 (US$M)
C$144M in notes redeemed in Q1 2023
C$1.3B in debt repaid in 2022; no note maturities to 2030
Significant Cash Returns To Shareholders ($M)
$321M in dividends in Q1 2023
$1.0B in dividends and $2.5B in share buybacks in past five years
Dividends paid
Share buybacks
Notes
outstanding
QB2 Project
Finance Facility
$0
$500
$1,000
$1,500
$2,000
$2,500
2018 2019 2020 2021 2022
$1.4B
$0.5B
294
797
147
336
473 396 395 367
2023
2024
2025
2026
2027
2028
2029
2030
2031
2032
2033
2034
2035
2036
2037
2038
2039
2040
2041
2042
2043
per year
15
Global Metals and Mining Conference
Jonathan Price
Chief Executive Officer
Global Metals and Mining Conference
Sustainability
leadership
Focus on
execution
Balance growth
and cash returns
to shareholders
Industry leading
copper growth
Long-term
sustainable
shareholder
value
Driving Long-Term Sustainable Shareholder Value
Capitalizing on strong demand in the transition to a low-carbon economy
Global Metals and Mining Conference
Appendix
Global Metals and Mining Conference
Production Guidance
2022
Actual
Previous
2023
Guidance
Current
2023
Guidance1
Previous
2024-2026
Guidance
Current
2024-2026
Guidance1
Copper2,3,4
Highland Valley 119.1 110-118 110-118 120-165 120-165
Antamina 102.3 90-97 90-97 90-100 90-100
Carmen de Andacollo 39.5 40-50 40-50 50-60 50-60
Quebrada Blanca 9.6 150-180 150-180 285-315 285-315
Total 270.5 390-445 390-445 545-640 545-640
Copper
Kt, except as noted. 19
2022
Actual
Previous
2023
Guidance
Current
2023
Guidance1
Previous
2024-2026
Guidance
Current
2024-2026
Guidance1
Zinc in concentrate2,3,5
Red Dog 553.1 550-580 550-580 500-550 500-550
Antamina 97.4 95-105 95-105 55-95 55-95
Total 650.5 645-685 645-685 555-645 555-645
Refined zinc
Trail Operations 248.9 270-290 270-290 280-310 280-310
Zinc
2022
Actual
Previous
2023
Guidance
Current
2023
Guidance1
Previous
2024-2026
Guidance
Current
2024-2026
Guidance1
Steelmaking coal (Mt) 21.5 24.0-26.0 24.0-26.0 24.0-26.0 24.0-26.0
Steelmaking Coal
2022
Actual
Previous
2023
Guidance
Current
2023
Guidance1
Previous
2024-2026
Guidance
Current
2024-2026
Guidance1
Molybdenum2,3
(Mlbs)
Highland Valley 1.0 0.8-1.2 0.8-1.2 2.0-6.0 2.0-6.0
Antamina 1.5 2.2-2.6 2.2-2.6 2.0-4.0 2.0-4.0
Quebrada Blanca - 1.5-3.0 1.5-3.0 10.0-14.0 10.0-14.0
Total 2.5 4.5-6.8 4.5-6.8 14.0-24.0 14.0-24.0
Lead2
Red Dog 79.5 110-125 110-125 85-95 85-95
Other Base Metals
Global Metals and Mining Conference
Unit Cost and Sales Guidance
Total cash unit costs per pound, net cash unit costs per pound, and adjusted site cash cost of sales per tonne are non-GAAP ratios. See “Non-GAAP Financial Measures and Ratios” slides.
Zinc3 Steelmaking Coal
Copper2
(US$/lb)
2022
Actual
Previous
2023
Guidance
Current
2023
Guidance1
Total cash unit costs 2.02 2.05-2.25 2.05-2.25
Net cash unit costs4
1.56 1.60-1.80 1.60-1.80
(US$/lb)
2022
Actual
Previous
2023
Guidance
Current
2023
Guidance1
Total cash unit costs 0.58 0.68-0.78 0.68-0.78
Net cash unit costs4
0.44 0.50-0.60 0.50-0.60
(C$/tonne)
2022
Actual
Previous
2023
Guidance
Current
2023
Guidance1
Adjusted site cash cost of sales 89 88-96 88-96
Transportation costs 47 45-48 45-48
Unit Costs
Sales
(kt)
Q1 2023
Actual
Current
Q2 2023
Guidance1
Red Dog zinc in concentrate 89 45-55
(Mt)
Q1 2023
Actual
Current
Q2 2023
Guidance1
Steelmaking coal 6.2 6.2-6.6
Zinc Steelmaking Coal
20
Global Metals and Mining Conference
2022
Actual
Previous
2023
Guidance
Current
2023
Guidance1
Sustaining
Copper2 $ 297 $ 510 $ 510
Zinc 244 150 150
Steelmaking coal3 520 760 760
Corporate 17 10 10
$ 1,078 $ 1,430 $ 1,430
Growth
Copper4 $ 217 $ 250 $ 250
Zinc 37 80 80
Steelmaking coal 30 30 30
Corporate 1 - -
$ 285 $ 360 $ 360
Total
Copper $ 514 $ 760 $ 760
Zinc 281 230 230
Steelmaking coal 550 790 790
Corporate 18 10 10
$ 1,363 $ 1,790 $ 1,790
QB2 development capital 3,060 1,200–1,750 $1,650-2,200
Total before SMM/SC contributions 4,423 2,990-3,540 3,440-3,990
Estimated SMM/SC contributions to capital expenditures (1,090) (520)-(700) (670)-(850)
Estimated QB2 project financing draw to capital expenditures (315) - -
Total, net of partner contributions and project financing $ 3,018 $ 2,470-2,840 $ 2,770-3,140
Capital Expenditures Guidance
Sustaining and Growth Capital Capitalized Stripping
2022
Actual
Previous
2023 Guidance
Current
2023
Guidance1
Capitalized Stripping
Copper $ 336 $ 295 $ 295
Zinc 89 55 55
Steelmaking coal 617 750 750
$ 1,042 $ 1,100 $ 1,100
Teck’s share in C$ millions, except as noted. 21
Global Metals and Mining Conference
Water Treatment Guidance
C$ millions, except as noted.
2022
Actual
Previous
2023
Guidance
Current
2023
Guidance2
Previous
2023-2024
Guidance
Current
2023-2024
Guidance2
Previous
Long-Term
Guidance
(C$/tonne)
Current
Long-Term
Guidance3
(C$/tonne)
Sustaining capital for water management and water
treatment, including October 2020 Direction issued
by Environment and Climate Change Canada
$ 184 $ 220 $ 220 $ 450-550 $ 450-550 $ 2.00 $ 2.00
Steelmaking Coal Capital Expenditures Related to Water Treatment1
2022
Actual
Previous
2023
Guidance
Current
2023
Guidance2
Previous
2023-2024
Guidance
Current
2023-2024
Guidance2
Previous
Long-Term
Guidance
(C$/tonne)
Current
Long-Term
Guidance3
(C$/tonne)
Operating costs associated with water treatment $ 1.50 – – $ 3.00-5.00 $ 3.00-5.00
Steelmaking Coal Operating Costs Related to Water Treatment1 (C$/tonne)
22
Global Metals and Mining Conference
Sensitivities
2023 Mid-Range
Production Estimates2 Changes
Estimated Effect on
Profit Attributable
to Shareholders3
($ in millions)
Estimated Effect
on EBITDA3
($ in millions)
US$ exchange C$0.01 $ 60 $ 98
Copper (kt) 417.5 US$0.01/lb 6 11
Zinc (kt)4 945.0 US$0.01/lb 9 12
Steelmaking Coal (Mt) 25.0 US$1/t 19 29
WTI5 US$1/bbl 3 5
EBITDA is a non-GAAP financial measure. See “Non-GAAP Financial Measures and Ratios” slides.
Sensitivity of our Annualized Profit Attributable to Shareholders and EBITDA1
Global Metals and Mining Conference
Settlement Pricing Adjustments
Outstanding at
March 31, 2023
Outstanding at
December 31, 2022
Quarterly
Pricing
Adjustments
Mlbs US$/lb Mlbs US$/lb C$M
Copper 134 $ 4.08 168 $ 3.80 $62
Zinc 146 1.33 218 1.35 7
Steelmaking Coal 25
Other (7)
Total $ 87
Simplified Settlement Pricing Adjustment Model for Base Metals (Pre-tax settlement pricing adjustment in C$M)
24
Global Metals and Mining Conference
Endnotes
Slide 15: Strong Financial Position
1. As at April 25, 2023.
2. As at March 31, 2023. Excludes short-term loans at Carmen de Andacollo and loans at Antamina.
Slide 19: Production Guidance
1. As at April 25, 2023. See Teck’s Q1 2023 press release for further details.
2. Metal contained in concentrate.
3. We include 100% of production and sales from our Quebrada Blanca and Carmen de Andacollo mines in our production and
sales volumes, even though we do not own 100% of these operations, because we fully consolidate their results in our financial
statements. We include 22.5% of production and sales from Antamina, representing our proportionate ownership interest.
4. Copper production includes cathode production at Quebrada Blanca and Carmen de Andacollo.
5. Total zinc includes co-product zinc production from our 22.5% proportionate interest in Antamina.
Slide 20: Unit Cost and Sales Guidance
1. As at April 25, 2023. See Teck’s Q1 2023 press release for further details.
2. Copper unit costs are reported in U.S. dollars per payable pound of metal contained in concentrate. Copper net cash unit costs
include adjusted cash cost of sales and smelter processing charges, less cash margins for by-products including co-products.
Guidance for 2023 assumes a zinc price of US$1.45 per pound, a molybdenum price of US$17.00 per pound, a silver price of
US$20 per ounce, a gold price of US$1,755 per ounce and a Canadian/U.S. dollar exchange rate of $1.33. Excludes Quebrada
Blanca. Cash margins for by-products are non-GAAP financial measures. See “Non-GAAP Financial Measures” slides.
3. Zinc unit costs are reported in U.S. dollars per payable pound of metal contained in concentrate. Zinc net cash unit costs are
mine costs including adjusted cash cost of sales and smelter processing charges, less cash margins for by-products. Guidance
for 2023 assumes a lead price of US$0.90 per pound, a silver price of US$20 per ounce and a Canadian/U.S. dollar exchange
rate of $1.33. By-products include both by-products and co-products.
4. After co-product and by-product margins and excluding Quebrada Blanca.
Slide 21: Capital Expenditures Guidance
1. As at April 25, 2023. See Teck’s Q1 2023 press release for further details.
2. Copper sustaining capital guidance for 2023 includes Quebrada Blanca concentrate operations.
3. Steelmaking coal sustaining capital 2023 guidance includes $220 million of water treatment capital. 2022 guidance includes
$200 million of water treatment capital.
4. Copper growth capital guidance for 2023 includes studies for HVC 2040, Zafranal, San Nicolás, NewRange Copper Nickel
(formerly Mesaba, NorthMet), QBME, Galore Creek, Schaft Creek and NuevaUnión.
Slide 22: Water Treatment Guidance
1. As at April 25, 2023. See Teck’s Q1 2023 press release for further details.
2. The 2023 portion is included in 2023 guidance. See Teck’s Q1 2023 press release for further details on the October 2020
Direction issued by Environment and Climate Change Canada.
3. Assumes 21.5Mt in 2022 and 26-27 million tonnes long term.
Slide 23: Sensitivities
1. As at April 25, 2023. The sensitivity of our annualized profit(loss) attributable to shareholders and EBITDA to changes in the
Canadian/U.S. dollar exchange rate and commodity prices, before pricing adjustments, based on our current balance sheet, our
2023 mid-range production estimates, current commodity prices and a Canadian/U.S. dollar exchange rate of $1.30.
2. All production estimates are subject to change based on market and operating conditions.
3. The effect on our profit (loss) attributable to shareholders and on EBITDA of commodity price and exchange rate movements
will vary from quarter to quarter depending on sales volumes. Our estimate of the sensitivity of profit and EBITDA to changes in
the U.S. dollar exchange rate is sensitive to commodity price assumptions.
4. Zinc includes 280,000 tonnes of refined zinc and 665,000 tonnes of zinc contained in concentrate.
5. Our WTI oil price sensitivity takes into account the change in operating costs across our business units, as our operations use a
significant amount of diesel fuel.
25
Global Metals and Mining Conference
Non-GAAP Financial
Measures and Ratios
Global Metals and Mining Conference
Non-GAAP Financial Measures and Ratios
Our financial results are prepared in accordance with International Financial Reporting Standards (IFRS) as issued by the International Accounting Standards Board. This presentation includes reference to certain non-GAAP financial measures and
non-GAAP ratios, which are not measures recognized under IFRS, do not have a standardized meaning prescribed by IFRS and may not be comparable to similar financial measures or ratios disclosed by other issuers. These financial measures
and ratios have been derived from our financial statements and applied on a consistent basis as appropriate. We disclose these financial measures and ratios because we believe they assist readers in understanding the results of our operations
and financial position and provide further information about our financial results to investors. These measures should not be considered in isolation or used in substitute for other measures of performance prepared in accordance with IFRS. For more
information on our use of non-GAAP financial measures and ratios, see the section titled “Use of Non-GAAP Financial Measures and Ratios” in our most recent Management Discussion & Analysis, which is incorporated by reference herein and is
available on SEDAR at www.sedar.com. Additional information on certain non-GAAP ratios is below.
Non-GAAP Ratios
Adjusted site cash cost of sales per tonne – Adjusted site cash cost of sales per tonne for our steelmaking coal operations is defined as the cost of the product as it leaves the mine excluding depreciation and amortization charges, out-bound
transportation costs and any one-time collective agreement charges and inventory write-down provisions.
Total cash unit costs per pound – Total cash unit costs per pound for our copper and zinc operations includes adjusted cash costs of sales, as described below, plus the smelter and refining charges added back in determining adjusted revenue.
This presentation allows a comparison of total cash unit costs, including smelter charges, to the underlying price of copper or zinc in order to assess the margin for the mine on a per unit basis.
Net cash unit costs per pound – Net cash unit costs of principal product per pound, after deducting co-product and by-product margins, are also a common industry measure. By deducting the co- and by-product margin per unit of the principal
product, the margin for the mine on a per unit basis may be presented in a single metric for comparison to other operations.
Unit costs per tonne - Unit costs per tonne for our steelmaking coal operations are total cost of goods sold, divided by tonnes sold in the period, excluding depreciation and amortization charges. We include this information as it is frequently
requested by investors and investment analysts who use it to assess our cost structure and margins and compare it to similar information provided by many companies in the industry.
Net debt to adjusted EBITDA ratio – Net debt to adjusted EBITDA ratio is net debt divided by adjusted EBITDA for the twelve months ended at the reporting period, expressed as the number of times adjusted EBITDA needs to be earned to repay
the net debt.
Adjusted diluted earnings per share – Adjusted diluted earnings per share is adjusted profit attributable to shareholders divided by average number of fully diluted shares in a period.
27
Global Metals and Mining Conference
Reconciliation of Segment EBITDA
Reconciliation between Segmented Profit and Segmented EBITDA
3 months ending March 31, 2023 Copper Zinc
Steelmaking
Coal Corporate Total
Profit (Loss) before Taxes $M 423 105 1,492 (164) 1,856
Net finance expense $M 120 11 25 (126) 30
Depreciation and amortization $M 112 45 266 - 423
Segmented EBITDA $M 655 161 1,783 (290) 2,309
3 months ending March 31, 2022 Copper Zinc
Steelmaking
Coal Corporate Total
Profit (Loss) before Taxes $M 383 228 1,821 (64) 2,368
Net finance expense $M 35 12 22 (26) 43
Depreciation and amortization $M 105 58 252 - 415
Segmented EBITDA $M 523 298 2,095 (90) 2,826
28
Global Metals and Mining Conference
April 26, 2023
First Quarter 2023
Conference Call

Q1 2023 Conference Call Presentation Slides

  • 1.
    Global Metals andMining Conference April 26, 2023 First Quarter 2023 Conference Call
  • 2.
    Global Metals andMining Conference Caution Regarding Forward-Looking Statements Both these slides and the accompanying presentation contain certain forward-looking information and forward-looking statements as defined in applicable securities laws (collectively referred to as forward-looking statements). These forward-looking statements relate to future events or our future performance. All statements other than statements of historical fact are forward-looking statements. The use of any of the words “anticipate”, “plan”, “continue”, “estimate”, “expect”, “may”, “will”, “project”, “predict”, “potential”, “should”, “believe” and similar expressions is intended to identify forward-looking statements. These statements involve known and unknown risks, uncertainties and other factors that may cause actual results or events to differ materially from those anticipated in such forward-looking statements. These forward-looking statements include, but are not limited to, statements relating to: a stand-alone base metals and steelmaking coal business as the best path to unlock value; the expectation of a simpler and more direct separation unlocking full value of Teck; expectation of doubling of copper production; our expectations regarding our Quebrada Blanca Phase 2 project, including expectations regarding timing for reaching full production and capital cost guidance; expected growth in copper production; expectations regarding return of cash to shareholders; all guidance, including but not limited to Red Dog Q2 zinc in concentrate sales guidance and Q2 steelmaking coal sales guidance and all other expectations regarding the performance of our business units and our company. Inherent in forward-looking statements are risks and uncertainties beyond our ability to predict or control, including risks associated with: risk that market or other conditions become unfavourable to completing a separation; our operating or capital plans; the permitting and development of mineral properties such as unusual or unexpected geological formations; unanticipated metallurgical difficulties; permit appeals or other regulatory processes, ground control problems, adverse weather conditions or process upsets or equipment malfunctions; damage to our reputation; labour disturbances and availability of skilled labour; fluctuations in the market prices of our principal commodities; changes to the tax and royalty regimes in which we operate; competition for mining properties; lack of access to capital or to markets; mineral and oil and gas reserve estimates; fluctuations in exchange rates (including but not limited to the Canadian-U.S. dollar exchange rates and Canadian dollar-Chilean Pesos exchange rates) and interest rates, as well as general economic conditions; changes to our credit ratings; our material financing arrangements and our covenants thereunder; climate change, environmental compliance, changes in environmental legislation and regulation, and changes to our reclamation obligations; procurement of goods and services for our business, projects and operations; non-performance by contractual counterparties; potential disputes with partners and co-owners; operations in foreign countries; information technology; and tax reassessments and legal proceedings. Certain of our operations and projects are operated through joint arrangements where we may not have control over all decisions, which may cause outcomes to differ from current expectations. Declaration and payment of dividends and capital allocation are generally the discretion of the Board, and our dividend policy and capital allocation framework will be reviewed regularly and may change. Such statements are based on a number of assumptions that may prove to be incorrect, including, but not limited to, assumptions regarding: availability of acceptable alternative separation structures; general business and economic conditions; commodity and power prices; the supply and demand for, and prices of copper, zinc and steelmaking coal; the timing of receipt of permits and other regulatory and governmental approvals for our development projects and operations; timing for full production at Quebrada Blanca Phase 2; our costs of production, and our production and productivity levels; availability of water and power resources for our projects and operations; credit market conditions and conditions in financial markets generally; foreign exchange rates: the accuracy of our mineral and steelmaking coal reserve and resource estimates; and tax benefits and tax rates. Our liquidity depends in part on the continuing availability of our credit facilities. Assumptions regarding Quebrada Blanca Phase 2 include current project assumptions and assumptions contained in the final feasibility study, and also includes exchange rate assumptions. In addition to the above, statements regarding a separation are based on assumptions regarding satisfaction of conditions to separation and that market and other conditions remain favourable to completing a separation. Statements concerning future production costs or volumes are based on numerous assumptions of management regarding operating matters and on assumptions that demand for products develops as anticipated; that customers and other counterparties perform their contractual obligations; that operating and capital plans will not be disrupted by issues such as mechanical failure, unavailability of parts and supplies, labour disturbances, COVID-19, interruption in transportation or utilities, or adverse weather conditions; and that there are no material unanticipated variations in the cost of energy or supplies. Our sustainability goals are based on a number of additional assumptions, including regarding the availability and effectiveness of technologies needed to achieve our sustainability goals and priorities; the availability of clean energy sources and zero-emissions alternatives for transportation on reasonable terms; our ability to implement new source control or mine design strategies on commercially reasonable terms without impacting production objectives; our ability to successfully implement our technology and innovation strategy; and the performance of new technologies in accordance with our expectations. The foregoing list of important factors and assumptions is not exhaustive. Teck cautions that the foregoing list of important factors and assumptions is not exhaustive and other factors could also adversely affect its results. Further information concerning risks and uncertainties associated with these forward-looking statements and our business can be found in our Annual Information Form for the year ended December 31, 2022, filed under our profile on SEDAR (www.sedar.com) and on EDGAR (www.sec.gov) under cover of Form 40-F, as well as subsequent filings that can also be found under our profile. The forward-looking statements contained in these slides and accompanying presentation describe Teck’s expectations at the date hereof and are subject to change after such date. Except as may be required by applicable securities laws, Teck does not undertake any obligation to update or revise any forward-looking statements contained in these slides or the accompanying presentation, whether as a result of new information, future events or otherwise. Readers are cautioned not to place undue reliance on these forward-looking statements. Scientific and technical information in this presentation relating to our base metals assets was reviewed and approved by Rodrigo Alves Marinho, P.Geo., an employee of Teck and a Qualified Person under National Instrument 43-101. 2
  • 3.
    Global Metals andMining Conference Jonathan Price Chief Executive Officer
  • 4.
    Global Metals andMining Conference Focused on Value 4 Stand-alone base metals and steelmaking coal business is the best path to unlock value We will pursue a simpler and more direct separation to unlock the full value of Teck for shareholders
  • 5.
    Global Metals andMining Conference Building on Teck’s Inherent Value 5 World-class steelmaking coal in high demand Ramp up QB2 and doubling copper production Industry leading copper growth pipeline
  • 6.
    Global Metals andMining Conference Moving Forward 6 Heard shareholder feedback on separation proposal Will pursue a simpler and more direct separation Will not pursue any transaction that exposes shareholders to unacceptable risk and uncertainty
  • 7.
    Global Metals andMining Conference Crystal Prystai Senior Vice President and Chief Financial Officer
  • 8.
    Global Metals andMining Conference Financial Results Q1 2023 Gross Profit before D&A $2.1B Adjusted EBITDA $2.0B Dividends Paid $321M Share Buybacks Authorized $250M Debt Repayments $177M Adjusted Diluted EPS $1.78 Gross profit before depreciation and amortization (gross profit before D&A) and adjusted EBITDA are non-GAAP financial measures. Adjusted diluted EPS is a non-GAAP financial ratio. See “Non-GAAP Financial Measures and Ratios” slides. 8
  • 9.
    Global Metals andMining Conference Concentrator flotation area, grinding building, and ore stockpile. QB2 Update Expected to double consolidated copper production at full capacity Outlook • Ramp up to full production expected by end of 2023 • Project capital cost guidance under pressure; total capital costs could increase to US$8.0-8.2B Key Milestones Achieved in Q1 2023 • First bulk copper concentrate produced • Desalination plant operational and producing water • Water pipeline in service delivering water to the concentrator • Primary crusher and conveyors delivering ore to stockpile • Ongoing commissioning of grinding and flotation systems on Line 1 • Tailings facility receiving tailings from commissioning activities • Pre-commissioning of the concentrate transport system in progress 9
  • 10.
    Global Metals andMining Conference Key Highlights Q1 2023 Achievements across all four pillars of our copper growth strategy Industry leading copper growth • Production of first bulk copper concentrate at QB2 • Closed agreement with PolyMet to create NewRange Copper Nickel JV • Closed agreement with Agnico Eagle to advance San Nicolás on April 6th  Significantly advanced our copper growth Rebalance portfolio of high-quality assets to low-carbon metals • Closed sale of our interest in Fort Hills for cash proceeds of $1.0B, marking our exit from the Energy business • Closed sale of Quintette for staged cash proceeds of $120M and a royalty  Step-change in rebalancing our portfolio Balance growth and cash returns to shareholders • $321M in dividends paid • $250M in share buybacks authorized  Returning significant cash to shareholders Leadership in sustainability • Recognized as one of the Global 100 Most Sustainable Companies for the fifth straight year • Named to the Bloomberg Gender-Equality Index for the sixth straight year  Progressed our sustainability goals 10
  • 11.
    Global Metals andMining Conference (661) 193 (116) (81) (94) (162) (122) (29) Adjusted EBITDA Q1 2022 Price Cost inflation Foreign exchange Pricing adjustment Volumes Operating costs Discontinued Operations Other costs Adjusted EBITDA Q1 2023 Adjusted EBITDA is a non-GAAP financial measure. See “Non-GAAP Financial Measures and Ratios” slides. Non-controllable Robust Financial Performance Adjusted EBITDA $3,044 Adjusted EBITDA $1,972 Controllable D&A Profitability ($M) 30 1,856 Adjustments Net Finance Expense Profit(Loss) before Tax 423 (337) 218 2,368 43 415 11
  • 12.
    Global Metals andMining Conference Copper Business Unit Operating Metrics Financial Metrics • Production of our first bulk copper concentrate at QB2 • Copper prices remained above long-term historic averages, despite the decline in the quarter • Lower production at HVC as expected, driven by harder ore and lower grades • Antamina production impacted by severe weather events Q1 2023 Highlights • FY2023 production and unit cost guidance remains unchanged Looking Forward Q1 2023 Q1 2022 FY23 Guidance Price (LME Cash) US$/lb 4.05 4.53 Production kt 57 67 390-445 Sales kt 59 69 Total cash unit costs US$/lb 2.30 1.91 2.05-2.25 Net cash unit costs US$/lb 1.83 1.37 1.60-1.80 Q1 2023 Q1 2022 Gross revenue $M 763 930 Gross profit $M 261 451 EBITDA $M 655 523 Capital expenditures (ex-QB2) $M 295 129 Capital expenditures (QB2) $M 903 654 EBITDA is a non-GAAP financial measure. Total cash unit costs per pound and net cash unit costs per pound are non-GAAP ratios. See “Non-GAAP Financial Measures and Ratios” slides. 12
  • 13.
    Global Metals andMining Conference Operating Metrics Financial Metrics • Zinc concentrate and refined zinc production impacted by weather impacts • Trail operations impacted by maintenance requirements • Trail has committed to the Zinc Mark, a framework which aims to promote responsible production practices Q1 2023 Highlights • FY2023 guidance remains unchanged • Expect Red Dog zinc in concentrate sales of 45-55kt in Q2 2023 Looking Forward Zinc Business Unit Q1 2023 Q1 2022 FY22 Guidance Price (LME Cash) US$/lb 1.43 1.65 Production (zinc in concentrate) Kt 62 69 550-580 Sales (zinc in concentrate) Kt 126 132 Production (refined zinc) Kt 55 69 270-290 Sales (refined zinc) Kt 89 145 Total cash unit costs US$/lb 0.68 0.49 0.68-0.78 Net cash unit costs US$/lb 0.69 0.46 0.50-0.60 Q1 2023 Q1 2022 Gross revenue $M 616 920 Gross profit $M 128 247 EBITDA $M 161 298 Capital expenditures $M 49 43 EBITDA is a non-GAAP financial measure. Total cash unit costs per pound and net cash unit costs per pound are non-GAAP ratios. See “Non-GAAP Financial Measures and Ratios” slides. 13
  • 14.
    Global Metals andMining Conference Operating Metrics Financial Metrics • Steelmaking coal prices remained well above historic averages, despite the decline in the quarter • Strong mining productivity and utilization of available equipment rates, reflective of pre-pandemic rates • Higher transportation costs due to rail rates and port costs from increased utilization of third-party terminals Q1 2023 Highlights • FY2023 guidance remains unchanged. • Expected sales of 6.2-6.6Mt in Q2 2023 Looking Forward Q1 2023 Q1 2022 FY23 Guidance Realized price US$/t 282 357 Production Mt 6.0 5.6 24.0-26.0 Sales Mt 6.2 6.0 Adj. site cash cost of sales $/t 89 77 88-96 Transportation costs $/t 50 46 45-48 Total unit costs $/t 139 123 Steelmaking Coal Business Unit Q1 2023 Q1 2022 Gross revenue $M 2,406 2,766 Gross profit $M 1,277 1,780 EBITDA $M 1,783 2,095 Capital expenditures $M 328 240 EBITDA is a non-GAAP financial measure. Adjusted site cash cost of sales per tonne and total unit costs per tonne are non-GAAP ratios. See “Non-GAAP Financial Measures and Ratios” slides. 14
  • 15.
    Global Metals andMining Conference Strong Financial Position Liquidity1 $8.0B Net Debt to Adjusted EBITDA2 0.6x Strong Balance Sheet Net debt to adjusted EBITDA is a non-GAAP ratio. See “Non-GAAP Financial Measures and Ratios” slides. Moody’s Baa3 Fitch BBB- Credit Ratings1 S&P BBB- Debt Maturity Ladder2 (US$M) C$144M in notes redeemed in Q1 2023 C$1.3B in debt repaid in 2022; no note maturities to 2030 Significant Cash Returns To Shareholders ($M) $321M in dividends in Q1 2023 $1.0B in dividends and $2.5B in share buybacks in past five years Dividends paid Share buybacks Notes outstanding QB2 Project Finance Facility $0 $500 $1,000 $1,500 $2,000 $2,500 2018 2019 2020 2021 2022 $1.4B $0.5B 294 797 147 336 473 396 395 367 2023 2024 2025 2026 2027 2028 2029 2030 2031 2032 2033 2034 2035 2036 2037 2038 2039 2040 2041 2042 2043 per year 15
  • 16.
    Global Metals andMining Conference Jonathan Price Chief Executive Officer
  • 17.
    Global Metals andMining Conference Sustainability leadership Focus on execution Balance growth and cash returns to shareholders Industry leading copper growth Long-term sustainable shareholder value Driving Long-Term Sustainable Shareholder Value Capitalizing on strong demand in the transition to a low-carbon economy
  • 18.
    Global Metals andMining Conference Appendix
  • 19.
    Global Metals andMining Conference Production Guidance 2022 Actual Previous 2023 Guidance Current 2023 Guidance1 Previous 2024-2026 Guidance Current 2024-2026 Guidance1 Copper2,3,4 Highland Valley 119.1 110-118 110-118 120-165 120-165 Antamina 102.3 90-97 90-97 90-100 90-100 Carmen de Andacollo 39.5 40-50 40-50 50-60 50-60 Quebrada Blanca 9.6 150-180 150-180 285-315 285-315 Total 270.5 390-445 390-445 545-640 545-640 Copper Kt, except as noted. 19 2022 Actual Previous 2023 Guidance Current 2023 Guidance1 Previous 2024-2026 Guidance Current 2024-2026 Guidance1 Zinc in concentrate2,3,5 Red Dog 553.1 550-580 550-580 500-550 500-550 Antamina 97.4 95-105 95-105 55-95 55-95 Total 650.5 645-685 645-685 555-645 555-645 Refined zinc Trail Operations 248.9 270-290 270-290 280-310 280-310 Zinc 2022 Actual Previous 2023 Guidance Current 2023 Guidance1 Previous 2024-2026 Guidance Current 2024-2026 Guidance1 Steelmaking coal (Mt) 21.5 24.0-26.0 24.0-26.0 24.0-26.0 24.0-26.0 Steelmaking Coal 2022 Actual Previous 2023 Guidance Current 2023 Guidance1 Previous 2024-2026 Guidance Current 2024-2026 Guidance1 Molybdenum2,3 (Mlbs) Highland Valley 1.0 0.8-1.2 0.8-1.2 2.0-6.0 2.0-6.0 Antamina 1.5 2.2-2.6 2.2-2.6 2.0-4.0 2.0-4.0 Quebrada Blanca - 1.5-3.0 1.5-3.0 10.0-14.0 10.0-14.0 Total 2.5 4.5-6.8 4.5-6.8 14.0-24.0 14.0-24.0 Lead2 Red Dog 79.5 110-125 110-125 85-95 85-95 Other Base Metals
  • 20.
    Global Metals andMining Conference Unit Cost and Sales Guidance Total cash unit costs per pound, net cash unit costs per pound, and adjusted site cash cost of sales per tonne are non-GAAP ratios. See “Non-GAAP Financial Measures and Ratios” slides. Zinc3 Steelmaking Coal Copper2 (US$/lb) 2022 Actual Previous 2023 Guidance Current 2023 Guidance1 Total cash unit costs 2.02 2.05-2.25 2.05-2.25 Net cash unit costs4 1.56 1.60-1.80 1.60-1.80 (US$/lb) 2022 Actual Previous 2023 Guidance Current 2023 Guidance1 Total cash unit costs 0.58 0.68-0.78 0.68-0.78 Net cash unit costs4 0.44 0.50-0.60 0.50-0.60 (C$/tonne) 2022 Actual Previous 2023 Guidance Current 2023 Guidance1 Adjusted site cash cost of sales 89 88-96 88-96 Transportation costs 47 45-48 45-48 Unit Costs Sales (kt) Q1 2023 Actual Current Q2 2023 Guidance1 Red Dog zinc in concentrate 89 45-55 (Mt) Q1 2023 Actual Current Q2 2023 Guidance1 Steelmaking coal 6.2 6.2-6.6 Zinc Steelmaking Coal 20
  • 21.
    Global Metals andMining Conference 2022 Actual Previous 2023 Guidance Current 2023 Guidance1 Sustaining Copper2 $ 297 $ 510 $ 510 Zinc 244 150 150 Steelmaking coal3 520 760 760 Corporate 17 10 10 $ 1,078 $ 1,430 $ 1,430 Growth Copper4 $ 217 $ 250 $ 250 Zinc 37 80 80 Steelmaking coal 30 30 30 Corporate 1 - - $ 285 $ 360 $ 360 Total Copper $ 514 $ 760 $ 760 Zinc 281 230 230 Steelmaking coal 550 790 790 Corporate 18 10 10 $ 1,363 $ 1,790 $ 1,790 QB2 development capital 3,060 1,200–1,750 $1,650-2,200 Total before SMM/SC contributions 4,423 2,990-3,540 3,440-3,990 Estimated SMM/SC contributions to capital expenditures (1,090) (520)-(700) (670)-(850) Estimated QB2 project financing draw to capital expenditures (315) - - Total, net of partner contributions and project financing $ 3,018 $ 2,470-2,840 $ 2,770-3,140 Capital Expenditures Guidance Sustaining and Growth Capital Capitalized Stripping 2022 Actual Previous 2023 Guidance Current 2023 Guidance1 Capitalized Stripping Copper $ 336 $ 295 $ 295 Zinc 89 55 55 Steelmaking coal 617 750 750 $ 1,042 $ 1,100 $ 1,100 Teck’s share in C$ millions, except as noted. 21
  • 22.
    Global Metals andMining Conference Water Treatment Guidance C$ millions, except as noted. 2022 Actual Previous 2023 Guidance Current 2023 Guidance2 Previous 2023-2024 Guidance Current 2023-2024 Guidance2 Previous Long-Term Guidance (C$/tonne) Current Long-Term Guidance3 (C$/tonne) Sustaining capital for water management and water treatment, including October 2020 Direction issued by Environment and Climate Change Canada $ 184 $ 220 $ 220 $ 450-550 $ 450-550 $ 2.00 $ 2.00 Steelmaking Coal Capital Expenditures Related to Water Treatment1 2022 Actual Previous 2023 Guidance Current 2023 Guidance2 Previous 2023-2024 Guidance Current 2023-2024 Guidance2 Previous Long-Term Guidance (C$/tonne) Current Long-Term Guidance3 (C$/tonne) Operating costs associated with water treatment $ 1.50 – – $ 3.00-5.00 $ 3.00-5.00 Steelmaking Coal Operating Costs Related to Water Treatment1 (C$/tonne) 22
  • 23.
    Global Metals andMining Conference Sensitivities 2023 Mid-Range Production Estimates2 Changes Estimated Effect on Profit Attributable to Shareholders3 ($ in millions) Estimated Effect on EBITDA3 ($ in millions) US$ exchange C$0.01 $ 60 $ 98 Copper (kt) 417.5 US$0.01/lb 6 11 Zinc (kt)4 945.0 US$0.01/lb 9 12 Steelmaking Coal (Mt) 25.0 US$1/t 19 29 WTI5 US$1/bbl 3 5 EBITDA is a non-GAAP financial measure. See “Non-GAAP Financial Measures and Ratios” slides. Sensitivity of our Annualized Profit Attributable to Shareholders and EBITDA1
  • 24.
    Global Metals andMining Conference Settlement Pricing Adjustments Outstanding at March 31, 2023 Outstanding at December 31, 2022 Quarterly Pricing Adjustments Mlbs US$/lb Mlbs US$/lb C$M Copper 134 $ 4.08 168 $ 3.80 $62 Zinc 146 1.33 218 1.35 7 Steelmaking Coal 25 Other (7) Total $ 87 Simplified Settlement Pricing Adjustment Model for Base Metals (Pre-tax settlement pricing adjustment in C$M) 24
  • 25.
    Global Metals andMining Conference Endnotes Slide 15: Strong Financial Position 1. As at April 25, 2023. 2. As at March 31, 2023. Excludes short-term loans at Carmen de Andacollo and loans at Antamina. Slide 19: Production Guidance 1. As at April 25, 2023. See Teck’s Q1 2023 press release for further details. 2. Metal contained in concentrate. 3. We include 100% of production and sales from our Quebrada Blanca and Carmen de Andacollo mines in our production and sales volumes, even though we do not own 100% of these operations, because we fully consolidate their results in our financial statements. We include 22.5% of production and sales from Antamina, representing our proportionate ownership interest. 4. Copper production includes cathode production at Quebrada Blanca and Carmen de Andacollo. 5. Total zinc includes co-product zinc production from our 22.5% proportionate interest in Antamina. Slide 20: Unit Cost and Sales Guidance 1. As at April 25, 2023. See Teck’s Q1 2023 press release for further details. 2. Copper unit costs are reported in U.S. dollars per payable pound of metal contained in concentrate. Copper net cash unit costs include adjusted cash cost of sales and smelter processing charges, less cash margins for by-products including co-products. Guidance for 2023 assumes a zinc price of US$1.45 per pound, a molybdenum price of US$17.00 per pound, a silver price of US$20 per ounce, a gold price of US$1,755 per ounce and a Canadian/U.S. dollar exchange rate of $1.33. Excludes Quebrada Blanca. Cash margins for by-products are non-GAAP financial measures. See “Non-GAAP Financial Measures” slides. 3. Zinc unit costs are reported in U.S. dollars per payable pound of metal contained in concentrate. Zinc net cash unit costs are mine costs including adjusted cash cost of sales and smelter processing charges, less cash margins for by-products. Guidance for 2023 assumes a lead price of US$0.90 per pound, a silver price of US$20 per ounce and a Canadian/U.S. dollar exchange rate of $1.33. By-products include both by-products and co-products. 4. After co-product and by-product margins and excluding Quebrada Blanca. Slide 21: Capital Expenditures Guidance 1. As at April 25, 2023. See Teck’s Q1 2023 press release for further details. 2. Copper sustaining capital guidance for 2023 includes Quebrada Blanca concentrate operations. 3. Steelmaking coal sustaining capital 2023 guidance includes $220 million of water treatment capital. 2022 guidance includes $200 million of water treatment capital. 4. Copper growth capital guidance for 2023 includes studies for HVC 2040, Zafranal, San Nicolás, NewRange Copper Nickel (formerly Mesaba, NorthMet), QBME, Galore Creek, Schaft Creek and NuevaUnión. Slide 22: Water Treatment Guidance 1. As at April 25, 2023. See Teck’s Q1 2023 press release for further details. 2. The 2023 portion is included in 2023 guidance. See Teck’s Q1 2023 press release for further details on the October 2020 Direction issued by Environment and Climate Change Canada. 3. Assumes 21.5Mt in 2022 and 26-27 million tonnes long term. Slide 23: Sensitivities 1. As at April 25, 2023. The sensitivity of our annualized profit(loss) attributable to shareholders and EBITDA to changes in the Canadian/U.S. dollar exchange rate and commodity prices, before pricing adjustments, based on our current balance sheet, our 2023 mid-range production estimates, current commodity prices and a Canadian/U.S. dollar exchange rate of $1.30. 2. All production estimates are subject to change based on market and operating conditions. 3. The effect on our profit (loss) attributable to shareholders and on EBITDA of commodity price and exchange rate movements will vary from quarter to quarter depending on sales volumes. Our estimate of the sensitivity of profit and EBITDA to changes in the U.S. dollar exchange rate is sensitive to commodity price assumptions. 4. Zinc includes 280,000 tonnes of refined zinc and 665,000 tonnes of zinc contained in concentrate. 5. Our WTI oil price sensitivity takes into account the change in operating costs across our business units, as our operations use a significant amount of diesel fuel. 25
  • 26.
    Global Metals andMining Conference Non-GAAP Financial Measures and Ratios
  • 27.
    Global Metals andMining Conference Non-GAAP Financial Measures and Ratios Our financial results are prepared in accordance with International Financial Reporting Standards (IFRS) as issued by the International Accounting Standards Board. This presentation includes reference to certain non-GAAP financial measures and non-GAAP ratios, which are not measures recognized under IFRS, do not have a standardized meaning prescribed by IFRS and may not be comparable to similar financial measures or ratios disclosed by other issuers. These financial measures and ratios have been derived from our financial statements and applied on a consistent basis as appropriate. We disclose these financial measures and ratios because we believe they assist readers in understanding the results of our operations and financial position and provide further information about our financial results to investors. These measures should not be considered in isolation or used in substitute for other measures of performance prepared in accordance with IFRS. For more information on our use of non-GAAP financial measures and ratios, see the section titled “Use of Non-GAAP Financial Measures and Ratios” in our most recent Management Discussion & Analysis, which is incorporated by reference herein and is available on SEDAR at www.sedar.com. Additional information on certain non-GAAP ratios is below. Non-GAAP Ratios Adjusted site cash cost of sales per tonne – Adjusted site cash cost of sales per tonne for our steelmaking coal operations is defined as the cost of the product as it leaves the mine excluding depreciation and amortization charges, out-bound transportation costs and any one-time collective agreement charges and inventory write-down provisions. Total cash unit costs per pound – Total cash unit costs per pound for our copper and zinc operations includes adjusted cash costs of sales, as described below, plus the smelter and refining charges added back in determining adjusted revenue. This presentation allows a comparison of total cash unit costs, including smelter charges, to the underlying price of copper or zinc in order to assess the margin for the mine on a per unit basis. Net cash unit costs per pound – Net cash unit costs of principal product per pound, after deducting co-product and by-product margins, are also a common industry measure. By deducting the co- and by-product margin per unit of the principal product, the margin for the mine on a per unit basis may be presented in a single metric for comparison to other operations. Unit costs per tonne - Unit costs per tonne for our steelmaking coal operations are total cost of goods sold, divided by tonnes sold in the period, excluding depreciation and amortization charges. We include this information as it is frequently requested by investors and investment analysts who use it to assess our cost structure and margins and compare it to similar information provided by many companies in the industry. Net debt to adjusted EBITDA ratio – Net debt to adjusted EBITDA ratio is net debt divided by adjusted EBITDA for the twelve months ended at the reporting period, expressed as the number of times adjusted EBITDA needs to be earned to repay the net debt. Adjusted diluted earnings per share – Adjusted diluted earnings per share is adjusted profit attributable to shareholders divided by average number of fully diluted shares in a period. 27
  • 28.
    Global Metals andMining Conference Reconciliation of Segment EBITDA Reconciliation between Segmented Profit and Segmented EBITDA 3 months ending March 31, 2023 Copper Zinc Steelmaking Coal Corporate Total Profit (Loss) before Taxes $M 423 105 1,492 (164) 1,856 Net finance expense $M 120 11 25 (126) 30 Depreciation and amortization $M 112 45 266 - 423 Segmented EBITDA $M 655 161 1,783 (290) 2,309 3 months ending March 31, 2022 Copper Zinc Steelmaking Coal Corporate Total Profit (Loss) before Taxes $M 383 228 1,821 (64) 2,368 Net finance expense $M 35 12 22 (26) 43 Depreciation and amortization $M 105 58 252 - 415 Segmented EBITDA $M 523 298 2,095 (90) 2,826 28
  • 29.
    Global Metals andMining Conference April 26, 2023 First Quarter 2023 Conference Call