SlideShare a Scribd company logo
© Eastgate Advisors, llc, 2016 Page 1
Eastgate Advisors, llc
Quarterly Review and Outlook
Other Key Indicators Qtr-End Prev Qtr-End Year-End 2015
10-Year US Treasury Bond Yield 1.6% 1.5% 2.3%
CBOE VIX S&P 500 index implied volatility (annualized %) 13.3% 15.6% 18.2%
Shiller S&P 500 Cyclical Price-to-Earnings Ratio (trailing 10-year) 26.4 26.7 24.2
Brent Crude Oil price/barrel $46 $48 $37
US Industrial Production (y/y % change, seasonally adjusted) -1.0% -0.6% -2.3%
US Personal Consumption x food & energy (y/y % change,sa) +1.7% +1.6% +1.4%
US Consumer Price Index all items (y/y % change, sa) +1.5% +1.0% +0.7%
US 5-Year Inflation Expectations, 5-Years Forward +1.8% +1.4% +1.8%
US Real GDP (y/y % change, sa) +1.5% +1.3% +1.9%
Quarter in Review
Ruminations on the UK’s “Brexit” vote and US presidential campaign held investor attention during the typically dull
summer vacation period in the US and Europe. The US Federal Reserve declined to raise its Fed Funds rate in July and
September but hinted at the possibility of one increase before year-end. The US dollar weakened against major
currencies helping US dollar denominated investors in non-US markets. Even though the S&P 500 index reached a
historic high in September, reported earnings among index constituents may have fallen for the sixth consecutive
quarter. Non-US equities out-performed US equities. Emerging markets debt and equities out-performed developed
markets driven by improving economic fundamentals. The table below shows the yields on severalten-year sovereign
debt issues at quarter-end. US 10-year treasury yields look attractive to yield seeking investors compared with those of
other major sovereign debt issues and shows that lower US yields are possible. We note that the 10-year US Treasury
hit a historic low yield under 1.4% in July. One-third of global sovereign debt carried negative yields at quarter-end.
US Treasury
10-Year Yield
German Bund
10-Year Yield
Japan JGB
10-Year Yield
United Kingdom Guilt
10-Year Yield
Swiss
10-Year Yield
+1.6% -0.1% -0.1% +0.7% -0.5%
Index Returns Quarter 1-Year 3-Years 5-Years
MSCI All Country World stockindex 5.3% 12.0% 5.2% 10.6%
S&P 500 index 3.8% 15.4% 11.2% 16.4%
Barclays US Universal Bond index 1.0% 6.1% 4.3% 3.6%
Citi 3-month US Treasury Bill index 0.07% 0.20% 0.09% 0.08%
Bloomberg Broad Commodities Index -3.9% -2.6% -12.3% -9.4%
Eastgate Advisors’ Returns1
Quarter 1-Year 3-Years 5-Years
Moderate Risk Global Asset Allocation Net-of-Fee Composite1 3.4% 8.0% 3.7% 6.7%
Moderate Risk Strategic Benchmark2 (@ -10% down-side risk) 3.0% 8.6% 4.5% 6.8%
MorningstarWorld Allocation Net-of-Fee Universe (806 funds) 3.1% 8.3% 2.8% 6.7%
Other Global Asset Allocation Strategy Benchmark Returns Quarter 1-Year 3-Years 5-Years
Conservative Allocation (@ -5% down-side risk) 2.4% 7.6% 4.3% 5.9%
Growth Allocation (@ -15% down-side risk) 3.7% 9.8% 4.8% 8.1%
Aggressive Allocation (@ -20% down-side risk) 4.6% 11.2% 5.1% 9.6%
© Eastgate Advisors, llc, 2016 Page 2
*Based on quarter-end manager holdings. Gross exposures may not sum to 100%.
Return Analysis
Our return objective is to out-perform the strategic benchmark after fees, over a three-to-five-year investment horizon.
We seek to add value through asset allocation decisions, external manager selection, manager allocation decisions, by
managing investment risk, maintaining adequate liquidity and controlling investment costs.
Active Decision Quarterly Value Added Versus The Strategic Benchmark
Asset Allocation +0.41%
Manager Selection +0.01%
Manager Allocation -0.01%
Total Quarterly Net-of-Fee Value Added: +0.41%
What affected returns during the quarter?
Underlying holdings analysis at quarter-end showed that we had higher small and mid-cap global equity exposures,
more non-US fixed income and more non-dollar bonds than the strategic benchmark. Other key factors that affected
returns:
 An over-weight to global equities helped but an under-weight to emerging markets hurt performance.
 An over-weight to emerging market bonds and non-investment grade debt helped.
 An under-weight to money markets helped as global equities and bonds performed well.
 The alpha portfolio (active managers) under-performed the passive global markets portfolio.
Risk Management
In managing investment risks, we seek to eliminate idiosyncratic risks, to manage market and active risks and control
leverage in order to keep annual down-side risk at no more than -10% in nine-of-ten years while maintaining adequate
liquidity and earning a return which we believe fairly compensates investors for risk. We have explicit allocation limits
in place for each active manager. We also have a 3% maximum annual active risk budget. This means that we should
expect to earn the return of the strategic benchmark plus or minus 3% in seven-of-ten years. That is why the strategic
benchmark is a key part of our investment process.
Key Risk Metrics Metric Value Q/Q Change
Estimated 12-month down-side risk potential (@ 90% confidence): -9% (+)
Risk relative to the strategic benchmark (leverage): 1.0 x (-)
% of return explained by the strategic benchmark allocation (R2): 97% (-)
Estimated annual active risk (tracking error): 1.1% (+)
Active allocations % of total fund (active managers + tactical allocations): 31% (+)
Weighted average annual expense ratio: 0.33% (+)
Number of global stocks (idiosyncraticrisk indicator): 5,377 (-)
Number of global bonds: 6,760 (+)
Estimated interest rate sensitivity relative to the strategic benchmark index: 100% (-)
Asset Class Allocations* US Equities
Non-US
Equities
Global Bonds Commodities
Money
Markets
Eastgate Moderate Risk Weight 30.1% 23.1% 38.7% 1.0% 7.7%
Strategic Benchmark Weight 26.1% 23.9% 40.0% 0.0% 10.0%
Eastgate Advisors Over/Under Weight +4.0% -0.8% -1.3% 1.0% -2.3%
© Eastgate Advisors, llc, 2016 Page 3
Looking Ahead
We are not focused on a quarter-to-quarter or a year-to-year investment horizon. Strategically, we maintain exposure to
global markets with historic risk premia in excess of the return of a risk-free asset,like a treasury bill. We seek to
control costs, manage risks and maintain adequate liquidity. Over a one-to-three year investment horizon, we
determine tactical allocations to global equities, global bonds, commodities, and money markets based on valuations
and our expectations for inflation and economic growth. In attempting to add additional value, we may use active
external investment managers with whom we have had years of favorable experiences.
Our three-to-five year strategic outlook is for slow global economic growth and modest inflation. The global economy
remains mired in an excess debt induced, low growth environment. Sovereign bond yields in severaleconomies reflect
deflationary pressures. Market expectations for US inflation over the next five years are under 2% with modest
inflation in most developed global economies. The US Treasury yield curve has flattened since December 31, 2015
driven by high demand for yield from pension funds, insurance companies and global investors whose local sovereign
bonds carry negative yields. This dynamic may continue as long as US treasuries hold a yield advantage over other
sovereign issues and it puts upward pressure on the US dollar in what is likely a rising short-rate environment in the
US. Our one-to-three year tactical outlook suggests a near benchmark weight to global public equities relative to the
strategic benchmark and a higher volatility investing regime.
Based on our bottom-up fundamental input models, we expect public global equity market returns in the mid-single
digits over our three-to-five year strategic investment horizon. The yield-to-maturity of the Barclays US Universal
index (our preferred bond index) implies expected annual returns to US bonds under 2.4% over our strategic
investment horizon. Rising rates would reduce realized bond market returns further. Market estimates of the Fed Funds
rate imply money market returns near one percent over our one-to-three year tactical investment horizon. Barring an
unexpected rise in global inflation or consumption driven growth, commodities as an asset class remain unattractive
given weak global demand and an over-supply for many of them although we added an allocation to gold via an
exchange traded fund (ETF) as a volatility hedge during the quarter.
Risks to allocations over our investment horizon include excessive debt in major global economies which increase
deflationary pressures that harm growth prospects. Risks also include unanticipated inflation; a significant geopolitical
shock, an emerging markets crisis or a contagion effect of the British exit from the EU. The impact of the UK’s exit
from the European Union on both the UK and EU is a big unknown and is likely to only be realized over severalyears.
Reduced trading liquidity in corporate bonds, to which we are over-weight relative to the strategic allocation
benchmark, continues to be a concern. High equity valuations increase the risks of investing in the asset class if
corporate earnings continue to decline. Price-to-earnings ratio (multiple) expansion and not earnings growth has
sustained US equity market returns over the past couple of years. We don’t expect this to continue.
Thank you for taking time to read our thoughts. Contact Greg Johnsen, CFA with questions or comments at:
gjohnsen@eastgateadv.com. Connect with Greg on Linked In. His Linked In profile: gregjohnsencfa.
Important Disclosures
1The Eastgate Advisors’ Moderate Risk global allocation composite return is the realized net-of-fees, assetweighted,geometric
average total return of several public markets accounts of a private familyinvestmentoffice. Returns in excess of one-year are
annualized.Returns are through 9-30-2016.
2 The Moderate Risk Allocation strategic benchmark is an unmanaged combination ofbroad marketindices.It consists of50% of
the return of the MSCI All Country World ™ stock index (net), 40% of the Barclays US Universal Bond ™ index and 10% US
treasury bills.
Holdings analytics:Morningstar Advisor Workstation. Performance analysis and attribution:Eastgate Advisors,llc.
Economic data sources:US Federal Reserve,US Departmentofthe Treasury, US Bureau of Economic Analysis,RobertShiller,the
Economist,World Bank,International Monetary Fund, Factset Research Systems.
Visit our website: www.eastgateadvisors.com or Linked In companypage: https://www.linkedin.com/company/eastgate-advisors?

More Related Content

What's hot

2012 Q3 NIFCU$ Market Commentary (Article for Credit Unions)
2012 Q3 NIFCU$ Market Commentary (Article for Credit Unions)2012 Q3 NIFCU$ Market Commentary (Article for Credit Unions)
2012 Q3 NIFCU$ Market Commentary (Article for Credit Unions)
NAFCU Services Corporation
 
RWC Investment Introduction Presentation
RWC Investment Introduction PresentationRWC Investment Introduction Presentation
RWC Investment Introduction Presentation
Sprague Kolp
 
Inr outlook june 2020
Inr outlook june 2020Inr outlook june 2020
Inr outlook june 2020
TariqCarrimjee
 
Investing for Doctors | Q3 Market Review
Investing for Doctors | Q3 Market ReviewInvesting for Doctors | Q3 Market Review
Investing for Doctors | Q3 Market Review
LFGmarketing
 
Premia Weekly Market Commentary April 22 2019
Premia Weekly Market Commentary April 22 2019Premia Weekly Market Commentary April 22 2019
Premia Weekly Market Commentary April 22 2019
TJ Villamil
 
Capital Markets Review Q1 2009
Capital Markets Review Q1 2009Capital Markets Review Q1 2009
Capital Markets Review Q1 2009dkeogh
 
Vanguard’s 2015 economic and investment outlook
Vanguard’s 2015  economic  and investment outlookVanguard’s 2015  economic  and investment outlook
Vanguard’s 2015 economic and investment outlook
João Pinto
 
Dealing With Divergences - Blackrock 2015 Outlook
Dealing With Divergences - Blackrock 2015 OutlookDealing With Divergences - Blackrock 2015 Outlook
Dealing With Divergences - Blackrock 2015 Outlook
João Pinto
 
4 q15 investment commentary
4 q15 investment commentary4 q15 investment commentary
4 q15 investment commentary
melanig123
 
New Market Highs and Positive Expected Returns
New Market Highs and Positive Expected ReturnsNew Market Highs and Positive Expected Returns
New Market Highs and Positive Expected Returns
Rich Schuette
 
Straight Forward - Winter 2017
Straight Forward - Winter 2017Straight Forward - Winter 2017
Straight Forward - Winter 2017
TD Wealth Private Investment Advice
 
Quarterly Market Review Q1 2020
Quarterly Market Review Q1 2020Quarterly Market Review Q1 2020
Quarterly Market Review Q1 2020
Susan Langdon
 
Market Review - 2nd Quarter 2015
Market Review - 2nd Quarter 2015Market Review - 2nd Quarter 2015
Market Review - 2nd Quarter 2015
melanig123
 
Investing for Physicians | Q2 Market Review
Investing for Physicians | Q2 Market ReviewInvesting for Physicians | Q2 Market Review
Investing for Physicians | Q2 Market Review
LFGmarketing
 
ATRADIUS Payment-Practices-Barometer-ASIA PACIFIC Ene17
ATRADIUS Payment-Practices-Barometer-ASIA PACIFIC Ene17ATRADIUS Payment-Practices-Barometer-ASIA PACIFIC Ene17
ATRADIUS Payment-Practices-Barometer-ASIA PACIFIC Ene17
Jaime Cubillo Fleming
 
JPM Prime Brokerage Global Hedge Fund Trends November 2013
JPM Prime Brokerage Global Hedge Fund Trends November 2013JPM Prime Brokerage Global Hedge Fund Trends November 2013
JPM Prime Brokerage Global Hedge Fund Trends November 2013Brian Shapiro
 

What's hot (19)

2012 Q3 NIFCU$ Market Commentary (Article for Credit Unions)
2012 Q3 NIFCU$ Market Commentary (Article for Credit Unions)2012 Q3 NIFCU$ Market Commentary (Article for Credit Unions)
2012 Q3 NIFCU$ Market Commentary (Article for Credit Unions)
 
RWC Investment Introduction Presentation
RWC Investment Introduction PresentationRWC Investment Introduction Presentation
RWC Investment Introduction Presentation
 
Inr outlook june 2020
Inr outlook june 2020Inr outlook june 2020
Inr outlook june 2020
 
TAP QuarterlyLetter 201603
TAP QuarterlyLetter 201603TAP QuarterlyLetter 201603
TAP QuarterlyLetter 201603
 
Investing for Doctors | Q3 Market Review
Investing for Doctors | Q3 Market ReviewInvesting for Doctors | Q3 Market Review
Investing for Doctors | Q3 Market Review
 
Q3 Investment Review
Q3 Investment ReviewQ3 Investment Review
Q3 Investment Review
 
Premia Weekly Market Commentary April 22 2019
Premia Weekly Market Commentary April 22 2019Premia Weekly Market Commentary April 22 2019
Premia Weekly Market Commentary April 22 2019
 
Capital Markets Review Q1 2009
Capital Markets Review Q1 2009Capital Markets Review Q1 2009
Capital Markets Review Q1 2009
 
Q2 Investment Review
Q2 Investment ReviewQ2 Investment Review
Q2 Investment Review
 
Vanguard’s 2015 economic and investment outlook
Vanguard’s 2015  economic  and investment outlookVanguard’s 2015  economic  and investment outlook
Vanguard’s 2015 economic and investment outlook
 
Dealing With Divergences - Blackrock 2015 Outlook
Dealing With Divergences - Blackrock 2015 OutlookDealing With Divergences - Blackrock 2015 Outlook
Dealing With Divergences - Blackrock 2015 Outlook
 
4 q15 investment commentary
4 q15 investment commentary4 q15 investment commentary
4 q15 investment commentary
 
New Market Highs and Positive Expected Returns
New Market Highs and Positive Expected ReturnsNew Market Highs and Positive Expected Returns
New Market Highs and Positive Expected Returns
 
Straight Forward - Winter 2017
Straight Forward - Winter 2017Straight Forward - Winter 2017
Straight Forward - Winter 2017
 
Quarterly Market Review Q1 2020
Quarterly Market Review Q1 2020Quarterly Market Review Q1 2020
Quarterly Market Review Q1 2020
 
Market Review - 2nd Quarter 2015
Market Review - 2nd Quarter 2015Market Review - 2nd Quarter 2015
Market Review - 2nd Quarter 2015
 
Investing for Physicians | Q2 Market Review
Investing for Physicians | Q2 Market ReviewInvesting for Physicians | Q2 Market Review
Investing for Physicians | Q2 Market Review
 
ATRADIUS Payment-Practices-Barometer-ASIA PACIFIC Ene17
ATRADIUS Payment-Practices-Barometer-ASIA PACIFIC Ene17ATRADIUS Payment-Practices-Barometer-ASIA PACIFIC Ene17
ATRADIUS Payment-Practices-Barometer-ASIA PACIFIC Ene17
 
JPM Prime Brokerage Global Hedge Fund Trends November 2013
JPM Prime Brokerage Global Hedge Fund Trends November 2013JPM Prime Brokerage Global Hedge Fund Trends November 2013
JPM Prime Brokerage Global Hedge Fund Trends November 2013
 

Similar to Q3 2016 Review and Outlook

Q1 2019 Quarterly Market Review
Q1 2019 Quarterly Market ReviewQ1 2019 Quarterly Market Review
Q1 2019 Quarterly Market Review
Susan Langdon
 
Q4 2018 Quarterly Market Commentary
Q4 2018 Quarterly Market CommentaryQ4 2018 Quarterly Market Commentary
Q4 2018 Quarterly Market Commentary
Susan Langdon
 
Q2 2020 Quarterly Market Review
Q2 2020 Quarterly Market ReviewQ2 2020 Quarterly Market Review
Q2 2020 Quarterly Market Review
Susan Langdon
 
2016 ETF and investment outlook
2016 ETF and investment outlook2016 ETF and investment outlook
2016 ETF and investment outlook
Ying wei (Joe) Chou
 
Alhuda CIBE - RIETs International Allocation Views
Alhuda CIBE - RIETs International Allocation ViewsAlhuda CIBE - RIETs International Allocation Views
Alhuda CIBE - RIETs International Allocation Views
Alhuda Centre of Islamic Banking & Economics
 
Market Perspectives - December 2016
Market Perspectives - December 2016Market Perspectives - December 2016
Market Perspectives - December 2016
Mark Biegel
 
JG HELLER Global Q2 2015 Review LinkedIn
JG HELLER Global Q2 2015 Review LinkedInJG HELLER Global Q2 2015 Review LinkedIn
JG HELLER Global Q2 2015 Review LinkedInJonathan G. Heller
 
Qmr q215 2015_landscape
Qmr q215 2015_landscapeQmr q215 2015_landscape
Qmr q215 2015_landscape
mclean8200
 
The Linkous Group, LTD Market Review - Q2 2015
The Linkous Group, LTD Market Review - Q2 2015The Linkous Group, LTD Market Review - Q2 2015
The Linkous Group, LTD Market Review - Q2 2015
Susan Linkous, AIF®
 
Why To Diversify
Why To DiversifyWhy To Diversify
Why To Diversify
Connell McNamara, APMA®
 
Callan 2017-2026 Capital Market Projections
Callan 2017-2026 Capital Market ProjectionsCallan 2017-2026 Capital Market Projections
Callan 2017-2026 Capital Market Projections
Callan
 
Asset Allocation And Your Portfolio
Asset Allocation And Your PortfolioAsset Allocation And Your Portfolio
Asset Allocation And Your Portfolio
WilliamDeye
 
Q2 2020 Market Review
Q2 2020 Market ReviewQ2 2020 Market Review
Q2 2020 Market Review
Paul Ohanian, CFP®
 
Elevation Wealth Management - 2nd Quarter In Review
Elevation Wealth Management - 2nd Quarter In ReviewElevation Wealth Management - 2nd Quarter In Review
Elevation Wealth Management - 2nd Quarter In Review
Barry Mendelson
 
Q3 2020 Quarterly Market Review
Q3 2020 Quarterly Market ReviewQ3 2020 Quarterly Market Review
Q3 2020 Quarterly Market Review
Susan Langdon
 
Financial Synergies | Q4 2019 Market Review
Financial Synergies | Q4 2019 Market ReviewFinancial Synergies | Q4 2019 Market Review
Financial Synergies | Q4 2019 Market Review
Financial Synergies Wealth Advisors, Inc.
 
Monthly Systematic Product Review - Jan 2015
Monthly Systematic Product Review - Jan 2015Monthly Systematic Product Review - Jan 2015
Monthly Systematic Product Review - Jan 2015Christos Spanos
 
ASI Wealth Management & Consulting Services - Q1 Quarterly Market Review
ASI Wealth Management & Consulting Services - Q1 Quarterly Market ReviewASI Wealth Management & Consulting Services - Q1 Quarterly Market Review
ASI Wealth Management & Consulting Services - Q1 Quarterly Market Review
Susan Langdon
 
McLean Asset Management - Quarterly Market Review for 2015 Q1
McLean Asset Management - Quarterly Market Review for 2015 Q1McLean Asset Management - Quarterly Market Review for 2015 Q1
McLean Asset Management - Quarterly Market Review for 2015 Q1
mclean8200
 

Similar to Q3 2016 Review and Outlook (20)

Q1 2019 Quarterly Market Review
Q1 2019 Quarterly Market ReviewQ1 2019 Quarterly Market Review
Q1 2019 Quarterly Market Review
 
Q4 2018 Quarterly Market Commentary
Q4 2018 Quarterly Market CommentaryQ4 2018 Quarterly Market Commentary
Q4 2018 Quarterly Market Commentary
 
Q2 2020 Quarterly Market Review
Q2 2020 Quarterly Market ReviewQ2 2020 Quarterly Market Review
Q2 2020 Quarterly Market Review
 
2016 ETF and investment outlook
2016 ETF and investment outlook2016 ETF and investment outlook
2016 ETF and investment outlook
 
Alhuda CIBE - RIETs International Allocation Views
Alhuda CIBE - RIETs International Allocation ViewsAlhuda CIBE - RIETs International Allocation Views
Alhuda CIBE - RIETs International Allocation Views
 
Market Perspectives - December 2016
Market Perspectives - December 2016Market Perspectives - December 2016
Market Perspectives - December 2016
 
JG HELLER Global Q2 2015 Review LinkedIn
JG HELLER Global Q2 2015 Review LinkedInJG HELLER Global Q2 2015 Review LinkedIn
JG HELLER Global Q2 2015 Review LinkedIn
 
Qmr q215 2015_landscape
Qmr q215 2015_landscapeQmr q215 2015_landscape
Qmr q215 2015_landscape
 
The Linkous Group, LTD Market Review - Q2 2015
The Linkous Group, LTD Market Review - Q2 2015The Linkous Group, LTD Market Review - Q2 2015
The Linkous Group, LTD Market Review - Q2 2015
 
Why To Diversify
Why To DiversifyWhy To Diversify
Why To Diversify
 
Callan 2017-2026 Capital Market Projections
Callan 2017-2026 Capital Market ProjectionsCallan 2017-2026 Capital Market Projections
Callan 2017-2026 Capital Market Projections
 
Asset Allocation And Your Portfolio
Asset Allocation And Your PortfolioAsset Allocation And Your Portfolio
Asset Allocation And Your Portfolio
 
Q2 2020 Market Review
Q2 2020 Market ReviewQ2 2020 Market Review
Q2 2020 Market Review
 
Elevation Wealth Management - 2nd Quarter In Review
Elevation Wealth Management - 2nd Quarter In ReviewElevation Wealth Management - 2nd Quarter In Review
Elevation Wealth Management - 2nd Quarter In Review
 
Q3 2020 Quarterly Market Review
Q3 2020 Quarterly Market ReviewQ3 2020 Quarterly Market Review
Q3 2020 Quarterly Market Review
 
Financial Synergies | Q4 2019 Market Review
Financial Synergies | Q4 2019 Market ReviewFinancial Synergies | Q4 2019 Market Review
Financial Synergies | Q4 2019 Market Review
 
Weekly market review - May 31, 2013
Weekly market review - May 31, 2013Weekly market review - May 31, 2013
Weekly market review - May 31, 2013
 
Monthly Systematic Product Review - Jan 2015
Monthly Systematic Product Review - Jan 2015Monthly Systematic Product Review - Jan 2015
Monthly Systematic Product Review - Jan 2015
 
ASI Wealth Management & Consulting Services - Q1 Quarterly Market Review
ASI Wealth Management & Consulting Services - Q1 Quarterly Market ReviewASI Wealth Management & Consulting Services - Q1 Quarterly Market Review
ASI Wealth Management & Consulting Services - Q1 Quarterly Market Review
 
McLean Asset Management - Quarterly Market Review for 2015 Q1
McLean Asset Management - Quarterly Market Review for 2015 Q1McLean Asset Management - Quarterly Market Review for 2015 Q1
McLean Asset Management - Quarterly Market Review for 2015 Q1
 

Recently uploaded

NO1 Uk Divorce problem uk all amil baba in karachi,lahore,pakistan talaq ka m...
NO1 Uk Divorce problem uk all amil baba in karachi,lahore,pakistan talaq ka m...NO1 Uk Divorce problem uk all amil baba in karachi,lahore,pakistan talaq ka m...
NO1 Uk Divorce problem uk all amil baba in karachi,lahore,pakistan talaq ka m...
Amil Baba Dawood bangali
 
how can I sell my pi coins for cash in a pi APP
how can I sell my pi coins for cash in a pi APPhow can I sell my pi coins for cash in a pi APP
how can I sell my pi coins for cash in a pi APP
DOT TECH
 
how to sell pi coins on Bitmart crypto exchange
how to sell pi coins on Bitmart crypto exchangehow to sell pi coins on Bitmart crypto exchange
how to sell pi coins on Bitmart crypto exchange
DOT TECH
 
how to sell pi coins in South Korea profitably.
how to sell pi coins in South Korea profitably.how to sell pi coins in South Korea profitably.
how to sell pi coins in South Korea profitably.
DOT TECH
 
how to sell pi coins in all Africa Countries.
how to sell pi coins in all Africa Countries.how to sell pi coins in all Africa Countries.
how to sell pi coins in all Africa Countries.
DOT TECH
 
The European Unemployment Puzzle: implications from population aging
The European Unemployment Puzzle: implications from population agingThe European Unemployment Puzzle: implications from population aging
The European Unemployment Puzzle: implications from population aging
GRAPE
 
一比一原版UOL毕业证利物浦大学毕业证成绩单如何办理
一比一原版UOL毕业证利物浦大学毕业证成绩单如何办理一比一原版UOL毕业证利物浦大学毕业证成绩单如何办理
一比一原版UOL毕业证利物浦大学毕业证成绩单如何办理
ydubwyt
 
655264371-checkpoint-science-past-papers-april-2023.pdf
655264371-checkpoint-science-past-papers-april-2023.pdf655264371-checkpoint-science-past-papers-april-2023.pdf
655264371-checkpoint-science-past-papers-april-2023.pdf
morearsh02
 
how to swap pi coins to foreign currency withdrawable.
how to swap pi coins to foreign currency withdrawable.how to swap pi coins to foreign currency withdrawable.
how to swap pi coins to foreign currency withdrawable.
DOT TECH
 
The new type of smart, sustainable entrepreneurship and the next day | Europe...
The new type of smart, sustainable entrepreneurship and the next day | Europe...The new type of smart, sustainable entrepreneurship and the next day | Europe...
The new type of smart, sustainable entrepreneurship and the next day | Europe...
Antonis Zairis
 
Commercial Bank Economic Capsule - May 2024
Commercial Bank Economic Capsule - May 2024Commercial Bank Economic Capsule - May 2024
Commercial Bank Economic Capsule - May 2024
Commercial Bank of Ceylon PLC
 
Economics and Economic reasoning Chap. 1
Economics and Economic reasoning Chap. 1Economics and Economic reasoning Chap. 1
Economics and Economic reasoning Chap. 1
Fitri Safira
 
Empowering the Unbanked: The Vital Role of NBFCs in Promoting Financial Inclu...
Empowering the Unbanked: The Vital Role of NBFCs in Promoting Financial Inclu...Empowering the Unbanked: The Vital Role of NBFCs in Promoting Financial Inclu...
Empowering the Unbanked: The Vital Role of NBFCs in Promoting Financial Inclu...
Vighnesh Shashtri
 
what is a pi whale and how to access one.
what is a pi whale and how to access one.what is a pi whale and how to access one.
what is a pi whale and how to access one.
DOT TECH
 
What price will pi network be listed on exchanges
What price will pi network be listed on exchangesWhat price will pi network be listed on exchanges
What price will pi network be listed on exchanges
DOT TECH
 
what is the future of Pi Network currency.
what is the future of Pi Network currency.what is the future of Pi Network currency.
what is the future of Pi Network currency.
DOT TECH
 
Poonawalla Fincorp and IndusInd Bank Introduce New Co-Branded Credit Card
Poonawalla Fincorp and IndusInd Bank Introduce New Co-Branded Credit CardPoonawalla Fincorp and IndusInd Bank Introduce New Co-Branded Credit Card
Poonawalla Fincorp and IndusInd Bank Introduce New Co-Branded Credit Card
nickysharmasucks
 
What website can I sell pi coins securely.
What website can I sell pi coins securely.What website can I sell pi coins securely.
What website can I sell pi coins securely.
DOT TECH
 
Which Crypto to Buy Today for Short-Term in May-June 2024.pdf
Which Crypto to Buy Today for Short-Term in May-June 2024.pdfWhich Crypto to Buy Today for Short-Term in May-June 2024.pdf
Which Crypto to Buy Today for Short-Term in May-June 2024.pdf
Kezex (KZX)
 
what is the best method to sell pi coins in 2024
what is the best method to sell pi coins in 2024what is the best method to sell pi coins in 2024
what is the best method to sell pi coins in 2024
DOT TECH
 

Recently uploaded (20)

NO1 Uk Divorce problem uk all amil baba in karachi,lahore,pakistan talaq ka m...
NO1 Uk Divorce problem uk all amil baba in karachi,lahore,pakistan talaq ka m...NO1 Uk Divorce problem uk all amil baba in karachi,lahore,pakistan talaq ka m...
NO1 Uk Divorce problem uk all amil baba in karachi,lahore,pakistan talaq ka m...
 
how can I sell my pi coins for cash in a pi APP
how can I sell my pi coins for cash in a pi APPhow can I sell my pi coins for cash in a pi APP
how can I sell my pi coins for cash in a pi APP
 
how to sell pi coins on Bitmart crypto exchange
how to sell pi coins on Bitmart crypto exchangehow to sell pi coins on Bitmart crypto exchange
how to sell pi coins on Bitmart crypto exchange
 
how to sell pi coins in South Korea profitably.
how to sell pi coins in South Korea profitably.how to sell pi coins in South Korea profitably.
how to sell pi coins in South Korea profitably.
 
how to sell pi coins in all Africa Countries.
how to sell pi coins in all Africa Countries.how to sell pi coins in all Africa Countries.
how to sell pi coins in all Africa Countries.
 
The European Unemployment Puzzle: implications from population aging
The European Unemployment Puzzle: implications from population agingThe European Unemployment Puzzle: implications from population aging
The European Unemployment Puzzle: implications from population aging
 
一比一原版UOL毕业证利物浦大学毕业证成绩单如何办理
一比一原版UOL毕业证利物浦大学毕业证成绩单如何办理一比一原版UOL毕业证利物浦大学毕业证成绩单如何办理
一比一原版UOL毕业证利物浦大学毕业证成绩单如何办理
 
655264371-checkpoint-science-past-papers-april-2023.pdf
655264371-checkpoint-science-past-papers-april-2023.pdf655264371-checkpoint-science-past-papers-april-2023.pdf
655264371-checkpoint-science-past-papers-april-2023.pdf
 
how to swap pi coins to foreign currency withdrawable.
how to swap pi coins to foreign currency withdrawable.how to swap pi coins to foreign currency withdrawable.
how to swap pi coins to foreign currency withdrawable.
 
The new type of smart, sustainable entrepreneurship and the next day | Europe...
The new type of smart, sustainable entrepreneurship and the next day | Europe...The new type of smart, sustainable entrepreneurship and the next day | Europe...
The new type of smart, sustainable entrepreneurship and the next day | Europe...
 
Commercial Bank Economic Capsule - May 2024
Commercial Bank Economic Capsule - May 2024Commercial Bank Economic Capsule - May 2024
Commercial Bank Economic Capsule - May 2024
 
Economics and Economic reasoning Chap. 1
Economics and Economic reasoning Chap. 1Economics and Economic reasoning Chap. 1
Economics and Economic reasoning Chap. 1
 
Empowering the Unbanked: The Vital Role of NBFCs in Promoting Financial Inclu...
Empowering the Unbanked: The Vital Role of NBFCs in Promoting Financial Inclu...Empowering the Unbanked: The Vital Role of NBFCs in Promoting Financial Inclu...
Empowering the Unbanked: The Vital Role of NBFCs in Promoting Financial Inclu...
 
what is a pi whale and how to access one.
what is a pi whale and how to access one.what is a pi whale and how to access one.
what is a pi whale and how to access one.
 
What price will pi network be listed on exchanges
What price will pi network be listed on exchangesWhat price will pi network be listed on exchanges
What price will pi network be listed on exchanges
 
what is the future of Pi Network currency.
what is the future of Pi Network currency.what is the future of Pi Network currency.
what is the future of Pi Network currency.
 
Poonawalla Fincorp and IndusInd Bank Introduce New Co-Branded Credit Card
Poonawalla Fincorp and IndusInd Bank Introduce New Co-Branded Credit CardPoonawalla Fincorp and IndusInd Bank Introduce New Co-Branded Credit Card
Poonawalla Fincorp and IndusInd Bank Introduce New Co-Branded Credit Card
 
What website can I sell pi coins securely.
What website can I sell pi coins securely.What website can I sell pi coins securely.
What website can I sell pi coins securely.
 
Which Crypto to Buy Today for Short-Term in May-June 2024.pdf
Which Crypto to Buy Today for Short-Term in May-June 2024.pdfWhich Crypto to Buy Today for Short-Term in May-June 2024.pdf
Which Crypto to Buy Today for Short-Term in May-June 2024.pdf
 
what is the best method to sell pi coins in 2024
what is the best method to sell pi coins in 2024what is the best method to sell pi coins in 2024
what is the best method to sell pi coins in 2024
 

Q3 2016 Review and Outlook

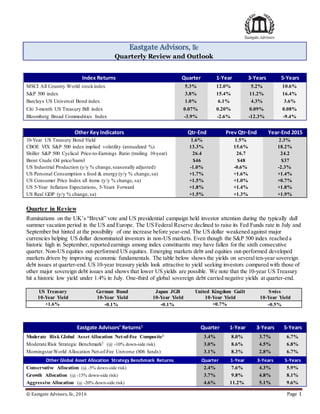
  • 1. © Eastgate Advisors, llc, 2016 Page 1 Eastgate Advisors, llc Quarterly Review and Outlook Other Key Indicators Qtr-End Prev Qtr-End Year-End 2015 10-Year US Treasury Bond Yield 1.6% 1.5% 2.3% CBOE VIX S&P 500 index implied volatility (annualized %) 13.3% 15.6% 18.2% Shiller S&P 500 Cyclical Price-to-Earnings Ratio (trailing 10-year) 26.4 26.7 24.2 Brent Crude Oil price/barrel $46 $48 $37 US Industrial Production (y/y % change, seasonally adjusted) -1.0% -0.6% -2.3% US Personal Consumption x food & energy (y/y % change,sa) +1.7% +1.6% +1.4% US Consumer Price Index all items (y/y % change, sa) +1.5% +1.0% +0.7% US 5-Year Inflation Expectations, 5-Years Forward +1.8% +1.4% +1.8% US Real GDP (y/y % change, sa) +1.5% +1.3% +1.9% Quarter in Review Ruminations on the UK’s “Brexit” vote and US presidential campaign held investor attention during the typically dull summer vacation period in the US and Europe. The US Federal Reserve declined to raise its Fed Funds rate in July and September but hinted at the possibility of one increase before year-end. The US dollar weakened against major currencies helping US dollar denominated investors in non-US markets. Even though the S&P 500 index reached a historic high in September, reported earnings among index constituents may have fallen for the sixth consecutive quarter. Non-US equities out-performed US equities. Emerging markets debt and equities out-performed developed markets driven by improving economic fundamentals. The table below shows the yields on severalten-year sovereign debt issues at quarter-end. US 10-year treasury yields look attractive to yield seeking investors compared with those of other major sovereign debt issues and shows that lower US yields are possible. We note that the 10-year US Treasury hit a historic low yield under 1.4% in July. One-third of global sovereign debt carried negative yields at quarter-end. US Treasury 10-Year Yield German Bund 10-Year Yield Japan JGB 10-Year Yield United Kingdom Guilt 10-Year Yield Swiss 10-Year Yield +1.6% -0.1% -0.1% +0.7% -0.5% Index Returns Quarter 1-Year 3-Years 5-Years MSCI All Country World stockindex 5.3% 12.0% 5.2% 10.6% S&P 500 index 3.8% 15.4% 11.2% 16.4% Barclays US Universal Bond index 1.0% 6.1% 4.3% 3.6% Citi 3-month US Treasury Bill index 0.07% 0.20% 0.09% 0.08% Bloomberg Broad Commodities Index -3.9% -2.6% -12.3% -9.4% Eastgate Advisors’ Returns1 Quarter 1-Year 3-Years 5-Years Moderate Risk Global Asset Allocation Net-of-Fee Composite1 3.4% 8.0% 3.7% 6.7% Moderate Risk Strategic Benchmark2 (@ -10% down-side risk) 3.0% 8.6% 4.5% 6.8% MorningstarWorld Allocation Net-of-Fee Universe (806 funds) 3.1% 8.3% 2.8% 6.7% Other Global Asset Allocation Strategy Benchmark Returns Quarter 1-Year 3-Years 5-Years Conservative Allocation (@ -5% down-side risk) 2.4% 7.6% 4.3% 5.9% Growth Allocation (@ -15% down-side risk) 3.7% 9.8% 4.8% 8.1% Aggressive Allocation (@ -20% down-side risk) 4.6% 11.2% 5.1% 9.6%
  • 2. © Eastgate Advisors, llc, 2016 Page 2 *Based on quarter-end manager holdings. Gross exposures may not sum to 100%. Return Analysis Our return objective is to out-perform the strategic benchmark after fees, over a three-to-five-year investment horizon. We seek to add value through asset allocation decisions, external manager selection, manager allocation decisions, by managing investment risk, maintaining adequate liquidity and controlling investment costs. Active Decision Quarterly Value Added Versus The Strategic Benchmark Asset Allocation +0.41% Manager Selection +0.01% Manager Allocation -0.01% Total Quarterly Net-of-Fee Value Added: +0.41% What affected returns during the quarter? Underlying holdings analysis at quarter-end showed that we had higher small and mid-cap global equity exposures, more non-US fixed income and more non-dollar bonds than the strategic benchmark. Other key factors that affected returns:  An over-weight to global equities helped but an under-weight to emerging markets hurt performance.  An over-weight to emerging market bonds and non-investment grade debt helped.  An under-weight to money markets helped as global equities and bonds performed well.  The alpha portfolio (active managers) under-performed the passive global markets portfolio. Risk Management In managing investment risks, we seek to eliminate idiosyncratic risks, to manage market and active risks and control leverage in order to keep annual down-side risk at no more than -10% in nine-of-ten years while maintaining adequate liquidity and earning a return which we believe fairly compensates investors for risk. We have explicit allocation limits in place for each active manager. We also have a 3% maximum annual active risk budget. This means that we should expect to earn the return of the strategic benchmark plus or minus 3% in seven-of-ten years. That is why the strategic benchmark is a key part of our investment process. Key Risk Metrics Metric Value Q/Q Change Estimated 12-month down-side risk potential (@ 90% confidence): -9% (+) Risk relative to the strategic benchmark (leverage): 1.0 x (-) % of return explained by the strategic benchmark allocation (R2): 97% (-) Estimated annual active risk (tracking error): 1.1% (+) Active allocations % of total fund (active managers + tactical allocations): 31% (+) Weighted average annual expense ratio: 0.33% (+) Number of global stocks (idiosyncraticrisk indicator): 5,377 (-) Number of global bonds: 6,760 (+) Estimated interest rate sensitivity relative to the strategic benchmark index: 100% (-) Asset Class Allocations* US Equities Non-US Equities Global Bonds Commodities Money Markets Eastgate Moderate Risk Weight 30.1% 23.1% 38.7% 1.0% 7.7% Strategic Benchmark Weight 26.1% 23.9% 40.0% 0.0% 10.0% Eastgate Advisors Over/Under Weight +4.0% -0.8% -1.3% 1.0% -2.3%
  • 3. © Eastgate Advisors, llc, 2016 Page 3 Looking Ahead We are not focused on a quarter-to-quarter or a year-to-year investment horizon. Strategically, we maintain exposure to global markets with historic risk premia in excess of the return of a risk-free asset,like a treasury bill. We seek to control costs, manage risks and maintain adequate liquidity. Over a one-to-three year investment horizon, we determine tactical allocations to global equities, global bonds, commodities, and money markets based on valuations and our expectations for inflation and economic growth. In attempting to add additional value, we may use active external investment managers with whom we have had years of favorable experiences. Our three-to-five year strategic outlook is for slow global economic growth and modest inflation. The global economy remains mired in an excess debt induced, low growth environment. Sovereign bond yields in severaleconomies reflect deflationary pressures. Market expectations for US inflation over the next five years are under 2% with modest inflation in most developed global economies. The US Treasury yield curve has flattened since December 31, 2015 driven by high demand for yield from pension funds, insurance companies and global investors whose local sovereign bonds carry negative yields. This dynamic may continue as long as US treasuries hold a yield advantage over other sovereign issues and it puts upward pressure on the US dollar in what is likely a rising short-rate environment in the US. Our one-to-three year tactical outlook suggests a near benchmark weight to global public equities relative to the strategic benchmark and a higher volatility investing regime. Based on our bottom-up fundamental input models, we expect public global equity market returns in the mid-single digits over our three-to-five year strategic investment horizon. The yield-to-maturity of the Barclays US Universal index (our preferred bond index) implies expected annual returns to US bonds under 2.4% over our strategic investment horizon. Rising rates would reduce realized bond market returns further. Market estimates of the Fed Funds rate imply money market returns near one percent over our one-to-three year tactical investment horizon. Barring an unexpected rise in global inflation or consumption driven growth, commodities as an asset class remain unattractive given weak global demand and an over-supply for many of them although we added an allocation to gold via an exchange traded fund (ETF) as a volatility hedge during the quarter. Risks to allocations over our investment horizon include excessive debt in major global economies which increase deflationary pressures that harm growth prospects. Risks also include unanticipated inflation; a significant geopolitical shock, an emerging markets crisis or a contagion effect of the British exit from the EU. The impact of the UK’s exit from the European Union on both the UK and EU is a big unknown and is likely to only be realized over severalyears. Reduced trading liquidity in corporate bonds, to which we are over-weight relative to the strategic allocation benchmark, continues to be a concern. High equity valuations increase the risks of investing in the asset class if corporate earnings continue to decline. Price-to-earnings ratio (multiple) expansion and not earnings growth has sustained US equity market returns over the past couple of years. We don’t expect this to continue. Thank you for taking time to read our thoughts. Contact Greg Johnsen, CFA with questions or comments at: gjohnsen@eastgateadv.com. Connect with Greg on Linked In. His Linked In profile: gregjohnsencfa. Important Disclosures 1The Eastgate Advisors’ Moderate Risk global allocation composite return is the realized net-of-fees, assetweighted,geometric average total return of several public markets accounts of a private familyinvestmentoffice. Returns in excess of one-year are annualized.Returns are through 9-30-2016. 2 The Moderate Risk Allocation strategic benchmark is an unmanaged combination ofbroad marketindices.It consists of50% of the return of the MSCI All Country World ™ stock index (net), 40% of the Barclays US Universal Bond ™ index and 10% US treasury bills. Holdings analytics:Morningstar Advisor Workstation. Performance analysis and attribution:Eastgate Advisors,llc. Economic data sources:US Federal Reserve,US Departmentofthe Treasury, US Bureau of Economic Analysis,RobertShiller,the Economist,World Bank,International Monetary Fund, Factset Research Systems. Visit our website: www.eastgateadvisors.com or Linked In companypage: https://www.linkedin.com/company/eastgate-advisors?