Download to read offline

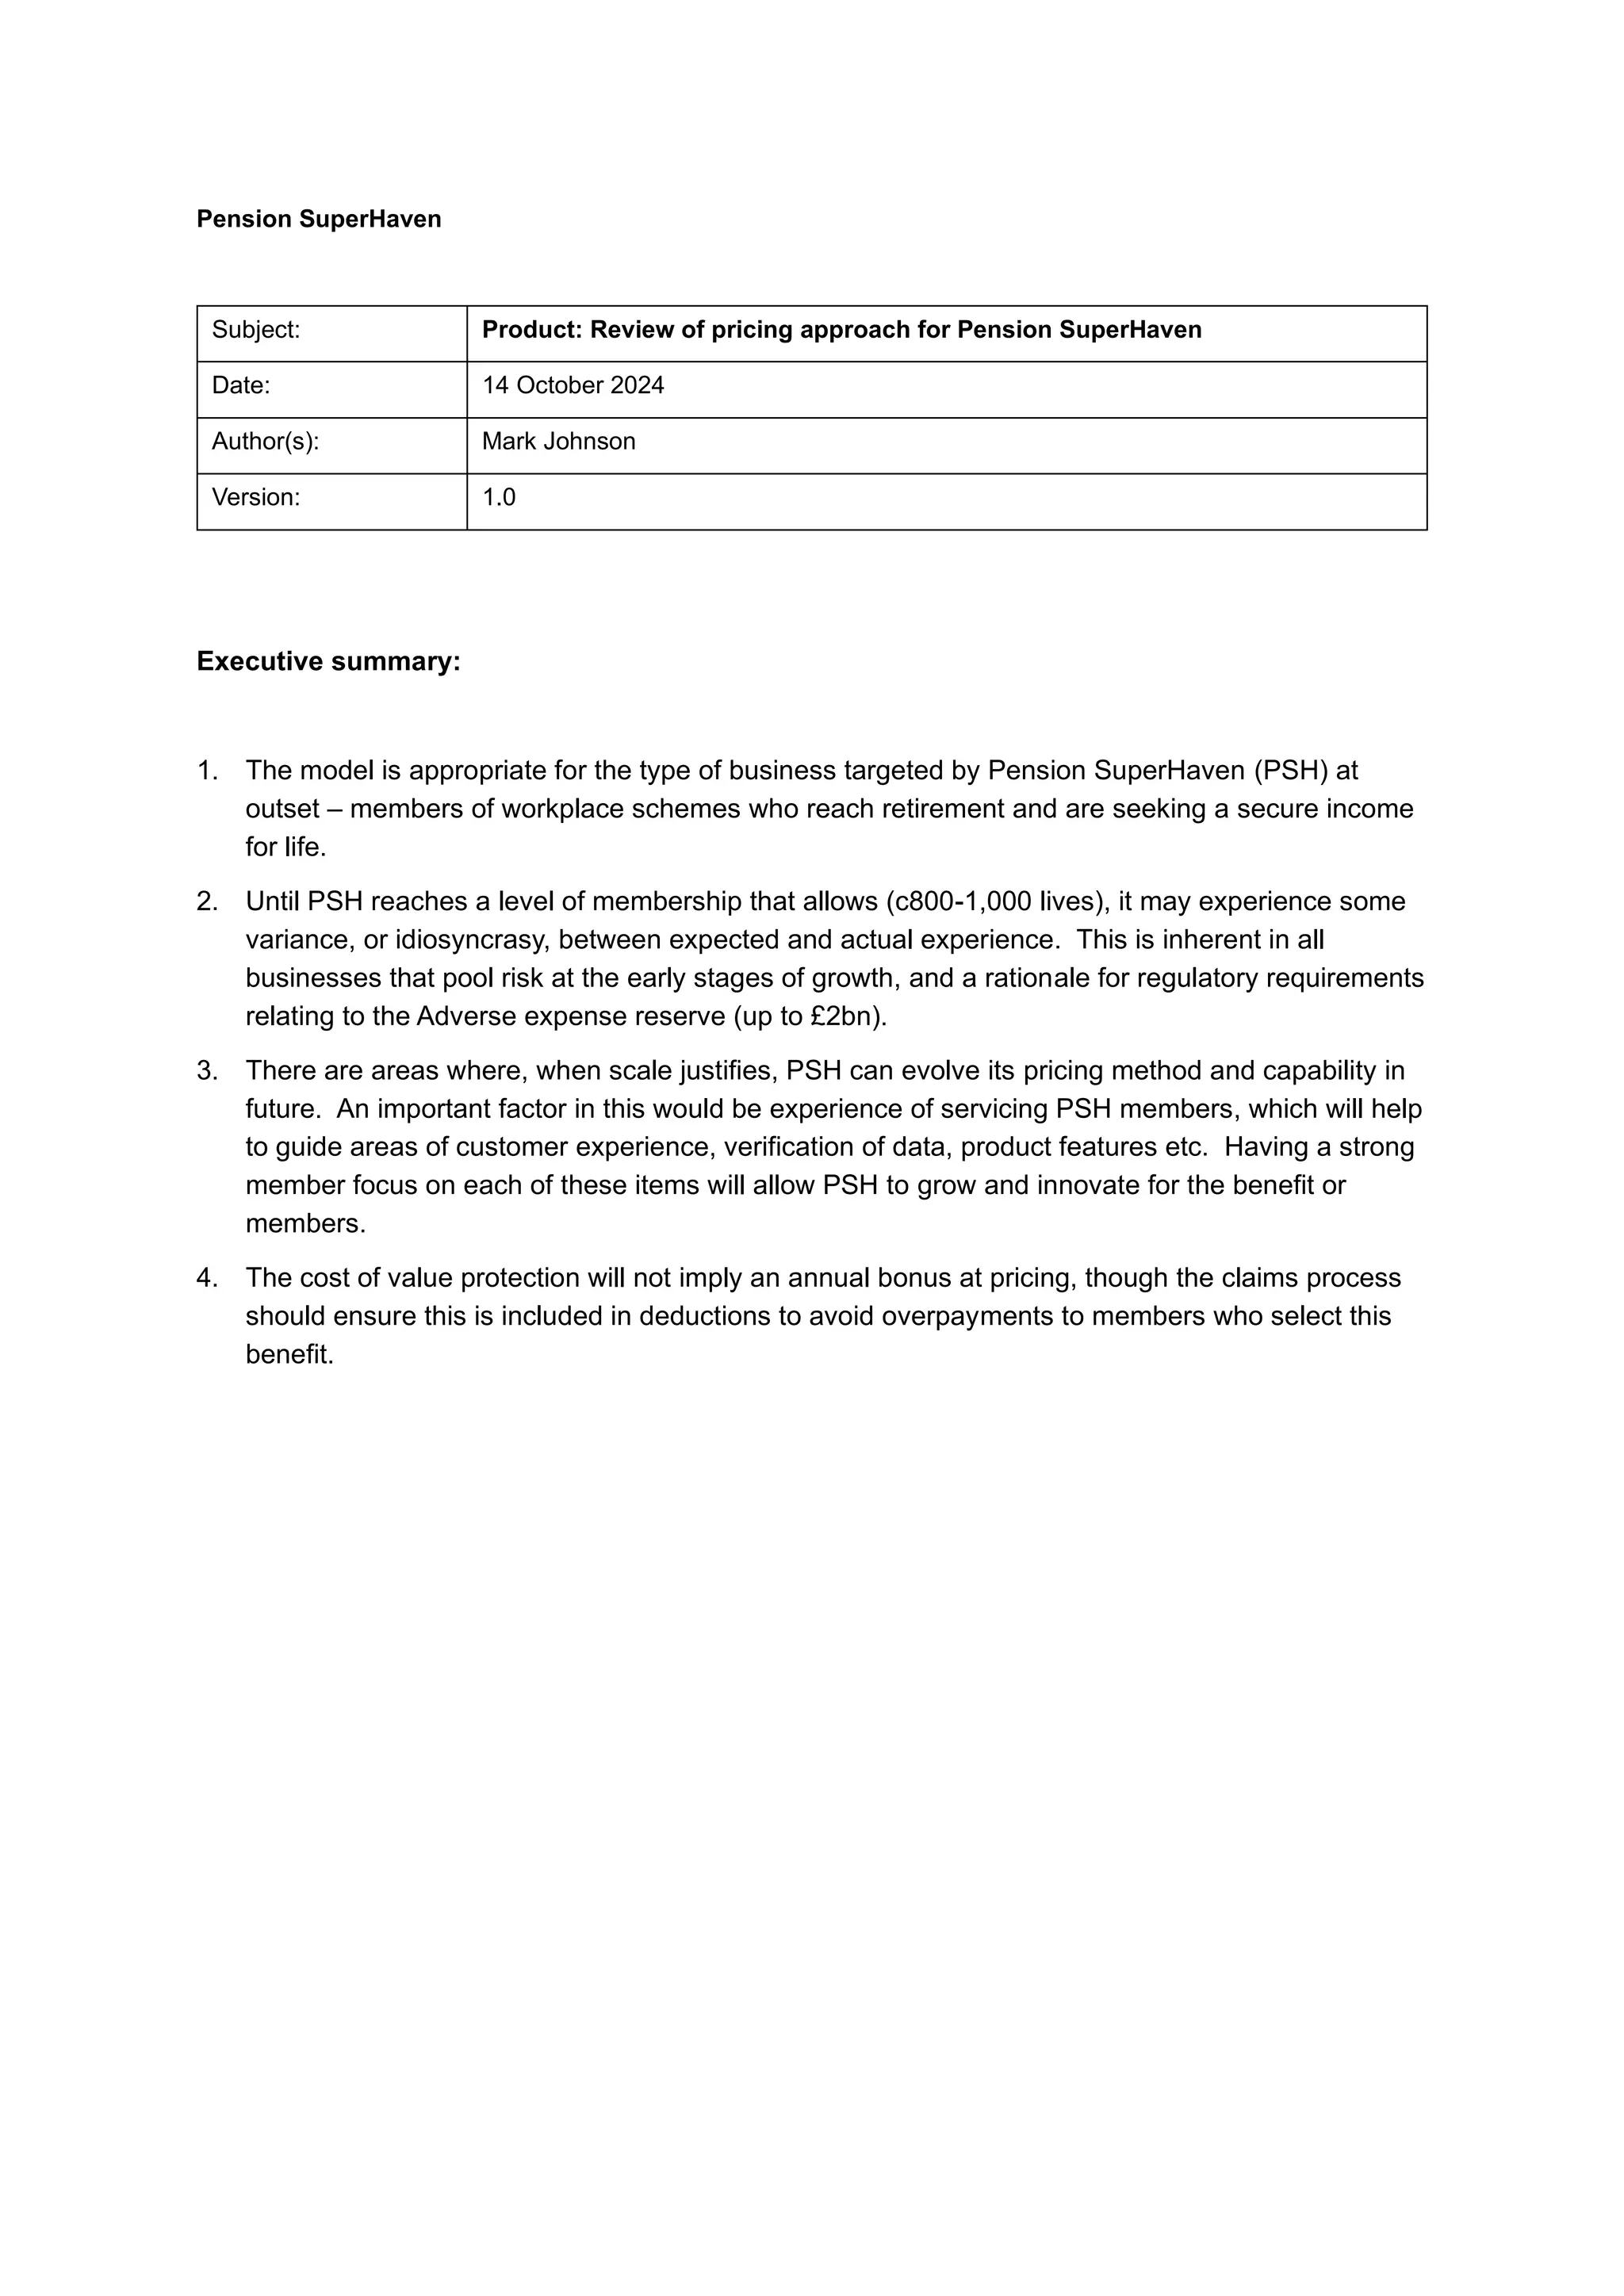

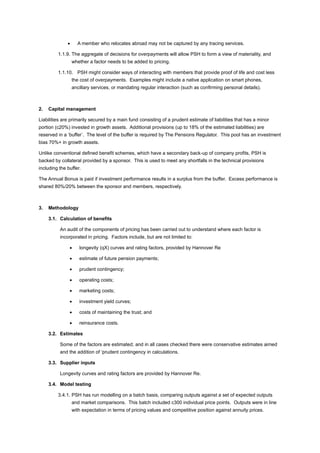
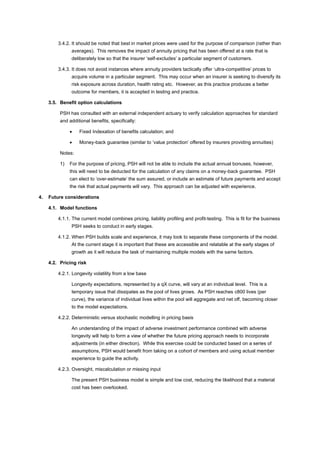


The document reviews the pricing approach for Pension Superhaven (PSH), outlining that the model effectively targets workplace scheme members seeking secure income at retirement. It discusses potential variances in expected versus actual experiences during early growth stages and suggests improvements in verification processes and data management as membership grows. Future considerations include refining pricing methods and evolving product features based on member experiences to enhance service delivery.