1. OPERATIONS MANAGEMENT
INTM 410
PROJECT: FORECASTING FOR PIZZA SALES
Krutarth Desai A20387996 OM TOOL: Forecasting Date of submission: 11/30/2016
Forecasting is very important for business organization and for every significant management
decision. Forecasting helps managers to plan their inventory, employee scheduling, budgetary
planning, and cost control. Having tentative idea of sales for upcoming weeks, manager can easily
order raw materials to meet required demand and having adequate amount of inventory saves
money and space available for back door operations. Sales of pizza depends on many factors but
for short term forecasting, time series analysis gives satisfactory results. In this project, I have
done tactical forecasting by two time series analysis method 1- Weighted moving average and 2-
Exponential smoothing for three different sizes of pizza sales for upcoming week and implemented
linear regression analysis to forecast total number of sales with the help of Microsoft excel.
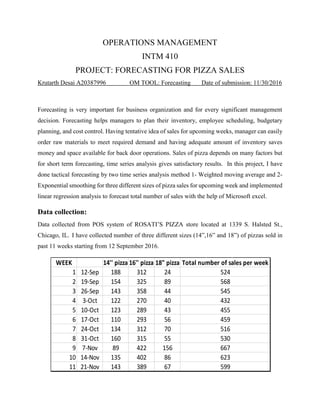
Data collection:
Data collected from POS system of ROSATI’S PIZZA store located at 1339 S. Halsted St.,
Chicago, IL. I have collected number of three different sizes (14”,16” and 18”) of pizzas sold in
past 11 weeks starting from 12 September 2016.
WEEK 14'' pizza 16'' pizza 18" pizza
1 12-Sep 188 312 24
2 19-Sep 154 325 89
3 26-Sep 143 358 44
4 3-Oct 122 270 40
5 10-Oct 123 289 43
6 17-Oct 110 293 56
7 24-Oct 134 312 70
8 31-Oct 160 315 55
9 7-Nov 89 422 156
10 14-Nov 135 402 86
11 21-Nov 143 389 67
667
623
599
Total number of sales per week
524
568
545
432
455
459
516
530
2. Calculation:
Part 1: Forecasting with weighted moving average:
For short term forecasting, most recent past is the most important one, for that reason I have
assigned weight of 50% to actual sale of most recent week, 30% to two weeks ago, and 20% to
three weeks ago.
Part 2: Forecasting using Exponential smoothing method:
This method is widely used for ordering inventory in retail firms, wholesale companies and service
agency and it is an integral part of virtually all computerized forecasting programs. I have done
trial and error method to finalize value of Exponential smoothing constant (0.10). This value
determines the level of smoothing and reaction to deference between forecast and actual sales.
Equation:
Forecast for period = Forecast made for previous week + α (Actual sales of previous week –
Forecast made for previous week)
This equation incorporates error accrue during previous forecasting. When exponential
forecasting is used for first week, we have initially assumed that forecast is same as actual sales.
With 50%,30%,20% weight
WEEK 14'' pizza 16'' pizza 18" pizza 14'' pizza 16'' pizza 18" pizza Total
1 12-Sep 188 312 24
2 19-Sep 154 325 89
3 26-Sep 143 358 44
4 3-Oct 122 270 40 155.3 338.9 53.5 547.7
5 10-Oct 123 289 43 134.7 307.4 51 493.1
6 17-Oct 110 293 56 126.7 297.1 42.3 466.1
7 24-Oct 134 312 70 116.3 287.2 48.9 452.4
8 31-Oct 160 315 55 124.6 301.7 60.4 486.7
9 7-Nov 89 422 156 142.2 309.7 59.7 511.6
10 14-Nov 135 402 86 119.3 367.9 108.5 595.7
11 21-Nov 143 389 67 126.2 390.6 100.8 617.6
12 28-Nov 129.8 399.5 90.5 619.8
667
623
599
Weithed Moving Average
Total number of sales per week
524
568
545
432
455
459
516
530
3. Part 3: Forecasting of total number of sales using Linear regression method:
With 50%,30%,20% weight
WEEK 14'' pizza 16'' pizza 18" pizza Total 14'' pizza 16'' pizza 18" pizza Total 14'' pizza 16'' pizza 18" pizza Total
1 12-Sep 188 312 24 524 188 312 24
2 19-Sep 154 325 89 568 188 312 24 524
3 26-Sep 143 358 44 545 184.6 313.3 30.5 528.4
4 3-Oct 122 270 40 432 155.3 338.9 53.5 547.7 180.44 317.77 31.85 530.06
5 10-Oct 123 289 43 455 134.7 307.4 51 493.1 174.596 312.993 32.665 520.254
6 17-Oct 110 293 56 459 126.7 297.1 42.3 466.1 169.436 310.594 33.6985 513.729
7 24-Oct 134 312 70 516 116.3 287.2 48.9 452.4 163.493 308.834 35.9287 508.256
8 31-Oct 160 315 55 530 124.6 301.7 60.4 486.7 160.543 309.151 39.3358 509.03
9 7-Nov 89 422 156 667 142.2 309.7 59.7 511.6 160.489 309.736 40.9022 511.127
10 14-Nov 135 402 86 623 119.3 367.9 108.5 595.7 153.34 320.962 52.412 526.714
11 21-Nov 143 389 67 599 126.2 390.6 100.8 617.6 151.506 329.066 55.7708 536.343
12 28-Nov 129.8 399.5 90.5 619.8 150.656 335.059 56.8937 542.609
With α=0.10
Exponetial smothingWeithed Moving Average
Linear regression forcasting only for total number of pizza
SUMMARY OUTPUT
Regression Statistics
Multiple R 0.54346
R Square 0.29534
Adjusted R Square0.20726
Standard Error 68.6021
Observations 10
ANOVA
df SS MS F Significance F
Regression 1 15780.4 15780.4 3.35307 0.10445
Residual 8 37650 4706.25
Total 9 53430.4
CoefficientsStandard Errort Stat P-value Lower 95%Upper 95%Lower 95.0%Upper 95.0%
Intercept 449.503 53.6731 8.37484 3.1E-05 325.733 573.273 325.733 573.273
1 13.8303 7.55285 1.83114 0.10445 -3.5866 31.2472 -3.58659 31.2472
4. This method is very useful for forecasting demands for product families. Even though demand
for individual product within family may vary significantly. In our case, different size of pizza
may have different sales volume but their cumulative sales can be estimated using this method.
Equation for Linear forecasting:
Forecasting for next week = Y intercept + Slope of the line * time period.
Above required value for Y intercept and slope of line can be obtained from Data analysis
Toolpack in Excel.
Forecast for week 12 = 449.503 + 13.8303 * 12
=615.46 Total sales of pizza.
Conclusion:
For Fast casual dining, such as ROSATI’S should have estimate of sales in near future because
service industries cannot store their services and services must be delivered at the time of demand.
From above calculation, we can say that Weighted moving and Linear regression give almost
similar result and thus store manager can rely on these two results and can plan inventory and
employees scheduling as per forecast. Even though sales of pizza depend upon many factors such
as weather, nearby population, events occurring in nearby places and marketing done by store but
from the above calculation one can get idea of what they will do in near future.
We can see major sales in week 9 due to final match between cubs and Cleveland Indians.
0
100
200
300
400
500
600
700
1 2 3 4 5 6 7 8 9 10 11 12
Chart Title
Weighted Exponetial Linear