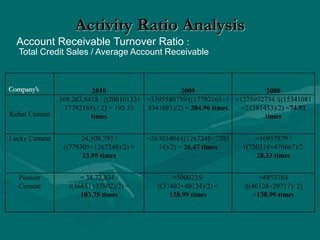
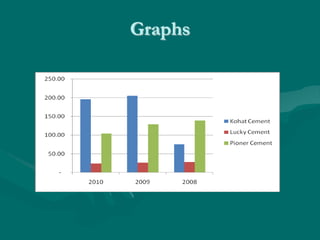
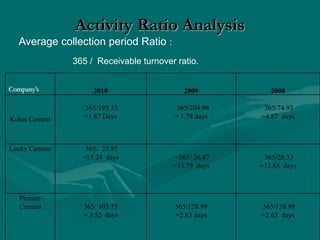
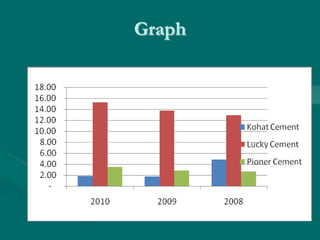
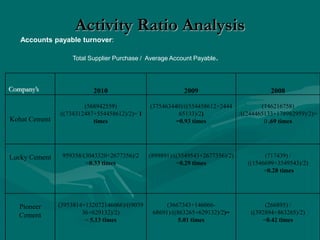
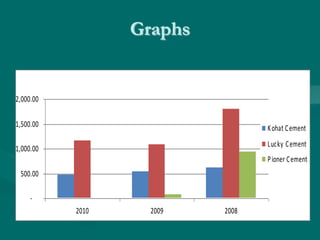
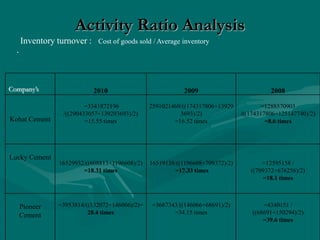
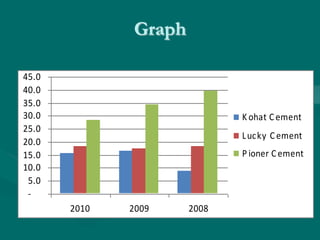
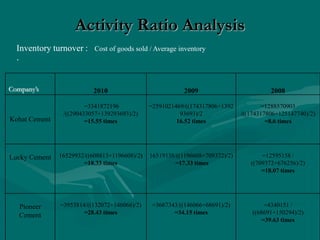
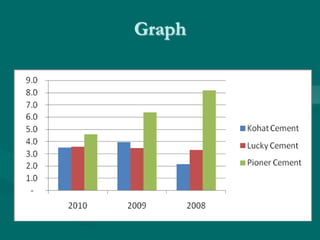
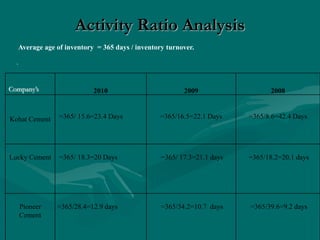
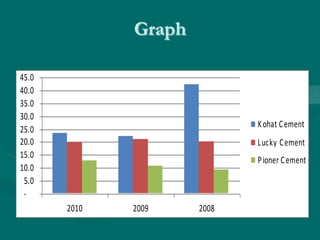
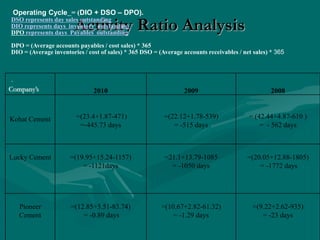
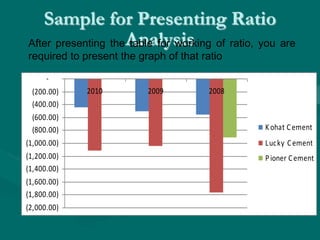
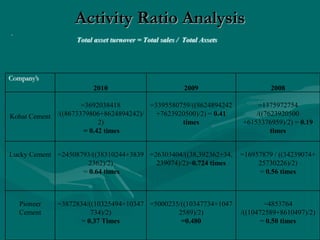
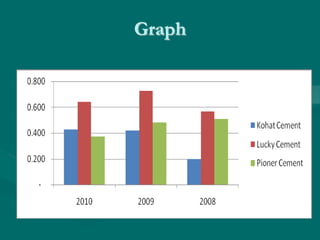
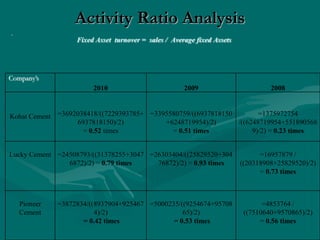
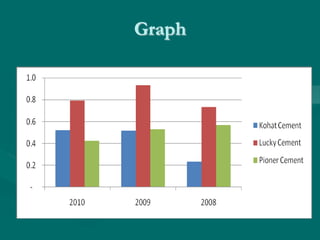
In the name of Allah
Who is the most beneficent
& the most merciful
Name: Nigah-e-Nazar
ID: Mc070400183
Degree: MSBA
Specialization: Finance
ACTIVITY RATIOS’ ANALYSIS OF KOHAT CEMENT, LUCKY
CEMENT AND PIONEER CEMENT IN FOR THE YEAR 2008-09-2010
Introduction of the Project
• Cement industry is indeed a highly important segment of industrial sector that
plays a pivotal role in the socio-economic development. Though the cement
industry in Pakistan has witnessed its lows and highs in recent past, it has
recovered during the last couple of years and is buoyant once again. Activity
ratio analysis to judge the financial performance of different companies
whether they belong to the same industry or to the different industries is
always different from each other. They vary from each other in many aspects
of the recording of the transactions.
• PROJECT AIM
My Project is concern to measure the Activities ratio of Kohat Cement,
Lucky Cement ,Pioneer cement for the year 2008-2009 and 2010
Objectives and Significance
• Objectives
• The reason(s) that why this company is able to manage its assets effectively.
• • The reason(s) that why this company is NOT able to manage its assets
effectively.
Significance.
• Get idea how to these companies manage their assets effectively
• Get clear picture what are various factors that companies not able to manage
their assets effectively
• Data will help for both companies to understand these factors
• To fulfill my MBA degree requirement
Data Collection
Secondary Data has been used and it was collected from the
three Companies Financial statement
Data Processing
Financial ratio analysis involves the calculation and comparison of ratios
which are derived from the information given in the company's financial
statements
Date was processed and analyzed on the excel sheet for Graphically and
tabulation presentation
Data Analysis
Data was analyzed and proceed on the excel sheet. Bar
graphs were also used for interpretation of three
companies ratio analysis
Data Analysis (Cont…)‫‏‬
• All data are collected thorough internet with the help of followin
links
• http://www.luckycement.com/Financialreport%20pdf/Annual-Report
2010.pdf
• http://www.lucky-cement.com/financialreports.htm
• www.kohatcement.com/mainfinancial.htm
• http://www.kohatcement.com/pdf/30thJUNE2010.pdf
• www.researchandmarkets.com/reports/.../kohat_cement_company_
08_
• http://www.kohatcement.com/pdf/30thSept2009.pdf
• http://www.pioneercement.com/accounts.html
KOHAT CEMENT LIMITED
Financial Statements For Four Years.
Particulars 2010 2009 2008 2007
Rs in Thousands Rs in Thousands Rs in Thousands Rs in Thousands
Sales 3,692,038,418 3,395,580,759 1,375,972,754 1,553,733,256
Cost of sles 3,341,872,196 2,591,021,469 1,288,570,903 1,210,466,340
Gross profit 350,166,222 804,559,290 87,401,851 343,266,916
Distribution and selling
expenses 56,245,683 111,490,601 24,878,363 18,701,815
Administrative expenses 35,943,591 30,094,507 40,894,043 46,338,529
92,189,274 141,585,108 65,772,406 65,040,344
Operating Profit 257,976,948 662,974,182 21,629,445 278,226,572
Other operating Expense 4,835,758 3,291,944 20,958,970 7,640,715
253,141,190 659,682,238 670,475 270,585,857
Other operating income 23,210,906 34,218,809 35,978,496 75624748
276,352,096 693,901,047 36,648,971 346,210,605
Financial charges 658,589,707 549,902,638 48,935,320 18370018
Loss on Derivative Financial
Instruments 122,813,948 267,286,401 -
658,589,707 672,716,586 316,221,721 18,370,018
Loss/ profit before taxation (382,237,611) 21,184,461 (279,572,750) 327,840,587
KOHAT CEMENT LIMITED
BALANCE SHEET FOR FOUR YEARS
Particulars 2010 2009 2008 2007
SHARE CAPITALAND
RESERVES
Authorised Capital
150,000,000(2009 150,000000)
ord.share of Rs 10 each 1,500,000,000 1,500,000,000 1,500,000,000 15,000,000
Issued, subscribed and paid up
share capital 1,287,572,410 1,287,572,410 1,170,520,370 1017843800
Reserves 51,278,714 34,078,866 235,805,586 396306773
Accumulated Profit 622,118,747 949,895,889 922,803,191 1145242557
1,960,969,871 2,271,547,165 2,329,129,147 2,559,393,130
NON-CURRENT
LIABILITIES
Long term financing secured 3,049,320,000 2,989,387,373 2,981,785,715 2,703,308,354
Liabilities against assets subject
to finance lease secured 2,040,128 3,686,712 -
Long term Security Deposite and
LUCKY CEMENT LIMITED
FINANCIAL STATEMENTS OF FOUR YEARS
Particulars 2010 2009 2008 2007
Rs in Thousands Rs in Thousands Rs in Thousands
Rs in
Thousands
Sales 24,508,793 26,330,404 16,957,879 12,521,861
Cost of sles 16,529,932 16,519,138 12,595,158 8,846,706
Gross profit 7,978,861 9,811,266 4,362,721 3,675,155
Distribution and selling expenses 3,433,047 2,427,837 1,155,054 497,729
Administrative expenses 303,244 165,936 131,300 111,311
3,736,291 2,593,773 1,286,354 609,040
Operating Profit 4,242,570 7,217,493 3,076,367 3,066,115
Financial charges 569,184 1,236,971 126,743 862,847
Other operating income (1,902) (23,255) (1,293) (629,289)
Other Charges 257,774 826,776 644,388 142,204
825,056 2,040,492 769,838 375,762
Profit/Loss before taxation 3,417,514 5,177,001 2,306,529 2,690,353
Taxation
Current 195,697 156,744 85,394 63,146
LUCKY CEMENT LIMITED
BALANCE SHEET FOR FOUR YEARS
Particulars 2010 2009 2008 2007
SHARE CAPITAL AND RESERVES
Issued, subscribed and paid up share
capital 3,233,750 3,233,750 3,233,750 2,633,750
Reserves 21,862,179 20,018,222 15,421,673 6,719,800
25,095,929 23,251,972 18,655,423 9,353,550
NON-CURRENT LIABILITIES
Long term financing 1,658,600 4,300,000 6,633,333 8,335,604
Long term deposit 31,957 28,589 30,252 25,863
Deferred tax liability 319,217 234,633 174,171 147,245
Deferred tax tax 1,562,850 1,478,490 1,058,998 1,515,535
3,572,624 6,041,712 7,896,754 10,024,247
CURRENT LIABILITIES
Trade and other payables 3,043,320 2,677,356 3,549,543 1,546,699
Accrued mark-up 155,500 233,381 288,977 326,181
Short term borrowings 6,267,112 6,187,941 3,606,710 2,864,397
Current portion of non-current liabilities 175,759 - 241,667 1,615,152
9,641,691 9,098,678 7,686,897 6,352,429
PIONER CEMENT LIMITED
FINANCIAL STATEMENTS OF FOUR YEARS
Particulars 2010 2009 2008 2007
Rs in
Thousands
Rs in
Thousands
Rs in
Thousands Rs in Thousands
Sales 3,872,834 5,000,235 4,853,764 3,185,418
Cost of sles 3,953,814 3,667,343 4,340,151 2,813,309
Gross profit (80,980) 1,332,892 513,613 372,109
Selling /Distribution expenses 158,842 359,975 466,047 108,405
Administrative expenses 78,835 97,654 89,978 86,876
General / Other expenses 168,289 277,539 149,029 7,108
Other operating income (20,285) (28,047) (30,630) (11,687)
Operating Profit/ loss (466,661) 625,771 (160,811) 181,407
Financial charges 392,658 451,465 413,203 365,848
loss / Profit before tax (859,319) 174,306 (574,014) (184,441)
PIONER CEMENT LIMITED
BALANCE SHEET FOR FOUR YEARS
Particulars 2010 2009 2008 2007
SHARE CAPITAL AND RESERVES
Authorised Share Capital 3,500,000 2,500,000 2,500,000 2,500,000
Issued, subscribed and paid up share capital 2,227,552 1,995,324 1,995,324 1,698,148
Reserves
(9,334) 405,217 310,136 398,076
Total equity 2,218,218 2,400,541 2,305,460 2,096,224
Surplus on Revalution on fixed Assets 2,120,629 2,180,889 2,239,856 574,203
NON-CURRENT LIABILITIES
Long term financing secured 41,191 76,851 72,603
Laibility Against asset subject to finance lease 120,797 215,480 237,795 486,577
Long term musharika finance 50,000
Long term Deposit 1,168 1,068 1,841 5,247
Long Term Creditors Un Secured 2,348 8,731 15,114 21,497
Deferred liability 487,764 923,120 906,186 1,010,587
Long term Loan loan 466,231 1,087,583 1,701,777 2,293,709
1,078,308 2,277,173 2,939,564 3,940,220
CURRENT LIABILITIES
Creditors against expansion Project 29,594 283,428
Activity Ratio Analysis
Account Receivable Turnover Ratio :
Total Credit Sales / Average Account Receivable
Company’s 2010 2009 2008
Kohat Cement
369,203,8418 / ((20010133+
17792165) / 2) = 195.33
times
=3395580759/((17792165+1
5341081)/2) = 204.96 times
=1375972754 /((15341081
+21381453)/2) =74.93
times
Lucky Cement 24,508,793 /
((779305+1267248)/2) =
23.95 times
=26303404/((1267248+7203
14)/2) = 26.47 times
=16957879 /
((720314+476667)/2
28.33 times
Pioneer
Cement
= 38,72,834 /
((36851+37802)/2) =
103.75 times
=5000235/
((37402+40124)/2) =
128.99 times
=4853764
/((40124+29717)/ 2)
=138.99 times
Graphs
Activity Ratio Analysis
Average collection period Ratio :
365 / Receivable turnover ratio.
Company’s 2010 2009 2008
Kohat Cement
365/195.33
=1.87 Days
365/204.96
= 1.78 days
365/74.93
=4.87 days
Lucky Cement 365/ 23.95
=15.24 days =365/ 26.47
=13.79 days
365/28.33
=12.88 days
Pioneer
Cement 365/ 103.75
= 3.52 days
365/128.99
=2.83 days
365/138.99
=2.63 days
Graph
Activity Ratio Analysis
Accounts payable turnover:
Total Supplier Purchase / Average Account Payable.
Company’s 2010 2009 2008
Kohat Cement
(568942559)
/((734312487+554458612)/2)= 1
times
(375463440)/((554458612+2444
65133)/2)
=0.93 times
(146216758)
/((244465133+178982959)/2)=
0 .69 times
Lucky Cement 959358/(3043320+2677356)/2
=0.33 times
(899891)/((3549543+2677356)/2)
=0.29 times
(717439) /
((1546699+3549543)/2)
=0.28 times
Pioneer
Cement
(3953814+132072146066)/((9039
36+629132)/2)
= 5.13 times
(3667343+146066-
68691)/((863265+629132)/2)=
5.01 times
(266895) /
((392894+863265)/2)
=0.42 times
Graphs
-
500.00
1,000.00
1,500.00
2,000.00
2010 2009 2008
Kohat Cement
Lucky Cement
Pioner Cement
Activity Ratio Analysis
Inventory turnover : Cost of goods sold / Average inventory
.
Company’s 2010 2009 2008
Kohat Cement
=3341872196
/((290433057+139293693)/2)
=15.55 times
2591021469/((174317806+13929
3693)/2)
=16.52 times
=1288570903
/((174317806+125147740)/2)
=8.6 times
Lucky Cement
16529932/((608813+1196608)/2)
=18.31 times
16519138/((1196608+709372)/2)
=17.33 times
=12595158 /
((709372+676256)/2)
=18.1 times
Pioneer
Cement
=3953814/((132072+146066)/2)=
28.4 times
=3667343/((146066+68691)/2)
=34.15 times
=4340151 /
((68691+150294)/2)
=39.6 times
Graph
-
5.0
10.0
15.0
20.0
25.0
30.0
35.0
40.0
45.0
2010 2009 2008
K ohat Cement
Lucky Cement
P ioner Cement
Activity Ratio Analysis
Inventory turnover : Cost of goods sold / Average inventory
.
Company’s 2010 2009 2008
Kohat Cement
=3341872196
/((290433057+139293693)/2)
=15.55 times
=2591021469/((174317806+1392
93693)/2
16.52 times
=1288570903
/((174317806+125147740)/2)
=8.6 times
Lucky Cement 16529932/((608813+1196608)/2)
=18.33 times
16519138/((1196608+709372)/2)
=17.33 times
=12595158 /
((709372+676256)/2)
=18.07 times
Pioneer
Cement
=3953814/((132072+146066)/2)
=28.43 times
=3667343/((146066+68691)/2)
=34.15 times
=4340151 /
((68691+150294)/2)
=39.63 times
Graph
Activity Ratio Analysis
Average age of inventory = 365 days / inventory turnover.
.
Company’s 2010 2009 2008
Kohat Cement =365/ 15.6=23.4 Days =365/16.5=22.1 Days =365/8.6=42.4 Days
Lucky Cement =365/ 18.3=20 Days =365/ 17.3=21.1 days =365/18.2=20.1 days
Pioneer
Cement
=365/28.4=12.9 days =365/34.2=10.7 days =365/39.6=9.2 days
Graph
-
5.0
10.0
15.0
20.0
25.0
30.0
35.0
40.0
45.0
2010 2009 2008
Kohat Cement
Lucky Cement
Pioner Cement
Activity Ratio Analysis
Operating Cycle = (DIO + DSO – DPO).
DSO represents day sales outstanding
DIO represents days inventory outstanding
DPO represents days Payables outstanding
DPO = (Average accounts payables / cost sales) * 365
DIO = (Average inventories / cost of sales) * 365 DSO = (Average accounts receivables / net sales) * 365
.
Company’s 2010 2009 2008
Kohat Cement =(23.4+1.87-471)
=-445.73 days
=(22.12+1.78-539)
= -515 days
= (42.44+4.87-610 )
= - 562 days
Lucky Cement =(19.95+15.24-1157)
= -1121days
=21.1+13.79-1085
= -1050 days
=(20.05+12.88-1805)
= -1772 days
Pioneer
Cement
=(12.85+3.51-83.74)
= -0.89 days
=(10.67+2.82-61.32)
= -1.29 days
=(9.22+2.62-935)
= -23 days
Sample for Presenting Ratio
AnalysisAfter presenting the table for working of ratio, you are
required to present the graph of that ratio
(2,000.00)
(1,800.00)
(1,600.00)
(1,400.00)
(1,200.00)
(1,000.00)
(800.00)
(600.00)
(400.00)
(200.00)
-
2010 2009 2008
Kohat Cement
Lucky Cement
Pioner Cement
Activity Ratio Analysis
Total asset turnover = Total sales / Total Assets
.
Company’s
2010 2009 2008
Kohat Cement
=3692038418
/((8673379806+8624894242)/
2)
= 0.42 times
=3395580759/((8624894242
+7623920500)/2) = 0.41
times
=1375972754
/((7623920500
+6153376959)/2) = 0.19
times
Lucky Cement =24508793/((38310244+3839
2362)/2)
= 0.64 times
=26303404/((38,392362+34,
239074)/2)=0.724 times
=16957879 / ((34239074+
25730226)/2)
= 0.56 times
Pioneer
Cement
=3872834/((10325494+10347
734)/2)
= 0.37 Times
=5000235/((10347734+1047
2589)/2)
=0.480
=4853764
/((10472589+8610497)/2)
= 0.50 times
Graph
Activity Ratio Analysis
Fixed Asset turnover = sales / Average fixed Assets
.
Company’s
2010 2009 2008
Kohat Cement =3692038418/((7229393785+
6937818150)/2)
= 0.52 times
=3395580759/((6937818150
+6248719954)/2)
= 0.51 times
=1375972754
/((6248719954+551890568
9)/2) = 0.23 times
Lucky Cement =24508793/((31378255+3047
6872)/2) = 0.79 times
=26303404/((25829520+304
76872)/2) = 0.93 times
=16957879 /
((20318908+25829520)/2)
= 0.73 times
Pioneer
Cement
=3872834/((8937904+925467
4)/2)
= 0.42 times
=5000235/((9254674+95708
65)/2)
= 0.53 times
=4853764 /
((7510640+9570865)/2)
= 0.56 times
Graph
Conclusion/Findings
• Three companies are performing well in their respective norms according
to their mission and objectives
• At the end of 2007 2008 and 2010 the Pioneer cement and in the year
ended 2008 and 2010 the Kohat Cement both have negative profit. The
fact that the company has negative profit could indicate that the company
will have problems in expanding.
• However, positive working capital in and of itself is good and could
indicate that the companies have less financial subsidiaries
Recommendations
1. Maintain proper budget of every accounts like sales
production labor material and other expenses.
2. Enhance the quality of the product
3. Maintain proper collection strategy and cash basis sales
can improve the cash flow of the company
4. Three companies should required to com out from the last years and
decrease previous years effect and should improve its PAT through
increasing its efficiency by reducing the operating expense down
Thank You

Project final presentation by nigah e-nazar

  • 1.
    In the nameof Allah Who is the most beneficent & the most merciful
  • 2.
    Name: Nigah-e-Nazar ID: Mc070400183 Degree:MSBA Specialization: Finance
  • 3.
    ACTIVITY RATIOS’ ANALYSISOF KOHAT CEMENT, LUCKY CEMENT AND PIONEER CEMENT IN FOR THE YEAR 2008-09-2010
  • 4.
    Introduction of theProject • Cement industry is indeed a highly important segment of industrial sector that plays a pivotal role in the socio-economic development. Though the cement industry in Pakistan has witnessed its lows and highs in recent past, it has recovered during the last couple of years and is buoyant once again. Activity ratio analysis to judge the financial performance of different companies whether they belong to the same industry or to the different industries is always different from each other. They vary from each other in many aspects of the recording of the transactions. • PROJECT AIM My Project is concern to measure the Activities ratio of Kohat Cement, Lucky Cement ,Pioneer cement for the year 2008-2009 and 2010
  • 5.
    Objectives and Significance •Objectives • The reason(s) that why this company is able to manage its assets effectively. • • The reason(s) that why this company is NOT able to manage its assets effectively. Significance. • Get idea how to these companies manage their assets effectively • Get clear picture what are various factors that companies not able to manage their assets effectively • Data will help for both companies to understand these factors • To fulfill my MBA degree requirement
  • 6.
    Data Collection Secondary Datahas been used and it was collected from the three Companies Financial statement
  • 7.
    Data Processing Financial ratioanalysis involves the calculation and comparison of ratios which are derived from the information given in the company's financial statements Date was processed and analyzed on the excel sheet for Graphically and tabulation presentation
  • 8.
    Data Analysis Data wasanalyzed and proceed on the excel sheet. Bar graphs were also used for interpretation of three companies ratio analysis
  • 9.
    Data Analysis (Cont…)‫‏‬ •All data are collected thorough internet with the help of followin links • http://www.luckycement.com/Financialreport%20pdf/Annual-Report 2010.pdf • http://www.lucky-cement.com/financialreports.htm • www.kohatcement.com/mainfinancial.htm • http://www.kohatcement.com/pdf/30thJUNE2010.pdf • www.researchandmarkets.com/reports/.../kohat_cement_company_ 08_ • http://www.kohatcement.com/pdf/30thSept2009.pdf • http://www.pioneercement.com/accounts.html
  • 10.
    KOHAT CEMENT LIMITED FinancialStatements For Four Years. Particulars 2010 2009 2008 2007 Rs in Thousands Rs in Thousands Rs in Thousands Rs in Thousands Sales 3,692,038,418 3,395,580,759 1,375,972,754 1,553,733,256 Cost of sles 3,341,872,196 2,591,021,469 1,288,570,903 1,210,466,340 Gross profit 350,166,222 804,559,290 87,401,851 343,266,916 Distribution and selling expenses 56,245,683 111,490,601 24,878,363 18,701,815 Administrative expenses 35,943,591 30,094,507 40,894,043 46,338,529 92,189,274 141,585,108 65,772,406 65,040,344 Operating Profit 257,976,948 662,974,182 21,629,445 278,226,572 Other operating Expense 4,835,758 3,291,944 20,958,970 7,640,715 253,141,190 659,682,238 670,475 270,585,857 Other operating income 23,210,906 34,218,809 35,978,496 75624748 276,352,096 693,901,047 36,648,971 346,210,605 Financial charges 658,589,707 549,902,638 48,935,320 18370018 Loss on Derivative Financial Instruments 122,813,948 267,286,401 - 658,589,707 672,716,586 316,221,721 18,370,018 Loss/ profit before taxation (382,237,611) 21,184,461 (279,572,750) 327,840,587
  • 11.
    KOHAT CEMENT LIMITED BALANCESHEET FOR FOUR YEARS Particulars 2010 2009 2008 2007 SHARE CAPITALAND RESERVES Authorised Capital 150,000,000(2009 150,000000) ord.share of Rs 10 each 1,500,000,000 1,500,000,000 1,500,000,000 15,000,000 Issued, subscribed and paid up share capital 1,287,572,410 1,287,572,410 1,170,520,370 1017843800 Reserves 51,278,714 34,078,866 235,805,586 396306773 Accumulated Profit 622,118,747 949,895,889 922,803,191 1145242557 1,960,969,871 2,271,547,165 2,329,129,147 2,559,393,130 NON-CURRENT LIABILITIES Long term financing secured 3,049,320,000 2,989,387,373 2,981,785,715 2,703,308,354 Liabilities against assets subject to finance lease secured 2,040,128 3,686,712 - Long term Security Deposite and
  • 12.
    LUCKY CEMENT LIMITED FINANCIALSTATEMENTS OF FOUR YEARS Particulars 2010 2009 2008 2007 Rs in Thousands Rs in Thousands Rs in Thousands Rs in Thousands Sales 24,508,793 26,330,404 16,957,879 12,521,861 Cost of sles 16,529,932 16,519,138 12,595,158 8,846,706 Gross profit 7,978,861 9,811,266 4,362,721 3,675,155 Distribution and selling expenses 3,433,047 2,427,837 1,155,054 497,729 Administrative expenses 303,244 165,936 131,300 111,311 3,736,291 2,593,773 1,286,354 609,040 Operating Profit 4,242,570 7,217,493 3,076,367 3,066,115 Financial charges 569,184 1,236,971 126,743 862,847 Other operating income (1,902) (23,255) (1,293) (629,289) Other Charges 257,774 826,776 644,388 142,204 825,056 2,040,492 769,838 375,762 Profit/Loss before taxation 3,417,514 5,177,001 2,306,529 2,690,353 Taxation Current 195,697 156,744 85,394 63,146
  • 13.
    LUCKY CEMENT LIMITED BALANCESHEET FOR FOUR YEARS Particulars 2010 2009 2008 2007 SHARE CAPITAL AND RESERVES Issued, subscribed and paid up share capital 3,233,750 3,233,750 3,233,750 2,633,750 Reserves 21,862,179 20,018,222 15,421,673 6,719,800 25,095,929 23,251,972 18,655,423 9,353,550 NON-CURRENT LIABILITIES Long term financing 1,658,600 4,300,000 6,633,333 8,335,604 Long term deposit 31,957 28,589 30,252 25,863 Deferred tax liability 319,217 234,633 174,171 147,245 Deferred tax tax 1,562,850 1,478,490 1,058,998 1,515,535 3,572,624 6,041,712 7,896,754 10,024,247 CURRENT LIABILITIES Trade and other payables 3,043,320 2,677,356 3,549,543 1,546,699 Accrued mark-up 155,500 233,381 288,977 326,181 Short term borrowings 6,267,112 6,187,941 3,606,710 2,864,397 Current portion of non-current liabilities 175,759 - 241,667 1,615,152 9,641,691 9,098,678 7,686,897 6,352,429
  • 14.
    PIONER CEMENT LIMITED FINANCIALSTATEMENTS OF FOUR YEARS Particulars 2010 2009 2008 2007 Rs in Thousands Rs in Thousands Rs in Thousands Rs in Thousands Sales 3,872,834 5,000,235 4,853,764 3,185,418 Cost of sles 3,953,814 3,667,343 4,340,151 2,813,309 Gross profit (80,980) 1,332,892 513,613 372,109 Selling /Distribution expenses 158,842 359,975 466,047 108,405 Administrative expenses 78,835 97,654 89,978 86,876 General / Other expenses 168,289 277,539 149,029 7,108 Other operating income (20,285) (28,047) (30,630) (11,687) Operating Profit/ loss (466,661) 625,771 (160,811) 181,407 Financial charges 392,658 451,465 413,203 365,848 loss / Profit before tax (859,319) 174,306 (574,014) (184,441)
  • 15.
    PIONER CEMENT LIMITED BALANCESHEET FOR FOUR YEARS Particulars 2010 2009 2008 2007 SHARE CAPITAL AND RESERVES Authorised Share Capital 3,500,000 2,500,000 2,500,000 2,500,000 Issued, subscribed and paid up share capital 2,227,552 1,995,324 1,995,324 1,698,148 Reserves (9,334) 405,217 310,136 398,076 Total equity 2,218,218 2,400,541 2,305,460 2,096,224 Surplus on Revalution on fixed Assets 2,120,629 2,180,889 2,239,856 574,203 NON-CURRENT LIABILITIES Long term financing secured 41,191 76,851 72,603 Laibility Against asset subject to finance lease 120,797 215,480 237,795 486,577 Long term musharika finance 50,000 Long term Deposit 1,168 1,068 1,841 5,247 Long Term Creditors Un Secured 2,348 8,731 15,114 21,497 Deferred liability 487,764 923,120 906,186 1,010,587 Long term Loan loan 466,231 1,087,583 1,701,777 2,293,709 1,078,308 2,277,173 2,939,564 3,940,220 CURRENT LIABILITIES Creditors against expansion Project 29,594 283,428
  • 16.
    Activity Ratio Analysis AccountReceivable Turnover Ratio : Total Credit Sales / Average Account Receivable Company’s 2010 2009 2008 Kohat Cement 369,203,8418 / ((20010133+ 17792165) / 2) = 195.33 times =3395580759/((17792165+1 5341081)/2) = 204.96 times =1375972754 /((15341081 +21381453)/2) =74.93 times Lucky Cement 24,508,793 / ((779305+1267248)/2) = 23.95 times =26303404/((1267248+7203 14)/2) = 26.47 times =16957879 / ((720314+476667)/2 28.33 times Pioneer Cement = 38,72,834 / ((36851+37802)/2) = 103.75 times =5000235/ ((37402+40124)/2) = 128.99 times =4853764 /((40124+29717)/ 2) =138.99 times
  • 17.
  • 18.
    Activity Ratio Analysis Averagecollection period Ratio : 365 / Receivable turnover ratio. Company’s 2010 2009 2008 Kohat Cement 365/195.33 =1.87 Days 365/204.96 = 1.78 days 365/74.93 =4.87 days Lucky Cement 365/ 23.95 =15.24 days =365/ 26.47 =13.79 days 365/28.33 =12.88 days Pioneer Cement 365/ 103.75 = 3.52 days 365/128.99 =2.83 days 365/138.99 =2.63 days
  • 19.
  • 20.
    Activity Ratio Analysis Accountspayable turnover: Total Supplier Purchase / Average Account Payable. Company’s 2010 2009 2008 Kohat Cement (568942559) /((734312487+554458612)/2)= 1 times (375463440)/((554458612+2444 65133)/2) =0.93 times (146216758) /((244465133+178982959)/2)= 0 .69 times Lucky Cement 959358/(3043320+2677356)/2 =0.33 times (899891)/((3549543+2677356)/2) =0.29 times (717439) / ((1546699+3549543)/2) =0.28 times Pioneer Cement (3953814+132072146066)/((9039 36+629132)/2) = 5.13 times (3667343+146066- 68691)/((863265+629132)/2)= 5.01 times (266895) / ((392894+863265)/2) =0.42 times
  • 21.
  • 22.
    Activity Ratio Analysis Inventoryturnover : Cost of goods sold / Average inventory . Company’s 2010 2009 2008 Kohat Cement =3341872196 /((290433057+139293693)/2) =15.55 times 2591021469/((174317806+13929 3693)/2) =16.52 times =1288570903 /((174317806+125147740)/2) =8.6 times Lucky Cement 16529932/((608813+1196608)/2) =18.31 times 16519138/((1196608+709372)/2) =17.33 times =12595158 / ((709372+676256)/2) =18.1 times Pioneer Cement =3953814/((132072+146066)/2)= 28.4 times =3667343/((146066+68691)/2) =34.15 times =4340151 / ((68691+150294)/2) =39.6 times
  • 23.
  • 24.
    Activity Ratio Analysis Inventoryturnover : Cost of goods sold / Average inventory . Company’s 2010 2009 2008 Kohat Cement =3341872196 /((290433057+139293693)/2) =15.55 times =2591021469/((174317806+1392 93693)/2 16.52 times =1288570903 /((174317806+125147740)/2) =8.6 times Lucky Cement 16529932/((608813+1196608)/2) =18.33 times 16519138/((1196608+709372)/2) =17.33 times =12595158 / ((709372+676256)/2) =18.07 times Pioneer Cement =3953814/((132072+146066)/2) =28.43 times =3667343/((146066+68691)/2) =34.15 times =4340151 / ((68691+150294)/2) =39.63 times
  • 25.
  • 26.
    Activity Ratio Analysis Averageage of inventory = 365 days / inventory turnover. . Company’s 2010 2009 2008 Kohat Cement =365/ 15.6=23.4 Days =365/16.5=22.1 Days =365/8.6=42.4 Days Lucky Cement =365/ 18.3=20 Days =365/ 17.3=21.1 days =365/18.2=20.1 days Pioneer Cement =365/28.4=12.9 days =365/34.2=10.7 days =365/39.6=9.2 days
  • 27.
  • 28.
    Activity Ratio Analysis OperatingCycle = (DIO + DSO – DPO). DSO represents day sales outstanding DIO represents days inventory outstanding DPO represents days Payables outstanding DPO = (Average accounts payables / cost sales) * 365 DIO = (Average inventories / cost of sales) * 365 DSO = (Average accounts receivables / net sales) * 365 . Company’s 2010 2009 2008 Kohat Cement =(23.4+1.87-471) =-445.73 days =(22.12+1.78-539) = -515 days = (42.44+4.87-610 ) = - 562 days Lucky Cement =(19.95+15.24-1157) = -1121days =21.1+13.79-1085 = -1050 days =(20.05+12.88-1805) = -1772 days Pioneer Cement =(12.85+3.51-83.74) = -0.89 days =(10.67+2.82-61.32) = -1.29 days =(9.22+2.62-935) = -23 days
  • 29.
    Sample for PresentingRatio AnalysisAfter presenting the table for working of ratio, you are required to present the graph of that ratio (2,000.00) (1,800.00) (1,600.00) (1,400.00) (1,200.00) (1,000.00) (800.00) (600.00) (400.00) (200.00) - 2010 2009 2008 Kohat Cement Lucky Cement Pioner Cement
  • 30.
    Activity Ratio Analysis Totalasset turnover = Total sales / Total Assets . Company’s 2010 2009 2008 Kohat Cement =3692038418 /((8673379806+8624894242)/ 2) = 0.42 times =3395580759/((8624894242 +7623920500)/2) = 0.41 times =1375972754 /((7623920500 +6153376959)/2) = 0.19 times Lucky Cement =24508793/((38310244+3839 2362)/2) = 0.64 times =26303404/((38,392362+34, 239074)/2)=0.724 times =16957879 / ((34239074+ 25730226)/2) = 0.56 times Pioneer Cement =3872834/((10325494+10347 734)/2) = 0.37 Times =5000235/((10347734+1047 2589)/2) =0.480 =4853764 /((10472589+8610497)/2) = 0.50 times
  • 31.
  • 32.
    Activity Ratio Analysis FixedAsset turnover = sales / Average fixed Assets . Company’s 2010 2009 2008 Kohat Cement =3692038418/((7229393785+ 6937818150)/2) = 0.52 times =3395580759/((6937818150 +6248719954)/2) = 0.51 times =1375972754 /((6248719954+551890568 9)/2) = 0.23 times Lucky Cement =24508793/((31378255+3047 6872)/2) = 0.79 times =26303404/((25829520+304 76872)/2) = 0.93 times =16957879 / ((20318908+25829520)/2) = 0.73 times Pioneer Cement =3872834/((8937904+925467 4)/2) = 0.42 times =5000235/((9254674+95708 65)/2) = 0.53 times =4853764 / ((7510640+9570865)/2) = 0.56 times
  • 33.
  • 34.
    Conclusion/Findings • Three companiesare performing well in their respective norms according to their mission and objectives • At the end of 2007 2008 and 2010 the Pioneer cement and in the year ended 2008 and 2010 the Kohat Cement both have negative profit. The fact that the company has negative profit could indicate that the company will have problems in expanding. • However, positive working capital in and of itself is good and could indicate that the companies have less financial subsidiaries
  • 35.
    Recommendations 1. Maintain properbudget of every accounts like sales production labor material and other expenses. 2. Enhance the quality of the product 3. Maintain proper collection strategy and cash basis sales can improve the cash flow of the company 4. Three companies should required to com out from the last years and decrease previous years effect and should improve its PAT through increasing its efficiency by reducing the operating expense down
  • 36.