Process, Findings and Implications from Two Health Impact Assessments: Informing Farm to School Policy, Programs and Research - handouts and HIAs
•
1 like•470 views

Process, Findings and Implications from Two Health Impact Assessments: Informing Farm to School Policy, Programs and Research Presenters were: Dr. Tia Henderson, Upstream Public Health Megan Lott, Kids' Safe and Healthful Foods Project, The Pew Charitable Trusts

Recommended
Recommended
More Related Content
What's hot
What's hot (20)
Viewers also liked
Similar to Process, Findings and Implications from Two Health Impact Assessments: Informing Farm to School Policy, Programs and Research - handouts and HIAs
Similar to Process, Findings and Implications from Two Health Impact Assessments: Informing Farm to School Policy, Programs and Research - handouts and HIAs (20)
More from National Farm To School Network
More from National Farm To School Network (13)
Recently uploaded
Recently uploaded (20)
Process, Findings and Implications from Two Health Impact Assessments: Informing Farm to School Policy, Programs and Research - handouts and HIAs
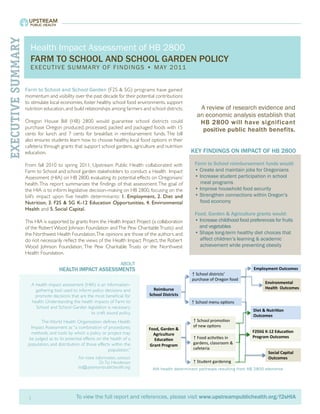
- 1. Health Impact Assessment EXECUTIVE SUMMARY Health Impact Assessment of HB 2800 FARM TO SCHOOL AND SCHOOL GARDEN POLICY E X E C U T I V E S U M M A RY O F F I N D I N G S • M AY 2 011 Farm to School and School Garden (F2S & SG) programs have gained momentum and visibility over the past decade for their potential contributions to stimulate local economies, foster healthy school food environments, support nutrition education, and build relationships among farmers and school districts. A review of research evidence and an economic analysis establish that Oregon House Bill (HB) 2800 would guarantee school districts could HB 2800 will have significant purchase Oregon produced, processed, packed and packaged foods with 15 positive public health benefits. cents for lunch and 7 cents for breakfast in reimbursement funds. The bill also ensures students learn how to choose healthy, local food options in their cafeteria through grants that support school gardens, agriculture and nutrition education. KEY FINDINGS ON IMPACT OF HB 2800 From fall 2010 to spring 2011, Upstream Public Health collaborated with Farm to School reimbursement funds would: Farm to School and school garden stakeholders to conduct a Health Impact • Create and maintain jobs for Oregonians Assessment (HIA) on HB 2800, evaluating its potential effects on Oregonians’ • Increase student participation in school health. This report summarizes the findings of that assessment. The goal of meal programs the HIA is to inform legislative decision-making on HB 2800, focusing on the • Improve household food security bill’s impact upon five health determinants: 1. Employment, 2. Diet and • Strengthen connections within Oregon’s Nutrition, 3. F2S & SG K-12 Education Opportunities, 4. Environmental food economy Health and 5. Social Capital. Food, Garden & Agriculture grants would: This HIA is supported by grants from the Health Impact Project (a collaboration • Increase childhood food preferences for fruits of the Robert Wood Johnson Foundation and The Pew Charitable Trusts) and and vegetables the Northwest Health Foundation.The opinions are those of the authors and • Shape long-term healthy diet choices that do not necessarily reflect the views of the Health Impact Project, the Robert affect children’s learning & academic Wood Johnson Foundation, The Pew Charitable Trusts or the Northwest achievement while preventing obesity Health Foundation. ABOUT HEALTH IMPACT ASSESSMENTS Employment Outcomes ↑ School districts’ purchase of Oregon food A health impact assessment (HIA) is an information- Environmental Reimburse Health Outcomes gathering tool used to inform policy decisions and promote decisions that are the most beneficial for School Districts health. Understanding the health impacts of Farm to ↑ School menu op6ons School and School Garden legislation is necessary Diet & Nutri>on to craft sound policy. Outcomes The World Health Organization defines Health ↑ School promo6on Impact Assessment as “a combination of procedures, of new op6ons Food, Garden & methods, and tools by which a policy or project may F2SSG K-‐12 Educa>on Agriculture be judged as to its potential effects on the health of a ↑ Food ac6vi6es in Program Outcomes Educa>on population, and distribution of those effects within the Grant Program gardens, classroom & population.” cafeteria Social Capital For more information, contact: Outcomes Dr. Tia Henderson ↑ Student gardening tia@upstreampublichealth.org HIA health determinant pathways resulting from HB 2800 elements 1 To view the full report and references, please visit www.upstreampublichealth.org/f2sHIA
- 2. Health Impact Assessment IMPACTS MAJOR FINDINGS The meal reimbursement program would create jobs and stimulate economic growth. CURRENT CONDITIONS • Employment leads to health: The unemployed are up to twice as likely to die OUTCOMES EMPLOYMENT • Oregon’s unemployment rate was 10.5% in Decem- earlier than others of the same age and sex. ber 2010, higher than the Kind of Impact New Jobs A 2.67 employment multiplier means national average of 9% . (Full & Part-time) that for every job created by school • The recession has hurt districts purchasing local foods, Direct effect 101 Oregon’s farms: almost 2/3 additional economic activity would Indirect effect 101 create another 1.67 jobs. of farms reported net losses. Small & mid-sized farms Induced Effect 67 especially are struggling to Total Effect 269 Estimated economic effects of Oregon compete. purchases during the first bieunnium Multiplier 2.67 ($19.6 million in reimbursements) • In 2009, Oregon was one of the hungriest states in the HB 2800 would improve child diet and nutrition. nation: 14% of households DIET AND NUTRITION OUTCOMES were food insecure and 6% • Students who participate in school meal programs learn better and have a of them were hungry. better chance of academic achievement. • HB 2800’s reimbursement and garden grant programs improve the quality • 19% of Oregon kids live in and diversity of food offered during school meals. poverty. • Studies of Farm to School initiatives show increases in meal par ticipation • Kids on free and reduced (for free, reduced, and full-priced meals) between 1.3% and 16%. This meals are more likely to be helps families buy more food at home, lowering household food insecurity. from food insecure families. • In the 2009-’10 school year Oregon has been an innovator in finding Grains: Fruits: Vegetables: 10¢ 15¢ 15¢ 33% of kids eligible for free creative ways to provide its children with fresh or reduced lunches did not and healthy school meals. Without statewide participate. infrastructure to support Farm to School Protein: Milk: efforts, limited funding for school meals can 46¢ • 22% of low-income kids offer only inconsistent options to support 23¢ did not graduate during the Oregon’s children and the farmers who feed them. 2006-’08 school years. 2009-’10 estimates for school lunch budget in Oregon EDUCATION OPPORTUNITIES F2S & SG K-12 • Current Oregon learning Food, Garden and Agriculture education grants standards do not require would increase kids’ understanding of what they eat, children to learn where food how it is grown and how it affects their bodies. comes from or how it is made. ↑ Posi.ve behaviors • Research of F2S & SG programs report that • Cafeterias are not connected children choose more fruits and vegetables - ↑ Physical ac.vity to classroom curriculum. leading to potential increases ↑ Learning, • 1 in 4 Oregon adolescents in consumption. ∆ Learning Knowledge, Achievement are overweight or obese. environment • 2009: 58% of 11th graders • Studies show ↑ Student gardening ↑ Youth self efficacy ↑ Educa.on eat three or less servings of Food, Garden that children & Agriculture on nutri.on, gardens and ↑ Youth preferences fruits and vegetables a day. who spend Grant Program agriculture ↑ Food ac.vi.es in for fruits & vegetables gardens, classroom & time in the cafeteria ↑ Youth consump.on of garden learn better, get physical fruits and vegetables activity and behave better in the classroom. ∆ Youth ↓ Youth diet and overweight nutri.on and obesity 2 To view the full report and references, please visit www.upstreampublichealth.org/f2sHIA
- 3. Health Impact Assessment IMPACTS The reimbursement program gives more MAJOR FINDINGS cont’d. flexibility to buy sustainably produced food; this can impact environmental CURRENT CONDITIONS health factors. HEALTH OUTCOMES ENVIRONMENTAL • A stable product demand helps farmers and processors Oregonians currently demand food produced try new practices such as solar-heated greenhouses and processed with alternative methods. or integrated pest management plans. These practices reduce health issues from soil and water contamination. Between 2006 and 2008, the total land in organic production nearly doubled, an 86.7% increase from • A more stable product demand also helps keep farmland almost 70,000 to over 130,000 acres in response in production, which can reduce greenhouse gasses. If all to this demand. districts just served Oregon fruit or vegetables at lunch one day a month, it would support $756,000 in sales. • Buying Oregon products does not reduce greenhouse gas emissions from transportation significantly, depend- ing on the food source. OUTCOMES SOCIAL CAPITAL Social capital is a bank of resources, such as job The reimbursement program will help referrals, that individuals gain through strong farmers and nutrition staff build food relationships to others. This improves people’s system connections; the grants will help health and access to opportunities. students work better together. If schools build connections with producers, other • Preliminary studies indicate school garden participants institutions can build upon these relationships, have positive changes in social skills and their ability to connecting with those who want to buy Oregon work with others. food. • “Supporting local farmers” is a reported primary benefit for Farm to School programs; research is needed to examine the impact on social isolation and depression. RECOMMENDATIONS for HB 2800: CHANGES TO IMPROVE HEALTH 1. The current policy allows food produced or processed in other states or countries to qualify for a reimbursement. Amend HB 2800 to specify that schools can only get reimbursed for foods produced or processed in Oregon to increase economic activity in our state. 2. To improve health outcomes for vulnerable populations, specify that while grants are open to all school districts, Food, Agriculture and Garden education grants will be preferentially given to school districts serving: ◦◦ a low-income student population, defined where 40% are eligible for free or reduced meals, or, ◦◦ schools with a racially diverse student population, defined as 20% or more non-white, or ◦◦ schools in rural or urban areas with limited food access, defined as 12% or more of residents are low- income and live more than 10 miles from a grocery store. 3. To improve child health outcomes, specify funding criteria for Food, Agriculture and Garden education grants to support schools developing multiple-component programs that increase child health benefits. Garden grants should be preferentially awarded to programs working toward having at least one element in each of the following categories: Education, Promotion, Procurement and Community Involvement. 3 To view the full report and references, please visit www.upstreampublichealth.org/f2sHIA
- 4. Health Impact Assessment CONCLUSIONS SUMMARY OF HEALTH OUTCOMES AND IMPACTS HIGHLIGHTS ON HB 2800 ($23 MILLION) Health Outcome or Magnitude w/ Impact Impact of = Distribution Quality of Health Determinant HIA rec’s w/ HIA Recs. Evidence Employment Impacts Health Outcome or Quality of Health Determinant & life expectancy Health pppp Distribution and related jobs Farm sector Evidence **** Employment Impacts Job creation ppp ~270 new jobs **** LEGEND Health & life expectancy pppp Oregon product demand Farm sector and 197 School Districts4 pppp 100 — related jobs 100 **** **** Job creation Workers’ ability to ppp Strong impact on many pay bills ~270 new jobs new jobs ppp ~270 **** **** Strong impact for few or small impact on many product demand activity Oregon Economic 100 - 197 3.16 economic multiplier **** pppp pppp School Districts4 **** Moderate impact on medium number or strong Impacts on Child Diet and Nutrition impact onWorkers’ ability to pay bills few ppp ~270 new jobs **** Small impact on few Meal program participation ppp 561,698 public school children1 ** None No effect Economic activity pppp Child learning & academic 3.16 economic multiplier **** attainment ppp 561,698 public school children 1 **** **** 10+ strong Impacts on Child Diet and Nutrition studies *** 5 -10 strong studies or data Household food security pp 210,446 households2 *** Meal program participation ppp 561,698 public school children1 ** analysis School meal nutrition pp+ 561,698 public school children1 * Child learning & academic ** 5 or more studies of weak 561,698 public school children1 **** attainment and moderate quality; or ppp Child overweight & obesity pp+ 1 in 4 children ** studies have mixed results * <5 studies and claim Farm to School and pp Garden Education Impacts Household food security School 210,446 households2 *** consistent with public Gardening education + pppp ~15,000 new children3 **** School meal health principles nutrition pp 561,698 public school children1 * Child fruit & vegetable ppp + 561,698 school children ** 1 **** Child overweight & obesity consumption pp+ 1 in 4 children Farm to School Agriculture & nutrition 1 Enrolled children in Oregon public school system, Oregon Department of and School Garden Education pp+ Impacts ~15,000 new children3 *** Education, 2009-10. education Gardening educationnutrition knowledge 2 Household Food Security in the Child pppp ~15,000 new children3 children3 pp+ ~15,000 new **** *** United States, 2009, US Dept. of vegetable Child fruit & Nutrition staff knowledge+ Agriculture, Economic Research Service, ppp pp 100 school children1 561,698 public —197 School Districts 100 **** ** consumption 2010. Child achievement pp ~15,000 new children 3 * 3 Low estimate based on 2007 ODE& nutrition Agriculture Child self-efficacy pp+ ~15,000 new children3 children3 pp ~15,000 new *** * education survey of reported participation in school gardens; would be over two year Child nutrition Child physical activity + grant time period. knowledge pp ~15,000 new children3 children3 pp ~15,000 new *** * Nutrition staff knowledge 4 Low estimate from 2010 Oregon Impacts on Environmental pp Health100-197 School Districts ** Department Education number of Oregon fruit & vegetable $756,000 — $15,120,000 Child achievement School Districts that purchase local. crops maintained pp ~15,000 newin school purchases6 pp children3 * *** 5 Certified estimate of Oregon Child self-efficacy population from US Census data, pp Demand for food grown ~15,000 new children3 * Population Research Center, 2010. p Oregon food sectors * Child physical activity with sustainable practices pp ~15,000 new children3 * 6 Conservative estimates from: (280,000 school lunches served in Greenhouse gas emissions None 3,844,195 Oregonians5 ** 2009-10 x $.30 for fruits and vegetables)Environmental Health Impacts on from food transport Oregon fruit &Impacts on Social Capital vegetable x 9 to 180 school days. $756,000 - $15,120,000 *** pp crops maintained + Indicates schools will have to take Student relationships in school purchases6 children3 pp ~15,000 new * action beyond the reimbursement Demand for food grownprocessor & Producer, program in the policy. p Oregon food sectors Districts ppp ~100 School * *** with sustainable practices connections = See report for full summary table, school staff Climate changeParent food participation including impacts without HIA policy from school transport recommendations. None 3,844,195 ~15,000 new5children3 pp Oregonians ** * Impacts on Social Capital 4 Student relationships report and pp To view the full ~15,000 new children3 * references, please visit www.upstreampublichealth.org/f2sHIA Producer, processor & ~100 School Districts *** school staff connections ppp
- 5. Health Impact Assessment National Nutrition Standards for Snack and a la Carte Foods and Beverages Sold in Schools
- 6. Executive Summary Introduction The foods and beverages available in schools have a significant impact on children’s diets and weight, with many students consuming more than half of their daily calories at school.1 In addition to meals, nearly all students can buy foods and beverages at school, often from multiple locations, including cafeteria a la carte lines, vending machines, and school stores. These snacks and drinks are technically called “competitive foods” because they compete with school meals for students’ spending; however, they are also referred to as “snack and a la carte foods and beverages” throughout this document. Ensuring that schools sell nutritious foods is critical to improving children’s diets. This is one of the goals of the Healthy, Hunger-Free Kids Act (HHFKA), passed in 2010, which directs the U.S. Department of Agriculture (USDA) to update nutrition standards for all foods and beverages sold in schools during the school day by aligning them with the current dietary guidelines. In an effort to inform USDA as it updates nutrition standards for foods and beverages that are sold outside of the school meal programs, and to better understand how standards might affect student health and school finances, the Kids’ Safe & Healthful Foods Project and the Health Impact Project, both collaborations of The Pew Charitable Trusts and the Robert Wood Johnson Foundation, worked with Upstream Public Health, a nonprofit research and policy organization, to conduct a health impact assessment (HIA). Health Impact Assessment: National Nutrition Standards for Snack and a la Carte Foods and Beverages 3
- 7. EXECUTIVE SUMMARY Health Impact Assessment Background An HIA is a prospective research tool that guides decision makers in considering the possible health impacts, and in some cases financial considerations, of proposals. HIAs recommend actions to minimize adverse consequences and optimize beneficial effects. ck Foods andHIA are to: The goals of this Beverages oods and Beverages assess potential ard Outcomesrelevant data to for snack and a lahealth impacts as beverages sold implement USDA’s s and Beveragesstandards • Synthesize school districts Outcomes national and state deliberation regarding the potential costs and benefits related to updated national carte foods and in schools. omes • Inform snack and a la carte food and beverage standards in schools. national Policy • Identify potential health disparities and inequities that could result from national snack and Policy a la carte food and beverage standards. National nutrition standards for snack foods olicy • Make recommendations to USDA in order to maximize positive health outcomes and minimize and beverages sold in schools1 National nutrition standards for snack foods potential health risks. and beverages sold in schools1 tional nutrition standards for snack foods d beverages sold in schools1 team followed the North American Snack Foods and Beverages The research Summary of ES, MS, HS snack food 2 Summary of Snack and a la Carte HIA Practice Standards Version Nutrition Standard Outcomes 2 and the National and beverage availability 2 ES, MS, HSCouncilfood snack Guidelines3 to develop each FIGURE ES.1 Food and Beverage Health Research Determinant Pathway and beverage availability 2 ES, MS, HS snack foodHIA. The most comprehensive stage of this to 2healthy foods and beverages Access and beverage availability unhealthy foods and beverages in Access to Access to healthy foodsdatebeverages literature review to and on competitive foods Policy School snack foods meeting DGA Access to unhealthy as originalbeverages analysis of schools, as well foods and empirical Access to healthy foods and beverages National nutrition standards for snack foods School snack foods meeting DGA school financial data was conducted for this HIA. and beverages sold in schools 1 Access to unhealthy foods and beverages School snackThe process also required extensive interviews foods meeting DGA Purchase/consumption ES, MS, HS snack food and involvement of a wide array of experts and and beverage availability 2 Purchase/consumption stakeholders carte sales A la from academia, industry, the public Access to healthy foods and beverages Purchase/consumption Vending sales health community, and those individuals most Access to unhealthy foods and beverages A la carte sales School snack foods meeting DGA School ground level, such sales affected at the store and snack bar as teachers, Vending sales A la carte sales School store and snack bar sales students, and parents, in planning, researching, Vending sales Purchase/consumption School store and snack bar salesthe study. and peer reviewing School services Diet and nutrition A la carte sales Vending sales health outcomes yet proposed updated School services had Diet and health outcomes Because USDA not School store and snack bar sales nutrition from revenue health outcomes time of this study, the HIA standards at the School services health outcomes Diet and nutrition from revenue scenario in which items would be examines ahealth outcomes health outcomes School services Diet and nutrition health outcomes health outcomes rom revenuerequired to meet the 2010 Dietary Guidelines from revenue Change for Americans (DGA). Change Increase Cha Change Change Increase Increase Decrease Decrease Incre See Figure ES.1 for a visual mapping that summarizes Fundraisers are not included. 1 1 Fund-raisers are not included. Dec ES, MS, HS: Elementary school, 2 Increase Decrease the research questions and outcomes school, high school in middle examined 2 ES, MS, HS: Elementary school, middle school, high school Decrease this HIA. Health Impact Assessment: National Nutrition Standards for Snack and a la Carte Foods and Beverages 4
- 8. EXECUTIVE SUMMARY Key Questions and Findings This HIA considers several key research questions related to school food services, diet and nutrition, and vulnerable populations (including low income and ethnic minority students). Diet and Nutrition: The impact of updated nutrition standards for snack foods and beverages sold in schools on children’s school-based diets was the main issue considered in this study. The analysis considered two primary nutritional concerns: (1) the total intake of calories from items sold in schools and (2) the consumption of high-calorie, low-nutrient snack foods and beverages versus healthier options. Specific questions included: • Will the updated standards affect the availability of snacks and drinks sold in schools, student purchases of these items, and student consumption? • Will changes in student consumption of snacks sold in schools affect different chronic disease health outcomes? Finding: Student access to, purchase of, and consumption of unhealthy foods and beverages, and subsequently their risk for disease, decreases. Research indicates that many schools currently sell high-calorie, low-nutrient The increase in child weight observed between 1988 and 2002 snack foods and beverages to students may have been prevented by an average reduction of 110–165 of all ages, who consume them instead calories per day. This is the difference between providing an of healthier options. The HIA found that elementary school student a 150-calorie snack rather than a 250-calorie snack, as indicated by the child’s daily energy needs. the implementation of strong snack and —“Estimating the energy gap among US children: a counterfactual a la carte food and beverage policies approach” by Y.C. Wang, et al (Pediatrics, Dec 2006) that meet the 2010 DGA will decrease students’ access to, purchase of, and consumption of unhealthy foods and beverages while also likely increasing their access to, purchase of, and consumption of healthier items at school. Even small changes to students’ school-based diets—like replacing a candy bar with an apple—may reduce their risk of tooth decay, obesity, and chronic illness through decreased calorie, fat, and sugar intake at school. Additionally, the data suggests that strong snack and a la carte food and beverage policies tend to increase participation in the school meal programs, thus the risk of not having enough to eat also may decrease as children purchase school meals in place of less filling snacks. School Services and Impact on Revenue: The impact of updated nutrition standards for snack and a la carte foods and beverages on student health and school district revenue were of primary concern as food sales are an important component of school budgets. Specific questions included: • Will updated nutrition standards affect students’ participation in the school meals program and school food service revenue? Health Impact Assessment: National Nutrition Standards for Snack and a la Carte Foods and Beverages 5
- 9. EXECUTIVE SUMMARY • Will updated standards affect school-district or other types of revenue that pay for school services? • If revenue changes occur, will they affect student health via changes to enrichment learning opportunities and school-supported physical activity? Finding: Districts would likely not see a decline in revenue. The HIA analysis found that, when schools and districts adopted strong nutrition standards for snack and a la carte foods and beverages, they generally did not experience a decrease in revenue overall. In most instances, school food service revenues increased due to higher participation in school meal programs. However, in some cases, school districts experienced initial declines in revenue when strengthening nutrition standards. The HIA concluded that, over time, the negative impact on revenue could be minimized—and in some cases reversed—by implementing a range of strategies.i Limited data exists on the impact of snack food and beverage policies on fund-raising revenue for school groups, such as athletic teams and student government. More research is needed in this area in order to determine how such revenue changes might influence the provision of school services, such as physical activity and enrichment programming, and thus the related effect on students’ health. Vulnerable Populations: A primary consideration of this analysis was how vulnerable populations—including students from lower-income families as well as those who are black or Hispanicii—might be affected by USDA’s snack and a la carte food and beverage policy. These vulnerable populations are more likely to have limited or uncertain access to adequate food;iii to be overweight or obese; to suffer from type 2 diabetes, hypertension, and other chronic diseases; and to have untreated dental caries, all of which are associated with reduced quality of life, more frequent school absences, and longer-term health problem.4-10 Finding: Vulnerable populations would benefit from stronger nutrition standards for snack foods and beverages sold in schools. Updated nutrition standards that make healthier foods more available may have a particularly beneficial effect among vulnerable populations, who are at greater risk for nutrition-related health problems. Vulnerable populations also have higher risk of poor academic outcomes, such as lower test scores and higher dropout rates.11,12 Because a healthy diet is linked with improved school performance, stronger nutrition standards also may have a positive impact on academic indicators, especially among vulnerable populations. The HIA explored other vulnerable populations, such as children of Asian, Pacific Island, and American Indian descent, but data was too limited to draw conclusions. i Effective strategies for reversing potential declines in revenue are discussed in Section 7.3 of the full report. ii Hispanic is the term used throughout this HIA to refer to “a person of Mexican, Puerto Rican, Cuban, South or Central American, or other Spanish culture or origin, regardless of race,” as defined by the U.S. Office of Management and Budget. Other terms, such as Latino, may be used when citing specific literature findings. iii About 15 percent of U.S. households are food insecure, defined by USDA as a household-level economic and social condition of limited or uncertain access to adequate food. Health Impact Assessment: National Nutrition Standards for Snack and a la Carte Foods and Beverages 6
- 10. EXECUTIVE SUMMARY Policy Recommendations The following policy recommendations are meant to inform USDA’s efforts to update nutrition standards for snack and a la carte foods and beverages sold in schools. The recommendations reflect the outcomes and the conclusions described above, are based upon the evidence summarized in this document, and are intended to maximize health benefits while minimizing risks. Although not the primary question considered in his HIA, the research reviewed indicates that the way schools implement improved nutrition standards through marketing, engaging students, and promoting school meals can play a significant role in how both students and the schools are impacted. Thus, in addition to the following policy recommendations to USDA, the full report highlights a range of promising practices for implementation. Recommendation 1: USDA should establish nutrition standards for all foods sold regularly on school grounds outside of the school meal programs. These standards should include: • a requirement that schools sell items from the Dietary Guidelines for Americans list of “foods to encourage;” • age-appropriate calorie limits for items sold individually (snacks: 100 calories for elementary, 140 calories for middle, and 180 calories for high school students; entrée items: 300 calories for elementary and middle and 400 calories for high school students); • a maximum of 35 percent of total calories from sugar; • maximum limits for fats (no more than 35 percent of calories from total fat, 10 percent of calories from saturated fat, and less than or equal to 0.5 g of trans fat per serving); and • incremental reductions in sodium, with a target time frame of 10 years, to achieve full alignment with the Dietary Guidelines for Americans. Recommendation 2: USDA should establish nutrition standards for all beverages sold on school grounds. At a minimum, these standards should: • limit beverages sold in elementary and middle schools to only water, low-fat and fat-free milk, and 100 percent fruit juice in appropriate portions, and • establish calorie and serving size restrictions for all beverages sold in high schools so as to ensure calories obtained from sugar-sweetened beverages during the school day are minimal. Recommendation 3: USDA should adopt policies and practices that ensure effective implementation of the standards. At a minimum, USDA should: • provide technical assistance and training to schools and districts; • provide clear guidance on how the terms infrequent, school day, and school campus as included in the Healthy, Hunger-Free Kids Act are to be addressed; • ensure that nutrition standards are kept up to date with future iterations of the Dietary Guidelines for Americans; and • collaborate with states and nongovernmental organizations to monitor the implementation of the standards. Health Impact Assessment: National Nutrition Standards for Snack and a la Carte Foods and Beverages 7
- 11. EXECUTIVE SUMMARY Concluding Statement This HIA explores the potential impacts of national nutrition standards for competitive foods or foods sold in schools individually as snacks, a la carte items, and beverages. Research included an extensive literature review, interviews, stakeholder discussions, and financial analysis. Overall, the results indicate that strong nutrition standards could have a significant positive impact on the health of students with potentially increased benefits to those populations that are most vulnerable. In addition, if implemented effectively at the district and school levels, the changes can be made with little to no negative financial impact and in fact may even result in improved financial outcomes for schools and districts. Thus, USDA should establish updated standards and adopt practices—as recommended by this report—that are most likely to maximize positive health impacts while assisting schools in effectively implementing the changes. Health Impact Assessment: National Nutrition Standards for Snack and a la Carte Foods and Beverages 8
- 12. Prepared by Dr. Tia Henderson of Upstream Public Health and Megan Lott of the Kids’ Safe and Healthful Foods Project PROGRAM EVALUATIONi HEALTH IMPACT ASSESSMENTii Purpose Purpose Program evaluation is typically a retrospective tool used to gain information about An HIA is a prospective research tool used to assess the potential health impacts program efficacy and to identify areas for program improvement. Evaluation is of a defined project, plan, or policy. The HIA guides decision makers in not only intended to look at "did it work" or not, but also for whom, where, and considering how to maximize beneficial impacts to health and minimize adverse under what circumstances. consequences. HIAs involve a wide array of stakeholders including potentially impacted communities to ensure that the process and results are as powerful as Key Features possible. Program evaluation typically includes the following: • Defines an aim, goals and objectives Key Features • Is guided by a conceptual framework to ask key questions An HIA typically involves six stages: • Uses assessment instruments such as surveys, interviews, a needs assessment, 1. Screening – decide whether an HIA is feasible, timely, and would add value performance monitoring, and literature reviews to collect information to a decision making process 2. Scoping – creates a plan and timeline for the HIA, guided by a logic model • Uses an evaluation matrix to track progress that links the proposal decision to health outcomes • Reports findings to program managers and staff to help strengthen the 3. Assessment – explores existing conditions and evaluates potential health program impacts Program evaluation identifies program strengths and deficiencies, provides data to 4. Recommendations - creates evidence-based recommendations to reduce negative and optimize positive health impacts support continuation, and provides evidence/justification for making changes. 5. Reporting – develops the HIA report to communicate findings and Evaluation provides information over the long term as the basis for program recommendations planning and for program redesign and improvement, such as revisiting program 6. Monitoring and Evaluation – evaluates the process of conducting the HIA, goals and/or resource allocation tracks the impacts of the HIA on the decision-making process, and When to use monitors the impacts on long term health outcomes. • Determine how effectively meeting program goals and objectives When to use • Determining impact of program through measurable outcomes • The proposed decision could have substantial negative or positive health • Determining program needs or gaps that aren’t being addressed effects – especially if these are irreversible or catastrophic • Develop evidence of client/customer satisfaction • The timing of the decision allows for changes based on new information • Identify barriers to successful program implementation and delivery • There is a good chance the HIA–based information will be used by decision • Determining what, if any, changes could improve effectiveness makers to alter the proposal • Determining whether or not resources are being used as intended • The potential for health effects to place a disproportionate burden on, or • Determining if elements of the program are replicable in other settings strongly benefit, vulnerable populations • There is public concern about health effects of the proposal Who is involved • The decision making process would not otherwise consider health Who participates depends on the structure of an organization and on the program you are evaluating. Some people to consider are: Who is involved • Managers and directors (i.e. program, agency, development) • Decision makers (i.e. legislators, planners, project managers, developers) • Program staff (all levels) • Staff who will implement decision • Evaluation consultant • People who will be impacted by the decision (i.e. stakeholders) • Grant writer / foundation contact • HIA consultants • Program participants • Content and technical experts • External stakeholders (such as government officials, funders, "sister" orgs.)
- 13. Prepared by Dr. Tia Henderson of Upstream Public Health and Megan Lott of the Kids’ Safe and Healthful Foods Project Program Evaluation Example HIA Example Evaluation on Sunnyvale Middle Schools’ Farm to School buy-local efforts Hawai’i County Agricultural Plan HIA In the fall of 2010, the members of the Wellness Team (includes a science teacher, The 2010 Hawai’i County Agriculture Development Plan, prepared for the the Vice Principal, two parents, the Wellness Coordinator and the district Hawai’i County Department of Research and Development, is intended to guide Nutrition Services Director) set a 5-year goal for the district to purchase 15% of the revitalization of agriculture as the basis for Hawai’i Island’s (big island) their foods from state sources where feasible (produced and processed). The economic development. The draft plan included key policy activities to support Kitchen Manager at the school also set a goal of one meal a month being as close to agriculture and economic development. It was approved in 2011 by the City 100% local as possible. Council. After the team set the goal, the district Business Manager worked with the district In 2010, the Kohala Center, a non-profit organization, received a grant to School Nutrition Service director to begin 1) entering monthly orders into an complete an HIA on three policy components of the Plan to better understand, excel spreadsheet and 2) asking distributors to let them know on invoices which and inform residents and decision makers, on how the policies would affect items were “local”. public health. Aims of the Evaluation: Aim of the HIA: • Evaluate how far the District has progressed toward the 15% district The goal of the HIA is to inform legislative and regulatory decision-making so goal, and the Kitchen Manager’s goal of one local meal a month. that these three Agriculture Plan policies are implemented in ways that maximize • Determine any barriers the school and district have encountered in health benefits and minimize health risks for Hawai‘i Island residents. This HIA working toward these goals examines the impact of each of the three Agriculture Plan policies on five health • Problem-solve to help meet the goals in the next three years. outcomes or determinants of health, from the range of personal, social, economic, and environmental factors that can affect the health status of individuals or • Use the results as part of a grant application to pay for new kitchen communities: equipment. 1. Food security 2. Obesity Methods: 3. Food-borne illness • Assess purchases using the sales records 4. Economy • Assess meals using previous menus 5. Well-being and cultural connectedness • Interviews with the Kitchen Manager, Business Manager, the Nutrition Service Director Methods: • Two page report discussed at the January 2013 Wellness Committee • Literature review meeting • Secondary data • Input-output economic analysis Who is involved: • One parent and non-profit partner doing the evaluation Who was involved: • The Wellness Committee is advising on the process • Impacted stakeholders including health coalition representatives, garden network representatives, farmers, residents and government agency representatives For more information visit: http://kohalacenter.org/agplan.html i Gelmon S.B., Foucek A., and Waterbury A., Program Evaluation: Principles and Practices, 2nd ed. (Portland, OR: Northwest Health Foundation, 2005). iiii National Research Council, Improving Health in the United States: The Role of Health Impact Assessment (Washington, D.C.: National Academies Press, 2011).