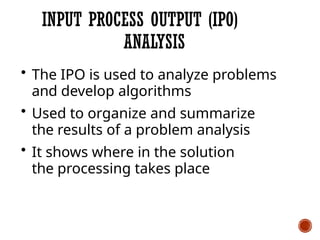
INPUT PROCESS OUTPUT(IPO)
ANALYSIS
• The IPO is used to analyze problems
and develop algorithms
• Used to organize and summarize
the results of a problem analysis
• It shows where in the solution
the processing takes place
5.
INPUT PROCESS OUTPUT(IPO)
ANALYSIS
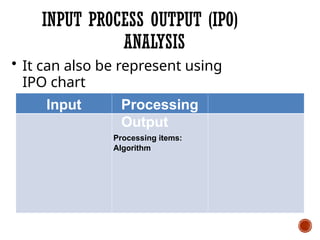
Input Processing
Output
Processing items:
Algorithm
• It can also be represent using
IPO chart
6.
INPUT PROCESS OUTPUT(IPO)
ANALYSIS
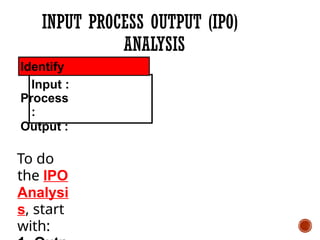
Identify
Input :
Process
:
Output :
To do
the IPO
Analysi
s, start
with:
7.
INPUT PROCESS OUTPUT(IPO)
ANALYSIS
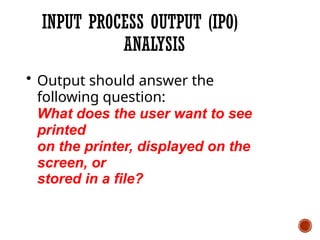
• Output should answer the
following question:
What does the user want to see
printed
on the printer, displayed on the
screen, or
stored in a file?
8.
INPUT PROCESS OUTPUT(IPO)
ANALYSIS
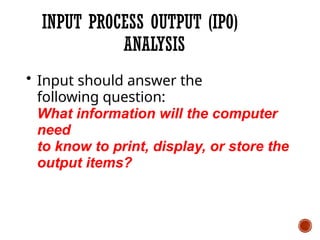
• Input should answer the
following question:
What information will the computer
need
to know to print, display, or store the
output items?
9.
INPUT PROCESS OUTPUT(IPO)
ANALYSIS
• Processing item:
An intermediate value that the
algorithm uses when processing the
input into the output
10.
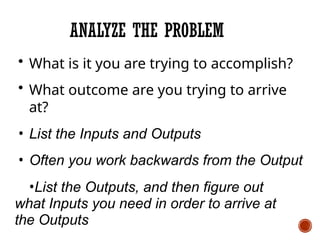
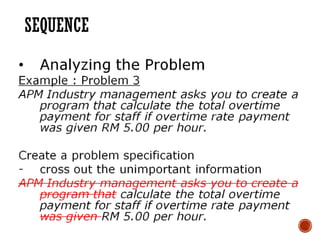
ANALYZE THE PROBLEM
•What is it you are trying to accomplish?
• What outcome are you trying to arrive
at?
• List the Inputs and Outputs
• Often you work backwards from the Output
•List the Outputs, and then figure out
what Inputs you need in order to arrive at
the Outputs
ANALYZE THE PROBLEM
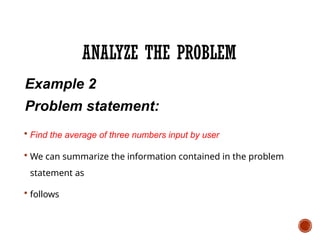
Example2
Problem statement:
Find the average of three numbers input by user
We can summarize the information contained in the problem
statement as
follows
16.
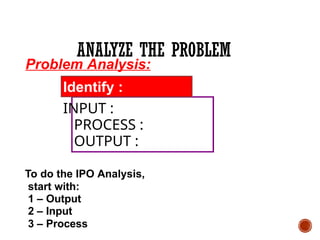
Problem Analysis:
Identify :
INPUT:
PROCESS :
OUTPUT :
To do the IPO Analysis,
start with:
1 – Output
2 – Input
3 – Process
ANALYZE THE PROBLEM
17.
ANALYZE THE PROBLEM
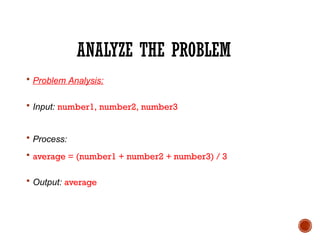
Problem Analysis:
Input: number1, number2, number3
Process:
average = (number1 + number2 + number3) / 3
Output: average
ANALYZE THE PROBLEM
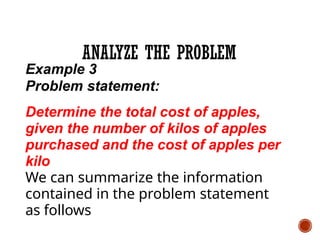
Example3
Problem statement:
Determine the total cost of apples,
given the number of kilos of apples
purchased and the cost of apples per
kilo
We can summarize the information
contained in the problem statement
as follows
20.
Problem Analysis:
Identify :
INPUT:
PROCESS :
OUTPUT :
To do the IPO Analysis,
start with:
1 – Output
2 – Input
3 – Process
ANALYZE THE PROBLEM
21.
ANALYZE THE PROBLEM
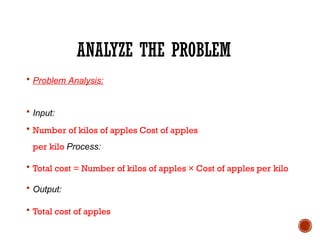
Problem Analysis:
Input:
Number of kilos of apples Cost of apples
per kilo Process:
Total cost = Number of kilos of apples × Cost of apples per kilo
Output:
Total cost of apples
22.
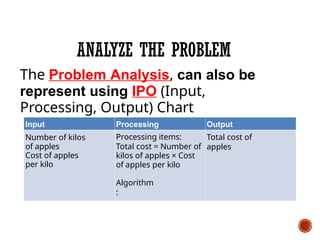
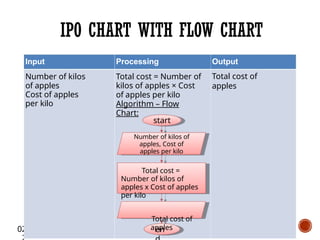
ANALYZE THE PROBLEM
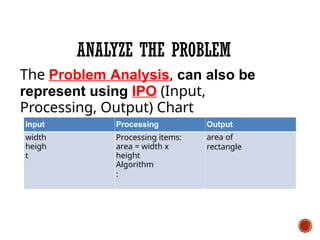
TheProblem Analysis, can also be
represent using IPO (Input,
Processing, Output) Chart
Input
Number of kilos
of apples
Cost of apples
per kilo
Processing
Processing items:
Total cost = Number of
kilos of apples × Cost
of apples per kilo
Algorithm
:
Output
Total cost of
apples
23.
SUMMARY
What have youlearned ?
• Approaches in problem solving
• Identify Input Process Output (IPO)
from a problem statement
ALGORITHM
• The algorithmis the abstract idea of
solving a problem.
• An algorithm is a step-by-step
instructions that will transform the
input into the output
• It can be represent using pseudocode
or flow chart
27.
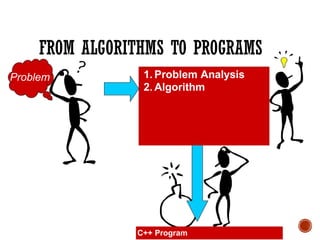
FROM ALGORITHMS TOPROGRAMS
Problem
C++ Program
1. Problem Analysis
2. Algorithm
28.
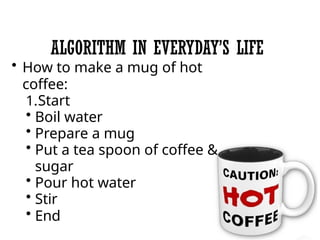
ALGORITHM IN EVERYDAY’SLIFE
• How to make a mug of hot
coffee:
1.Start
• Boil water
• Prepare a mug
• Put a tea spoon of coffee &
sugar
• Pour hot water
• Stir
• End
29.
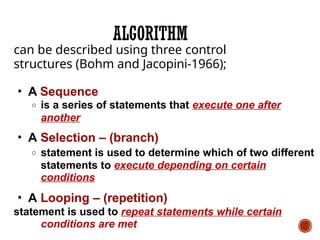
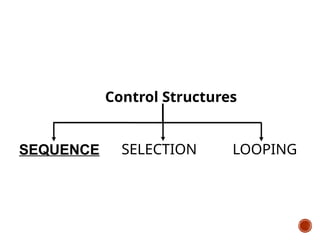
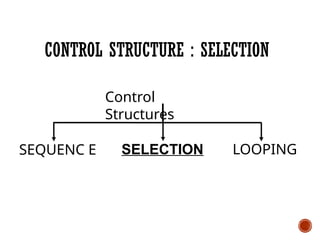
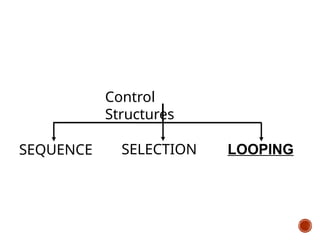
can be describedusing three control
structures (Bohm and Jacopini-1966);
• A Sequence
o is a series of statements that execute one after
another
• A Selection – (branch)
o statement is used to determine which of two different
statements to execute depending on certain
conditions
• A Looping – (repetition)
statement is used to repeat statements while certain
conditions are met
ALGORITHM
30.
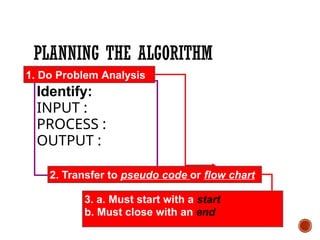
PLANNING THE ALGORITHM
2.Transfer to pseudo code or flow chart
3. a. Must start with a start
b. Must close with an end
1. Do Problem Analysis
Identify:
INPUT :
PROCESS :
OUTPUT :
31.
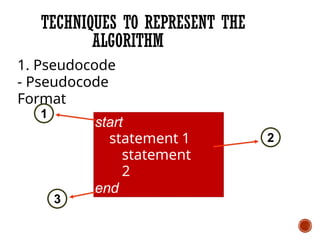
TECHNIQUES TO REPRESENTTHE
ALGORITHM
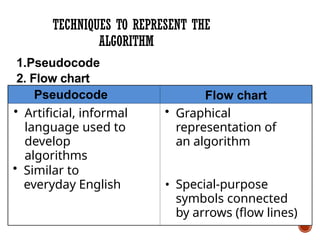
• Similar to
everyday English
Flow chart
• Graphical
representation of
an algorithm
• Special-purpose
symbols connected
by arrows (flow lines)
1.Pseudocode
2. Flow chart
• Artificial, informal
language used to
develop
algorithms
Pseudocode
32.
TECHNIQUES TO REPRESENTTHE
ALGORITHM
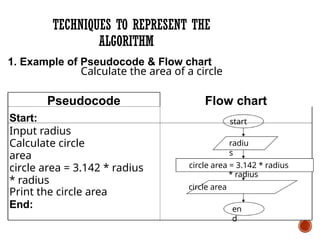
Pseudocode
Start:
Input radius
Calculate circle
area
circle area = 3.142 * radius
* radius
Print the circle area
End:
1. Example of Pseudocode & Flow chart
Calculate the area of a circle
radiu
s
circle area = 3.142 * radius
* radius
circle area
Flow chart
start
en
d
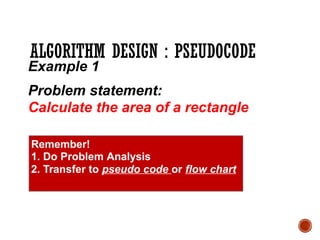
ALGORITHM DESIGN :PSEUDOCODE
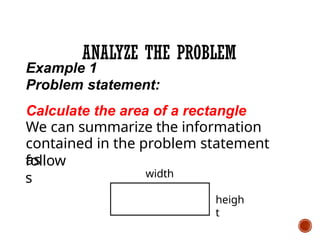
Example 1
Problem statement:
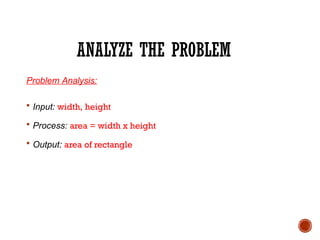
Calculate the area of a rectangle
Remember!
1. Do Problem Analysis
2. Transfer to pseudo code or flow chart
35.
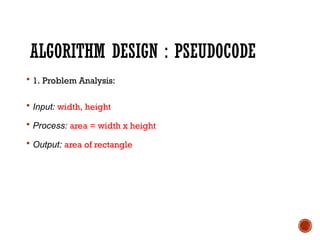
ALGORITHM DESIGN :PSEUDOCODE
1. Problem Analysis:
Input: width, height
Process: area = width x height
Output: area of rectangle
36.
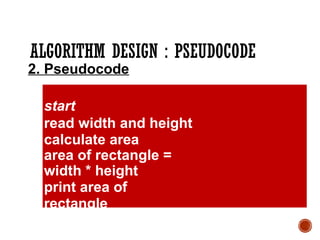
ALGORITHM DESIGN :PSEUDOCODE
2. Pseudocode
start
read width and height
calculate area
area of rectangle =
width * height
print area of
rectangle
end
37.
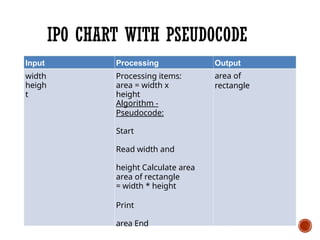
IPO CHART WITHPSEUDOCODE
Input
width
heigh
t
Processing
Processing items:
area = width x
height
Algorithm -
Pseudocode:
Start
Read width and
height Calculate area
area of rectangle
= width * height
Print
area End
Output
area of
rectangle
38.
ALGORITHM DESIGN :PSEUDOCODE
Example 2
Problem statement:
Find the average of three numbers input
by user
Remember!
1. Do Problem Analysis
2. Transfer to pseudo code or flow chart
39.
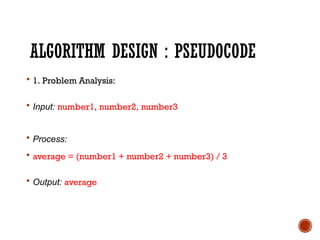
ALGORITHM DESIGN :PSEUDOCODE
1. Problem Analysis:
Input: number1, number2, number3
Process:
average = (number1 + number2 + number3) / 3
Output: average
40.
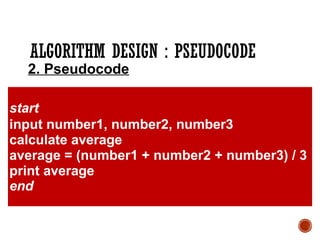
ALGORITHM DESIGN :PSEUDOCODE
start
input number1, number2, number3
calculate average
average = (number1 + number2 + number3) / 3
print average
end
2. Pseudocode
41.
02/10/1
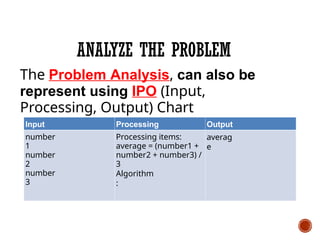
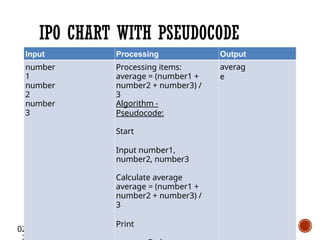
IPO CHART WITHPSEUDOCODE
Input
number
1
number
2
number
3
Processing
Processing items:
average = (number1 +
number2 + number3) /
3
Algorithm -
Pseudocode:
Start
Input number1,
number2, number3
Calculate average
average = (number1 +
number2 + number3) /
3
Print
Output
averag
e
42.
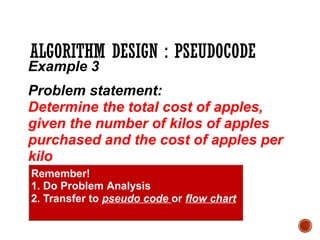
ALGORITHM DESIGN :PSEUDOCODE
Example 3
Problem statement:
Determine the total cost of apples,
given the number of kilos of apples
purchased and the cost of apples per
kilo
Remember!
1. Do Problem Analysis
2. Transfer to pseudo code or flow chart
43.
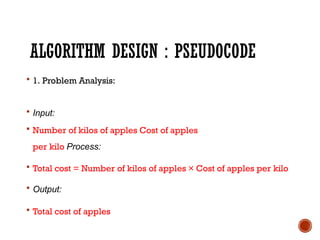
ALGORITHM DESIGN :PSEUDOCODE
1. Problem Analysis:
Input:
Number of kilos of apples Cost of apples
per kilo Process:
Total cost = Number of kilos of apples × Cost of apples per kilo
Output:
Total cost of apples
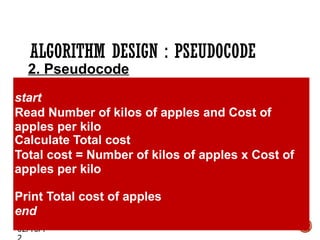
44.
02/10/1
ALGORITHM DESIGN :PSEUDOCODE
2. Pseudocode
start
Read Number of kilos of apples and Cost of
apples per kilo
Calculate Total cost
Total cost = Number of kilos of apples x Cost of
apples per kilo
Print Total cost of apples
end
45.
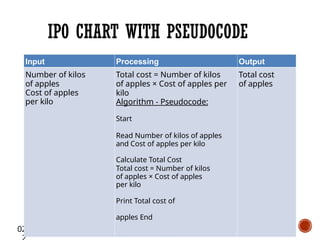
02/10/1
Input
Number of kilos
ofapples
Cost of apples
per kilo
Processing
Total cost = Number of kilos
of apples × Cost of apples per
kilo
Algorithm - Pseudocode:
Start
Read Number of kilos of apples
and Cost of apples per kilo
Calculate Total Cost
Total cost = Number of kilos
of apples × Cost of apples
per kilo
Print Total cost of
apples End
Output
Total cost
of apples
IPO CHART WITH PSEUDOCODE
46.
SUMMARY
What have youlearned ?
• Approaches in problem solving
• Planning the algorithm
• Steps in building pseudocode
• Problem solving using
pseudocode
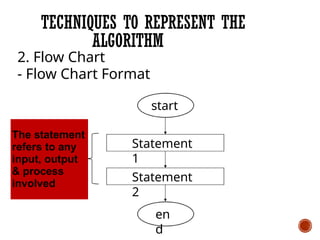
TECHNIQUES TO REPRESENTTHE
ALGORITHM
Statement
1
Statement
2
2. Flow Chart
- Flow Chart Format
start
The statement
refers to any
input, output
& process
involved
en
d
50.
02/10/1
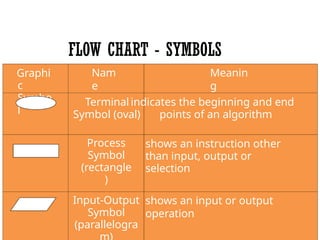
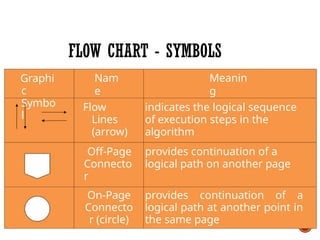
FLOW CHART -SYMBOLS
Graphi
c
Symbo
l
Nam
e
Meanin
g
Terminal indicates the beginning and end
Symbol (oval) points of an algorithm
Process
Symbol
(rectangle
)
shows an instruction other
than input, output or
selection
Input-Output
Symbol
(parallelogra
shows an input or output
operation
51.
02/10/1
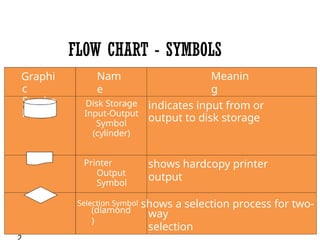
FLOW CHART -SYMBOLS
Graphi
c
Symbo
l
Nam
e
Meanin
g
Disk Storage
Input-Output
Symbol
(cylinder)
indicates input from or
output to disk storage
Printer
Output
Symbol
shows hardcopy printer
output
(diamond
)
Selection Symbol shows a selection process for two-
way
selection
52.
FLOW CHART -SYMBOLS
Graphi
c
Symbo
l
Nam
e
Meanin
g
Flow
Lines
(arrow)
indicates the logical sequence
of execution steps in the
algorithm
Off-Page
Connecto
r
provides continuation of a
logical path on another page
On-Page
Connecto
r (circle)
provides continuation of a
logical path at another point in
the same page
53.
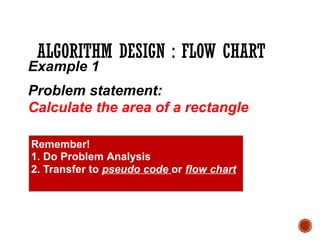
ALGORITHM DESIGN :FLOW CHART
Example 1
Problem statement:
Calculate the area of a rectangle
Remember!
1. Do Problem Analysis
2. Transfer to pseudo code or flow chart
54.
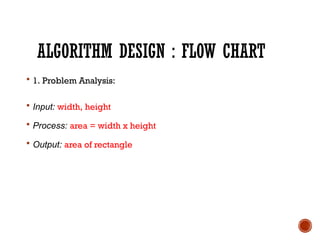
ALGORITHM DESIGN :FLOW CHART
1. Problem Analysis:
Input: width, height
Process: area = width x height
Output: area of rectangle
55.
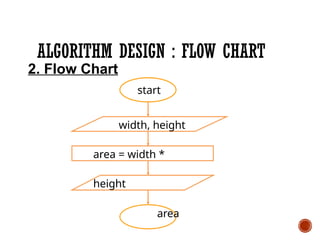
ALGORITHM DESIGN :FLOW CHART
2. Flow Chart
start
width, height
area = width *
height
area
56.
02/10/1
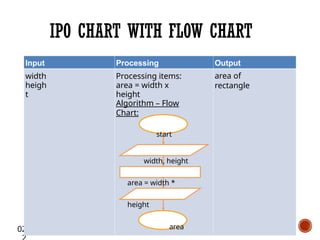
IPO CHART WITHFLOW CHART
Input
width
heigh
t
Processing
Processing items:
area = width x
height
Output
area of
rectangle
Algorithm – Flow
Chart:
start
width, height
area = width *
height
area
57.
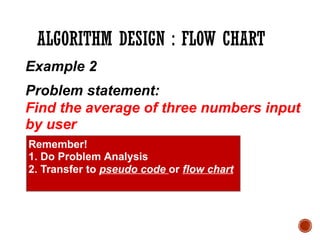
ALGORITHM DESIGN :FLOW CHART
Example 2
Problem statement:
Find the average of three numbers input
by user
Remember!
1. Do Problem Analysis
2. Transfer to pseudo code or flow chart
58.
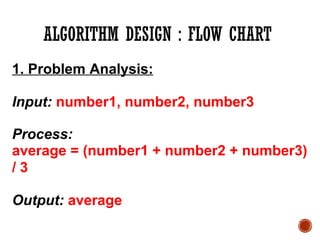
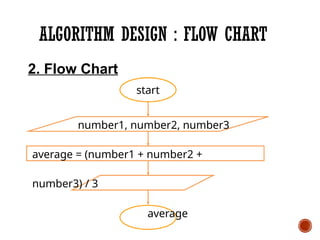
ALGORITHM DESIGN :FLOW CHART
1. Problem Analysis:
Input: number1, number2, number3
Process:
average = (number1 + number2 + number3)
/ 3
Output: average
02/10/1
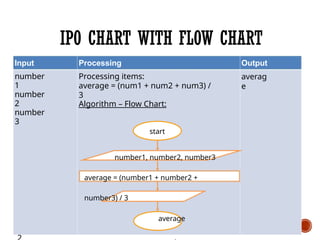
IPO CHART WITHFLOW CHART
Input
number
1
number
2
number
3
Processing
Processing items:
average = (num1 + num2 + num3) /
3
Output
averag
e
Algorithm – Flow Chart:
start
number1, number2, number3
average = (number1 + number2 +
number3) / 3
average
61.
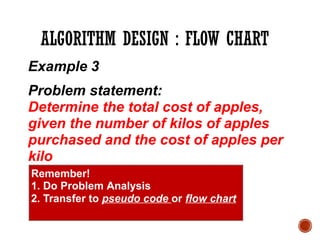
ALGORITHM DESIGN :FLOW CHART
Example 3
Problem statement:
Determine the total cost of apples,
given the number of kilos of apples
purchased and the cost of apples per
kilo
Remember!
1. Do Problem Analysis
2. Transfer to pseudo code or flow chart
62.
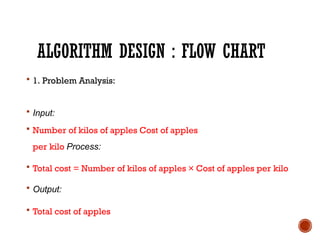
ALGORITHM DESIGN :FLOW CHART
1. Problem Analysis:
Input:
Number of kilos of apples Cost of apples
per kilo Process:
Total cost = Number of kilos of apples × Cost of apples per kilo
Output:
Total cost of apples
63.
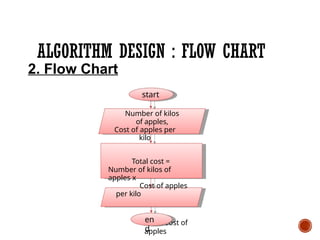
ALGORITHM DESIGN :FLOW CHART
Number of kilos
of apples,
Cost of apples per
kilo
Total cost =
Number of kilos of
apples x
Cost of apples
per kilo
Total cost of
apples
2. Flow Chart
start
en
d
64.
02/10/1
IPO CHART WITHFLOW CHART
Input
Number of kilos
of apples
Cost of apples
per kilo
Processing
Total cost = Number of
kilos of apples × Cost
of apples per kilo
Algorithm – Flow
Chart:
Output
Total cost of
apples
en
start
Number of kilos of
apples, Cost of
apples per kilo
Total cost =
Number of kilos of
apples x Cost of apples
per kilo
Total cost of
apples
65.
SUMMARY
What have youlearned ?
• Approaches in problem
solving
• Steps in building flow chart
• Problem solving using flow
chart
66.
REVISION
What have youlearned ?
• What is IPO analysis?
• What is algorithm?
• What are the steps in planning
your algorithm?
• Differentiate between
pseudocode and
flowchart.
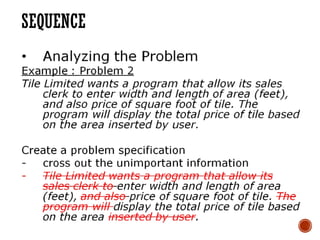
SEQUENCE
Learning Outcome
At theend of the lesson, students should be
able to :
1. Understand basic problem solving
techniques.
• Use the sequence structured in problem
solving.
• Develop flowchart through the process of
top-down.
70.
SEQUENCE
• The simplestprograms consist just sequence
of statements :
• no loops, no selections amongst alternative actions,
no use of subroutines.
71.
SEQUENCE
• Instruction insequence programming
are executed sequentially one by one
• The sequence structure directs the computer
to process the instructions, one after another,
in the order listed in the program.
first instruction last instruction.
SEQUENCE
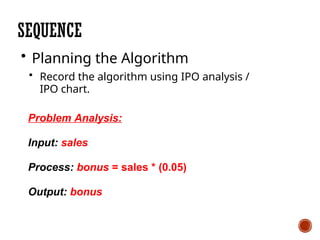
• Planning theAlgorithm
• Record the algorithm using IPO analysis /
IPO chart.
Problem Analysis:
Input: sales
Process: bonus = sales * (0.05)
Output: bonus
74.
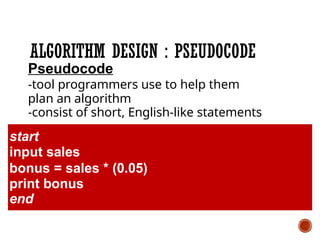
ALGORITHM DESIGN :PSEUDOCODE
Pseudocode
-tool programmers use to help them
plan an algorithm
-consist of short, English-like statements
start
input sales
bonus = sales * (0.05)
print bonus
end
75.
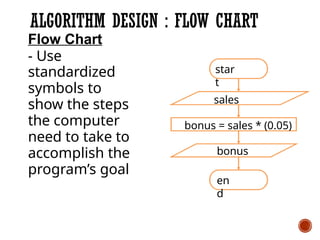
ALGORITHM DESIGN :FLOW CHART
Flow Chart
- Use
standardized
symbols to
show the steps
the computer
need to take to
accomplish the
program’s goal
star
t
en
d
sales
bonus = sales * (0.05)
bonus
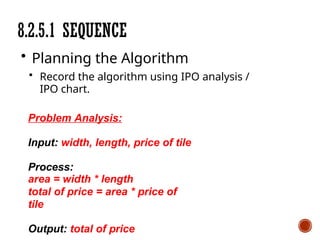
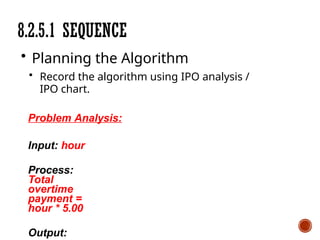
8.2.5.1 SEQUENCE
• Planningthe Algorithm
• Record the algorithm using IPO analysis /
IPO chart.
Problem Analysis:
Input: width, length, price of tile
Process:
area = width * length
total of price = area * price of
tile
Output: total of price
78.
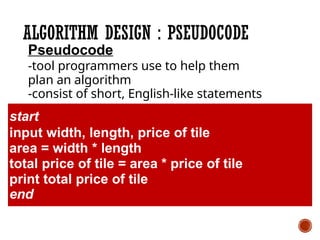
ALGORITHM DESIGN :PSEUDOCODE
Pseudocode
-tool programmers use to help them
plan an algorithm
-consist of short, English-like statements
start
input width, length, price of tile
area = width * length
total price of tile = area * price of tile
print total price of tile
end
79.
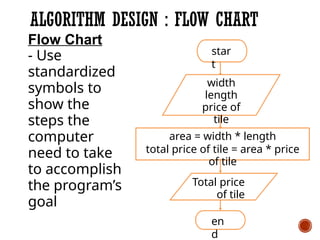
ALGORITHM DESIGN :FLOW CHART
star
t
en
d
width
length
price of
tile
area = width * length
total price of tile = area * price
of tile
Total price
of tile
Flow Chart
- Use
standardized
symbols to
show the
steps the
computer
need to take
to accomplish
the program’s
goal
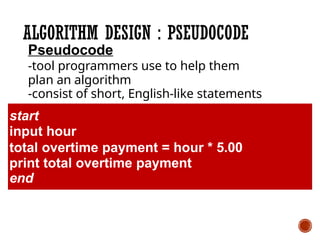
8.2.5.1 SEQUENCE
• Planningthe Algorithm
• Record the algorithm using IPO analysis /
IPO chart.
Problem Analysis:
Input: hour
Process:
Total
overtime
payment =
hour * 5.00
Output:
82.
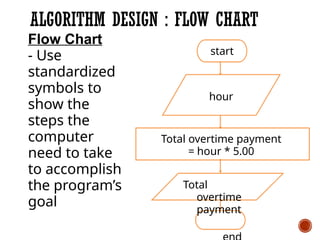
ALGORITHM DESIGN :PSEUDOCODE
Pseudocode
-tool programmers use to help them
plan an algorithm
-consist of short, English-like statements
start
input hour
total overtime payment = hour * 5.00
print total overtime payment
end
83.
ALGORITHM DESIGN :FLOW CHART
start
hour
Total overtime payment
= hour * 5.00
Total
overtime
payment
Flow Chart
- Use
standardized
symbols to
show the
steps the
computer
need to take
to accomplish
the program’s
goal
84.
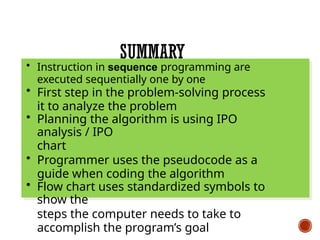
SUMMARY
• Instruction insequence programming are
executed sequentially one by one
• First step in the problem-solving process
it to analyze the problem
• Planning the algorithm is using IPO
analysis / IPO
chart
• Programmer uses the pseudocode as a
guide when coding the algorithm
• Flow chart uses standardized symbols to
show the
steps the computer needs to take to
accomplish the program’s goal
LEARNING OUTCOME
• Atthe end of this topic, students
should be able to:
a)explain the purpose of selection
control structure.
b)apply selection control
structure in problem solving.
87.
CONTROL STRUCTURE :SELECTION
SELECTION Analogy
You need to choose to make “Coffee O”
or “Milk Coffee”
CONTROL STRUCTURE :SELECTION
What is Selection Structure?
• The selection structure allows
instructions to be executed non-
sequentially.
• It allows the comparison of two
expressions, and based on the
comparison, to select certain course
of action.
90.
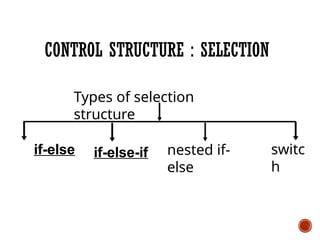
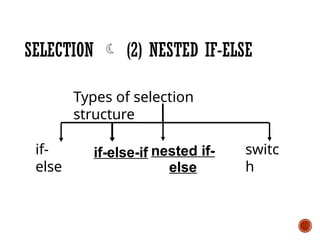
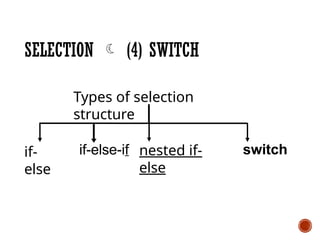
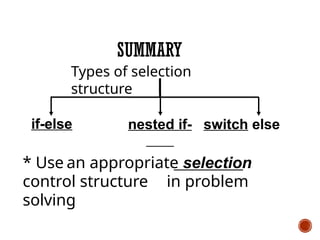
CONTROL STRUCTURE :SELECTION
if-else
Types of selection
structure
nested if-
else
switc
h
if-else-if
91.
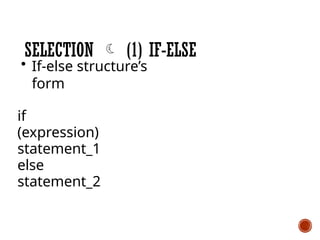
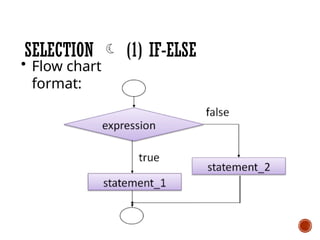
SELECTION (1)IF-ELSE
• If-else structure’s
form
if
(expression)
statement_1
else
statement_2
92.
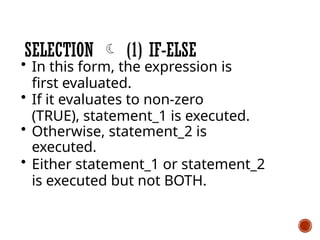
SELECTION (1)IF-ELSE
• In this form, the expression is
first evaluated.
• If it evaluates to non-zero
(TRUE), statement_1 is executed.
• Otherwise, statement_2 is
executed.
• Either statement_1 or statement_2
is executed but not BOTH.
93.
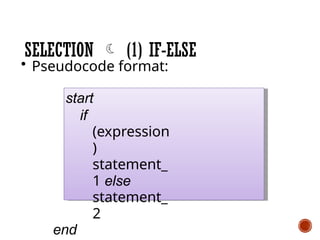
SELECTION (1)IF-ELSE
• Pseudocode format:
start
if
(expression
)
statement_
1 else
statement_
2
end
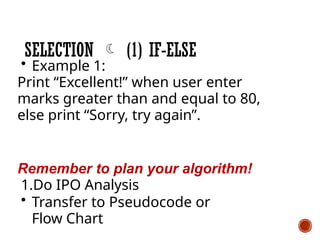
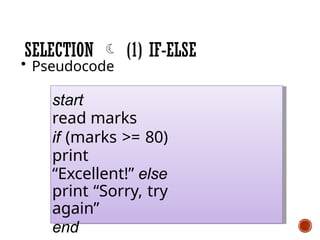
SELECTION (1)IF-ELSE
• Example 1:
Print “Excellent!” when user enter
marks greater than and equal to 80,
else print “Sorry, try again”.
Remember to plan your algorithm!
1.Do IPO Analysis
• Transfer to Pseudocode or
Flow Chart
96.
SELECTION (1)IF-ELSE
• Example 1:
Print “Excellent!” when user enter
marks greater than and equal to 80,
else print “Sorry, try again”.
97.
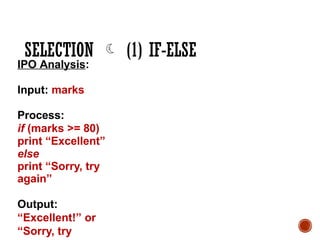
SELECTION (1)IF-ELSE
IPO Analysis:
Input: marks
Process:
if (marks >= 80)
print “Excellent”
else
print “Sorry, try
again”
Output:
“Excellent!” or
“Sorry, try
98.
SELECTION (1)IF-ELSE
• Pseudocode
start
read marks
if (marks >= 80)
print
“Excellent!” else
print “Sorry, try
again”
end
99.
en
d
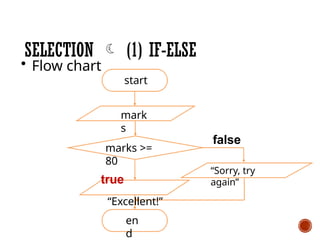
SELECTION (1)IF-ELSE
• Flow chart
start
mark
s
marks >=
80
true
“Excellent!”
“Sorry, try
again”
false
100.
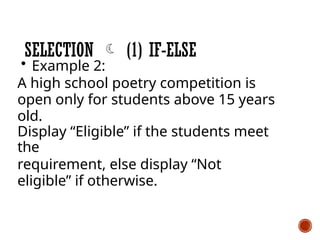
SELECTION (1)IF-ELSE
• Example 2:
A high school poetry competition is
open only for students above 15 years
old.
Display “Eligible” if the students meet
the
requirement, else display “Not
eligible” if otherwise.
101.
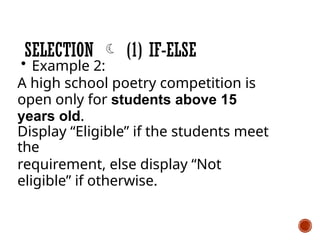
SELECTION (1)IF-ELSE
• Example 2:
A high school poetry competition is
open only for students above 15
years old.
Display “Eligible” if the students meet
the
requirement, else display “Not
eligible” if otherwise.
102.
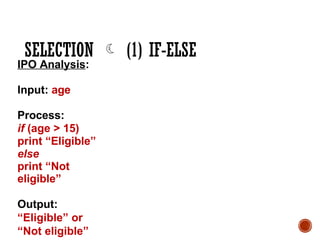
SELECTION (1)IF-ELSE
IPO Analysis:
Input: age
Process:
if (age > 15)
print “Eligible”
else
print “Not
eligible”
Output:
“Eligible” or
“Not eligible”
103.
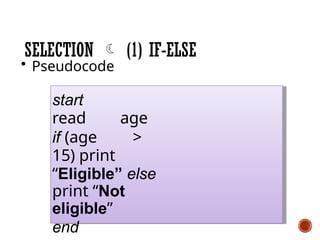
SELECTION (1)IF-ELSE
• Pseudocode
start
read age
if (age >
15) print
“Eligible” else
print “Not
eligible”
end
104.
en
d
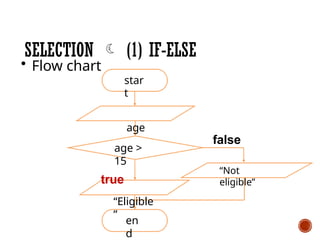
SELECTION (1)IF-ELSE
• Flow chart
star
t
age
age >
15
true
“Eligible
”
“Not
eligible”
false
105.
SELECTION (1)IF-ELSE
• Example 3:
If x is greater than y, display “x is
bigger than y” else display “x is
smaller than y”.
106.
SELECTION (1)IF-ELSE
• Example 3:
If x is greater than y, display “x is
bigger than y” else display “x is smaller
than y”.
107.
SELECTION (1)IF-ELSE
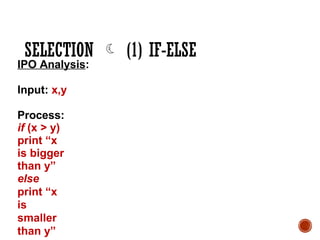
IPO Analysis:
Input: x,y
Process:
if (x > y)
print “x
is bigger
than y”
else
print “x
is
smaller
than y”
108.
SELECTION (1)IF-ELSE
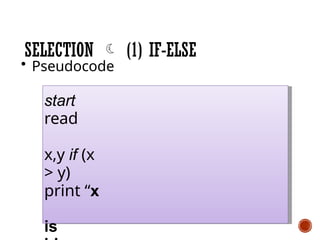
• Pseudocode
start
read
x,y if (x
> y)
print “x
is
109.
en
d
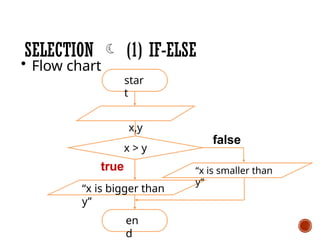
SELECTION (1)IF-ELSE
• Flow chart
star
t
x,y
x > y
true
“x is bigger than
y”
“x is smaller than
y”
false
110.
SELECTION (2)NESTED IF-ELSE
if-
else
Types of selection
structure
nested if-
else
switc
h
if-else-if
111.
SELECTION (2)IF-ELSE…IF
• The if-else structure can also be nested
to any depth.
112.
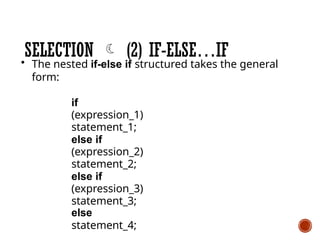
SELECTION (2)IF-ELSE…IF
• The nested if-else if structured takes the general
form:
if
(expression_1)
statement_1;
else if
(expression_2)
statement_2;
else if
(expression_3)
statement_3;
else
statement_4;
113.
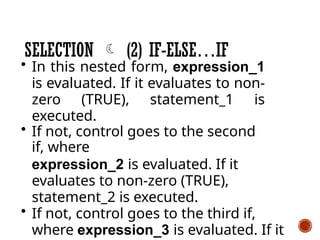
• In thisnested form, expression_1
is evaluated. If it evaluates to non-
zero (TRUE), statement_1 is
executed.
• If not, control goes to the second
if, where
expression_2 is evaluated. If it
evaluates to non-zero (TRUE),
statement_2 is executed.
• If not, control goes to the third if,
where expression_3 is evaluated. If it
SELECTION (2) IF-ELSE…IF
114.
SELECTION (2)IF-ELSE…IF
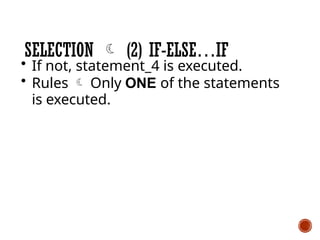
• If not, statement_4 is executed.
• Rules Only ONE of the statements
is executed.
115.
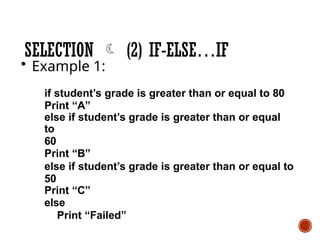
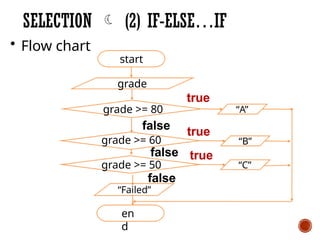
SELECTION (2)IF-ELSE…IF
• Example 1:
if student’s grade is greater than or equal to 80
Print “A”
else if student’s grade is greater than or equal
to
60
Print “B”
else if student’s grade is greater than or equal to
50
Print “C”
else
Print “Failed”
116.
SELECTION (2)IF-ELSE…IF
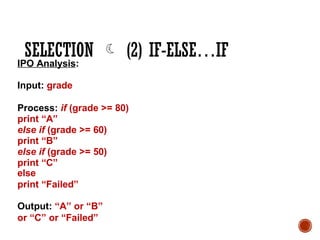
IPO Analysis:
Input: grade
Process: if (grade >= 80)
print “A”
else if (grade >= 60)
print “B”
else if (grade >= 50)
print “C”
else
print “Failed”
Output: “A” or “B”
or “C” or “Failed”
117.
SELECTION (2)IF-ELSE…IF
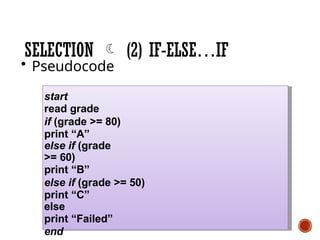
• Pseudocode
start
read grade
if (grade >= 80)
print “A”
else if (grade
>= 60)
print “B”
else if (grade >= 50)
print “C”
else
print “Failed”
end
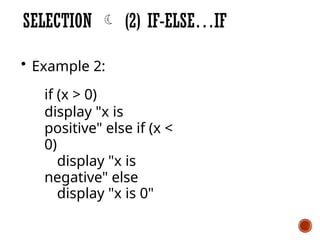
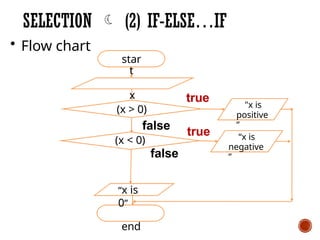
SELECTION (2)IF-ELSE…IF
• Example 2:
if (x > 0)
display "x is
positive" else if (x <
0)
display "x is
negative" else
display "x is 0"
120.
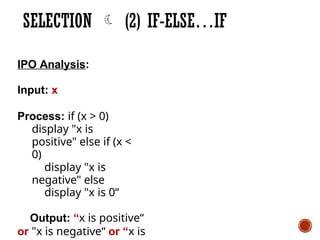
SELECTION (2)IF-ELSE…IF
IPO Analysis:
Input: x
Process: if (x > 0)
display "x is
positive" else if (x <
0)
display "x is
negative" else
display "x is 0“
Output: “x is positive“
or "x is negative“ or “x is
121.
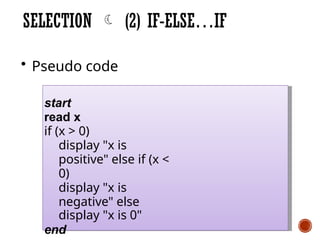
SELECTION (2)IF-ELSE…IF
• Pseudo code
start
read x
if (x > 0)
display "x is
positive" else if (x <
0)
display "x is
negative" else
display "x is 0"
end
122.
SELECTION (2)IF-ELSE…IF
• Flow chart
star
t
x true "x is
positive
”
“x is
negative
”
(x > 0)
false
(x < 0)
false
“x is
0”
end
true
123.
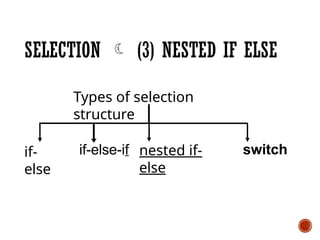
SELECTION (3)NESTED IF ELSE
if-
else
Types of selection
structure
nested if-
else
switch
if-else-if
124.
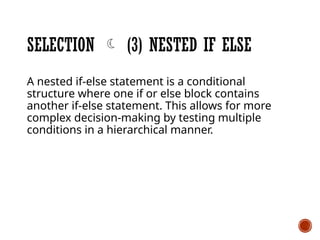
SELECTION (3)NESTED IF ELSE
A nested if-else statement is a conditional
structure where one if or else block contains
another if-else statement. This allows for more
complex decision-making by testing multiple
conditions in a hierarchical manner.
125.
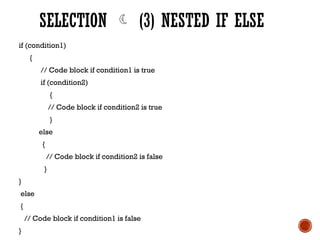
if (condition1)
{
// Codeblock if condition1 is true
if (condition2)
{
// Code block if condition2 is true
}
else
{
// Code block if condition2 is false
}
}
else
{
// Code block if condition1 is false
}
SELECTION (3) NESTED IF ELSE
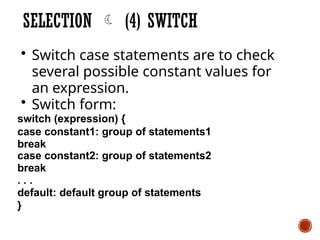
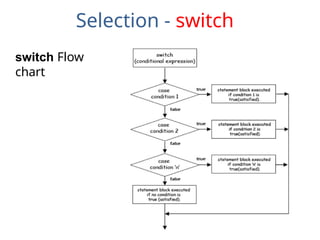
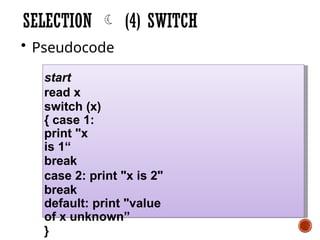
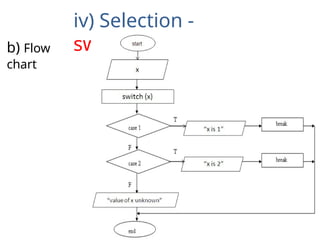
SELECTION (4)SWITCH
• Switch case statements are to check
several possible constant values for
an expression.
• Switch form:
switch (expression) {
case constant1: group of statements1
break
case constant2: group of statements2
break
. . .
default: default group of statements
}
128.
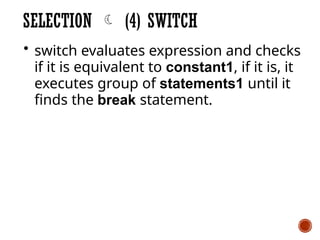
SELECTION (4)SWITCH
• switch evaluates expression and checks
if it is equivalent to constant1, if it is, it
executes group of statements1 until it
finds the break statement.
129.
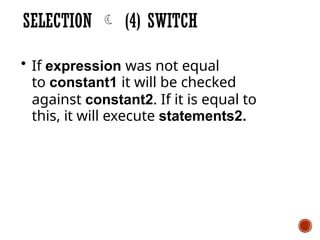
SELECTION (4)SWITCH
• If expression was not equal
to constant1 it will be checked
against constant2. If it is equal to
this, it will execute statements2.
130.
SELECTION (4)SWITCH
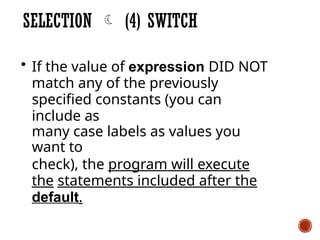
• If the value of expression DID NOT
match any of the previously
specified constants (you can
include as
many case labels as values you
want to
check), the program will execute
the statements included after the
default.
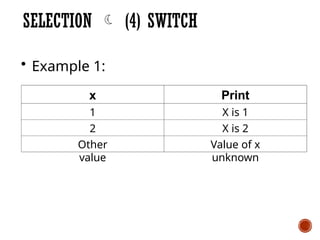
SELECTION (4)SWITCH
• Example 1:
x
1
2
Other
value
Print
X is 1
X is 2
Value of x
unknown
133.
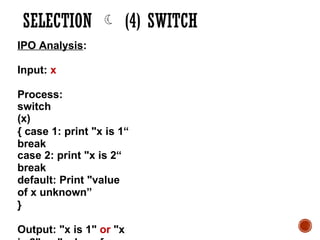
SELECTION (4)SWITCH
IPO Analysis:
Input: x
Process:
switch
(x)
{ case 1: print "x is 1“
break
case 2: print "x is 2“
break
default: Print "value
of x unknown”
}
Output: "x is 1" or "x
134.
SELECTION (4)SWITCH
• Pseudocode
start
read x
switch (x)
{ case 1:
print "x
is 1“
break
case 2: print "x is 2"
break
default: print "value
of x unknown”
}
LEARNING OUTCOME
At theend of this topic, students should be
able to:
• explain the purpose of looping control
structure.
• apply looping control structure in
problem solving.
140.
WHAT IS LOOPINGCONTROL
STRUCTURE?
• The looping (or repetition) structure allows
a sequence of instructions to be executed
repeatedly until a certain condition is
reached.
• The looping structure has three forms:
o while
o do..while
o for
141.
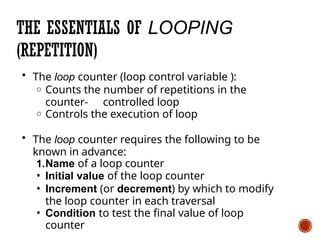
THE ESSENTIALS OFLOOPING
(REPETITION)
• The loop counter (loop control variable ):
o Counts the number of repetitions in the
counter- controlled loop
o Controls the execution of loop
• The loop counter requires the following to be
known in advance:
1.Name of a loop counter
• Initial value of the loop counter
• Increment (or decrement) by which to modify
the loop counter in each traversal
• Condition to test the final value of loop
counter
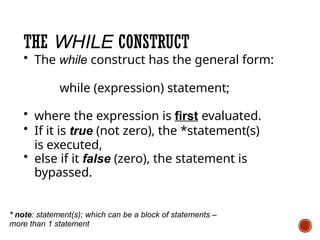
THE WHILE CONSTRUCT
•The while construct has the general form:
while (expression) statement;
• where the expression is first evaluated.
• If it is true (not zero), the *statement(s)
is executed,
• else if it false (zero), the statement is
bypassed.
* note: statement(s); which can be a block of statements –
more than 1 statement
144.
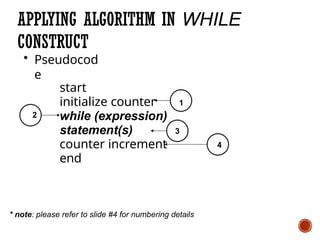
APPLYING ALGORITHM INWHILE
CONSTRUCT
• Pseudocod
e
start
initialize counter
while (expression)
statement(s)
counter increment
end
1
2
4
3
* note: please refer to slide #4 for numbering details
145.
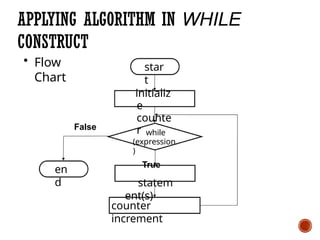
APPLYING ALGORITHM INWHILE
CONSTRUCT
• Flow
Chart
star
t
initializ
e
counte
r while
(expression
)
True
statem
ent(s)
counter
increment
False
en
d
146.
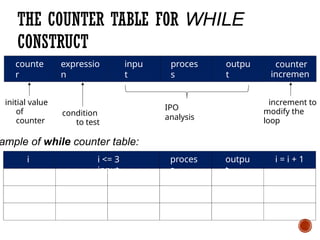
THE COUNTER TABLEFOR WHILE
CONSTRUCT
counte
r
expressio
n
inpu
t
proces
s
outpu
t
counter
incremen
t
initial value
of
counter
condition
to test
IPO
analysis
increment to
modify the
loop
proces
s
outpu
t
i = i + 1
ample of while counter table:
i i <= 3
input
147.
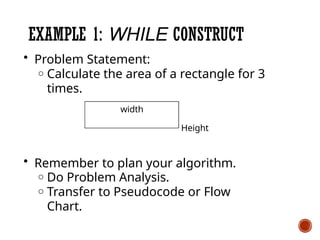
EXAMPLE 1: WHILECONSTRUCT
• Problem Statement:
o Calculate the area of a rectangle for 3
times.
width
Height
• Remember to plan your algorithm.
o Do Problem Analysis.
o Transfer to Pseudocode or Flow
Chart.
148.
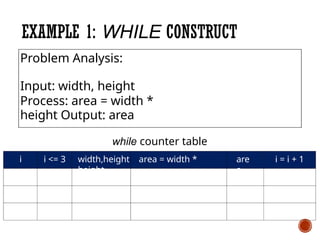
i i <=3 are
a
i = i + 1
while counter table
width,height area = width *
height
EXAMPLE 1: WHILE CONSTRUCT
Problem Analysis:
Input: width, height
Process: area = width *
height Output: area
149.
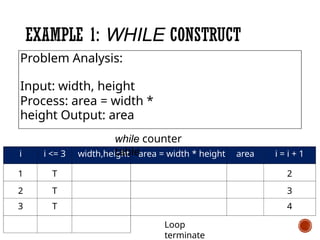
i i <=3 width,height area = width * height area i = i + 1
1 T 2
2 T 3
3 T 4
Loop
terminate
EXAMPLE 1: WHILE CONSTRUCT
Problem Analysis:
Input: width, height
Process: area = width *
height Output: area
while counter
table
150.
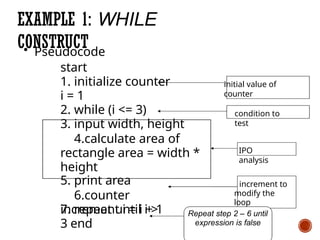
• Pseudocode
start
1. initializecounter
i = 1
2. while (i <= 3)
3. input width, height
4.calculate area of
rectangle area = width *
height
5. print area
6.counter
increment i = i + 1
EXAMPLE 1: WHILE
CONSTRUCT
7. repeat until i >
3 end
IPO
analysis
initial value of
counter
condition to
test
increment to
modify the
loop
Repeat step 2 – 6 until
expression is false
151.
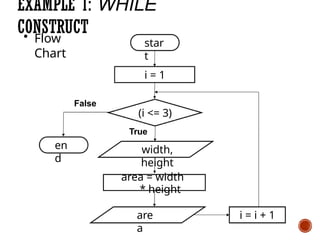
• Flow
Chart
EXAMPLE 1:WHILE
CONSTRUCT
star
t
(i <= 3)
True
width,
height
i = i + 1
i = 1
False
en
d
area = width
* height
are
a
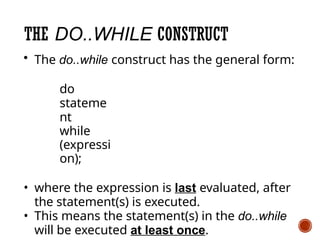
THE DO..WHILE CONSTRUCT
•The do..while construct has the general form:
do
stateme
nt
while
(expressi
on);
• where the expression is last evaluated, after
the statement(s) is executed.
• This means the statement(s) in the do..while
will be executed at least once.
154.
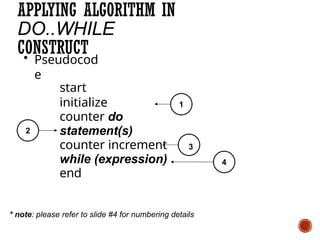
APPLYING ALGORITHM IN
DO..WHILE
CONSTRUCT
•Pseudocod
e
start
initialize
counter do
statement(s)
counter increment
while (expression)
end
1
2
4
3
* note: please refer to slide #4 for numbering details
155.
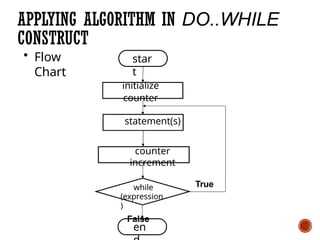
APPLYING ALGORITHM INDO..WHILE
CONSTRUCT
• Flow
Chart
star
t
True
initialize
counter
statement(s)
counter
increment
while
(expression
)
False
en
156.
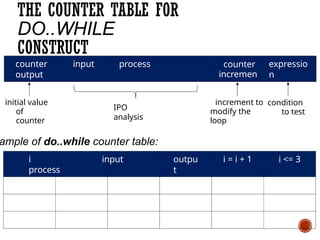
THE COUNTER TABLEFOR
DO..WHILE
CONSTRUCT
counter input process
output
counter
incremen
t
expressio
n
initial value
of
counter
condition
to test
IPO
analysis
increment to
modify the
loop
outpu
t
i = i + 1 i <= 3
ample of do..while counter table:
i input
process
157.
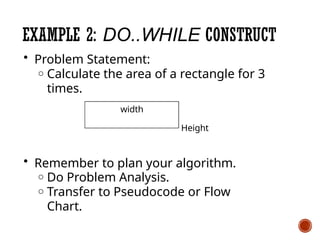
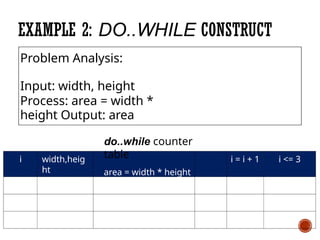
EXAMPLE 2: DO..WHILECONSTRUCT
• Problem Statement:
o Calculate the area of a rectangle for 3
times.
width
Height
• Remember to plan your algorithm.
o Do Problem Analysis.
o Transfer to Pseudocode or Flow
Chart.
158.
i width,heig
ht
i =i + 1 i <= 3
do..while counter
table
area = width * height
area
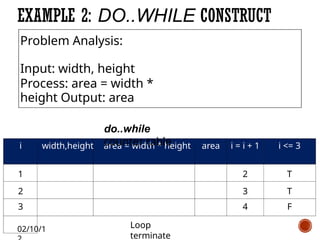
EXAMPLE 2: DO..WHILE CONSTRUCT
Problem Analysis:
Input: width, height
Process: area = width *
height Output: area
159.
02/10/1
i width,height area= width * height area i = i + 1 i <= 3
1 2 T
2 3 T
3 4 F
Loop
terminate
EXAMPLE 2: DO..WHILE CONSTRUCT
Problem Analysis:
Input: width, height
Process: area = width *
height Output: area
do..while
counter table
160.
02/10/1
• Pseudocod
e
start
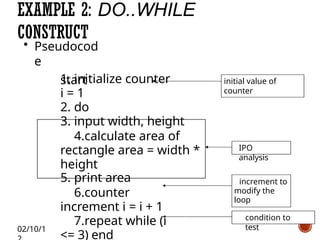
EXAMPLE 2:DO..WHILE
CONSTRUCT
1. initialize counter
i = 1
2. do
3. input width, height
4.calculate area of
rectangle area = width *
height
5. print area
6.counter
increment i = i + 1
7.repeat while (i
<= 3) end
IPO
analysis
initial value of
counter
condition to
test
increment to
modify the
loop
161.
02/1 /
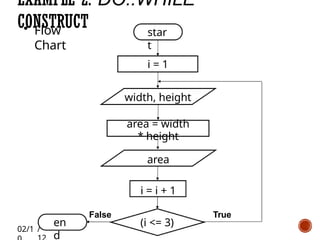
• Flow
Chart
EXAMPLE2: DO..WHILE
CONSTRUCT star
t
(i <= 3)
True
False
en
d
i = 1
width, height
area = width
* height
area
i = i + 1
* n0o2t/e1:0s/1ta2tement(s); whichcan be a block of
statements – more than 1 statement
THE FOR
CONSTRUCT
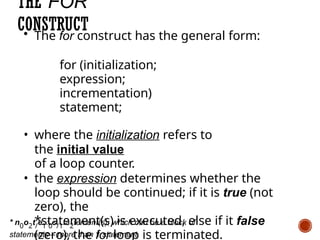
• The for construct has the general form:
for (initialization;
expression;
incrementation)
statement;
• where the initialization refers to
the initial value
of a loop counter.
• the expression determines whether the
loop should be continued; if it is true (not
zero), the
*statement(s) is executed, else if it false
(zero), the for loop is terminated.
164.
* note: pleaserefer to slide #4 for numbering details
02/10/12
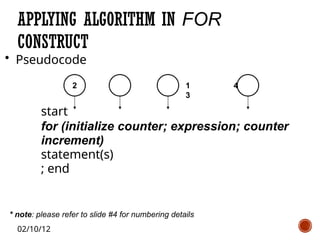
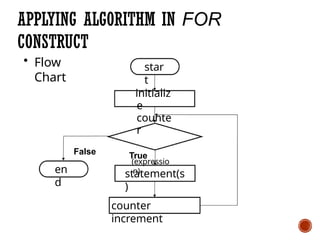
APPLYING ALGORITHM IN FOR
CONSTRUCT
• Pseudocode
2 1 4
3
start
for (initialize counter; expression; counter
increment)
statement(s)
; end
165.
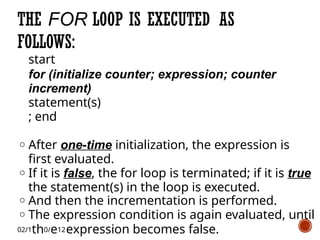
start
for (initialize counter;expression; counter
increment)
statement(s)
; end
o After one-time initialization, the expression is
first evaluated.
o If it is false, the for loop is terminated; if it is true
the statement(s) in the loop is executed.
o And then the incrementation is performed.
o The expression condition is again evaluated, until
02/1th0/e12expression becomes false.
THE FOR LOOP IS EXECUTED AS
FOLLOWS:
166.
APPLYING ALGORITHM INFOR
CONSTRUCT
• Flow
Chart
star
t
True
statement(s
)
counter
increment
initializ
e
counte
r
False
(expressio
n)
en
d
167.
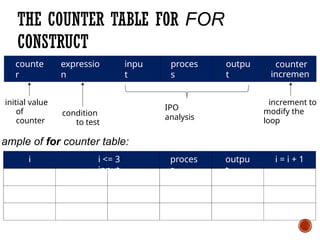
THE COUNTER TABLEFOR FOR
CONSTRUCT
counte
r
expressio
n
inpu
t
proces
s
outpu
t
counter
incremen
t
initial value
of
counter
condition
to test
IPO
analysis
increment to
modify the
loop
proces
s
outpu
t
i = i + 1
ample of for counter table:
i i <= 3
input
168.
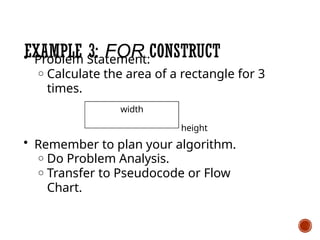
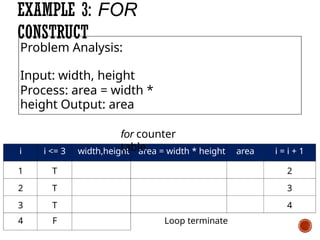
EXAMPLE 3: FORCONSTRUCT
• Problem Statement:
o Calculate the area of a rectangle for 3
times.
width
height
• Remember to plan your algorithm.
o Do Problem Analysis.
o Transfer to Pseudocode or Flow
Chart.
169.
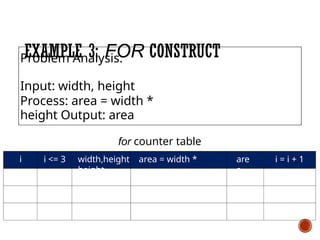
i i <=3 are
a
i = i + 1
for counter table
width,height area = width *
height
EXAMPLE 3: FOR CONSTRUCT
Problem Analysis:
Input: width, height
Process: area = width *
height Output: area
170.
i i <=3 width,height area = width * height area i = i + 1
1 T 2
2 T 3
3 T 4
4 F Loop terminate
EXAMPLE 3: FOR
CONSTRUCT
Problem Analysis:
Input: width, height
Process: area = width *
height Output: area
for counter
table
171.
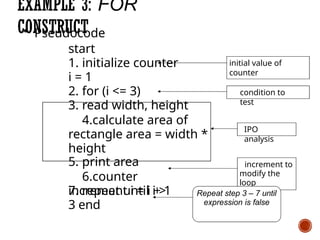
EXAMPLE 3: FOR
CONSTRUCT
•Pseudocode
start
1. initialize counter
i = 1
2. for (i <= 3)
3. read width, height
4.calculate area of
rectangle area = width *
height
5. print area
6.counter
increment i = i + 1
7. repeat until i >
3 end
IPO
analysis
initial value of
counter
condition to
test
increment to
modify the
loop
Repeat step 3 – 7 until
expression is false
172.
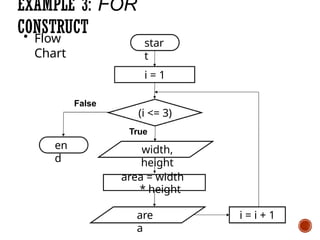
• Flow
Chart
EXAMPLE 3:FOR
CONSTRUCT
star
t
(i <= 3)
True
width,
height
i = i + 1
i = 1
False
en
d
area = width
* height
are
a
173.
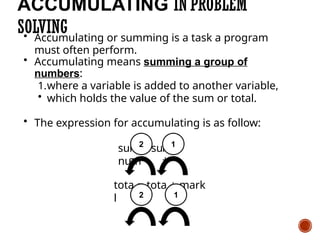
ACCUMULATING IN PROBLEM
SOLVING
•Accumulating or summing is a task a program
must often perform.
• Accumulating means summing a group of
numbers:
1.where a variable is added to another variable,
• which holds the value of the sum or total.
• The expression for accumulating is as follow:
m
=
m
+
su su
num
tota
l
= tota
l
+ mark
s
2 1
2 1
174.
Solving?
HOW TO APPLYACCUMULATING IN
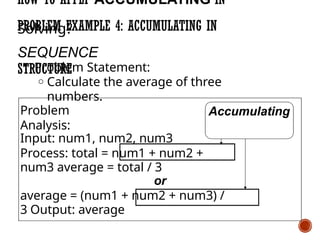
PROBLEM EXAMPLE 4: ACCUMULATING IN
SEQUENCE
STRUCTURE
• Problem Statement:
o Calculate the average of three
numbers.
Problem
Analysis:
Input: num1, num2, num3
Process: total = num1 + num2 +
num3 average = total / 3
or
average = (num1 + num2 + num3) /
3 Output: average
Accumulating
175.
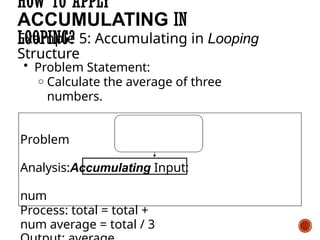
HOW TO APPLY
ACCUMULATINGIN
LOOPING?
Example 5: Accumulating in Looping
Structure
• Problem Statement:
o Calculate the average of three
numbers.
Problem
Analysis:Accumulating Input:
num
Process: total = total +
num average = total / 3
176.
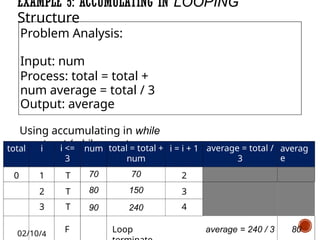
EXAMPLE 5: ACCUMULATINGIN LOOPING
Structure
Problem Analysis:
Input: num
Process: total = total +
num average = total / 3
Output: average
Using accumulating in while
construct (while counter
table)
total i i <=
3
num total = total +
num
i = i + 1 average = total /
3
averag
e
0 1 T 70 70 2
2 T 80 150 3
3 T 90 240 4
02/10/4
F Loop average = 240 / 3 80
177.
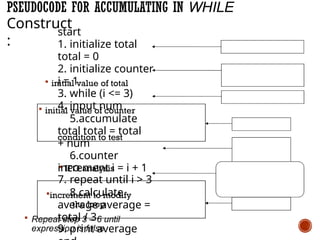
PSEUDOCODE FOR ACCUMULATINGIN WHILE
initial value of total
initial value of counter
condition to test
IPO analysis
increment to modify
the loop
Repeat step 3 – 6 until
expression is false
Construct
:
start
1. initialize total
total = 0
2. initialize counter
i = 1
3. while (i <= 3)
4. input num
5.accumulate
total total = total
+ num
6.counter
increment i = i + 1
7. repeat until i > 3
8.calculate
average average =
total / 3
9. print average
178.
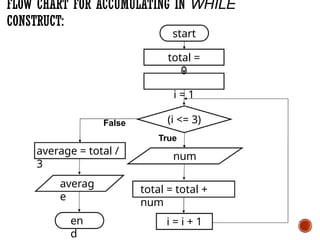
FLOW CHART FORACCUMULATING IN WHILE
CONSTRUCT:
(i <= 3)
True
num
en
d
total = total +
num
i = i + 1
start
total =
0
i = 1
False
average = total /
3
averag
e
179.
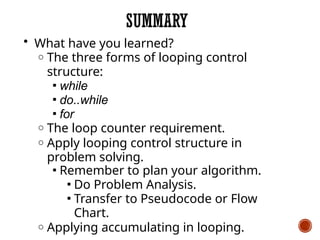
SUMMARY
• What haveyou learned?
o The three forms of looping control
structure:
▪ while
▪ do..while
▪ for
o The loop counter requirement.
o Apply looping control structure in
problem solving.
▪ Remember to plan your algorithm.
▪ Do Problem Analysis.
▪ Transfer to Pseudocode or Flow
Chart.
o Applying accumulating in looping.