Problem Set Week One
All statistical calculations will use Employee Salary Data Set
1. Using the Excel Analysis ToolPak function descriptive statistics, generate and show the descriptive
statistics for each appropriate variable in the sample data set.
1. For which variables in the data set does this function not work correctly for? Why?
2. Sort the data by Gen or Gen 1 (into males and females) and find the mean and standard deviation
for each gender for the following variables:
1. sal, compa, age, sr and raise. Use either the descriptive stats function or the Fx functions (average and stdev).
3. What is the probability for a:
1. Randomly selected person being a male in grade E?
2. Randomly selected male being in grade E?
3. Why are the results different?
4. Find:
1. The z score for each male salary, based on only the male salaries.
2. The z score for each female salary, based on only the female salaries.
3. The z score for each female compa, based on only the female compa values.
4. The z score for each male compa, based on only the male compa values.
5. What do the distributions and spread suggest about male and female salaries?
6. Why might we want to use compa to measure salaries between males and females?
5. Based on this sample, what conclusions can you make about the issue of male and female pay equality?
6. Are all of the results consistent with your conclusion? If not, why not?
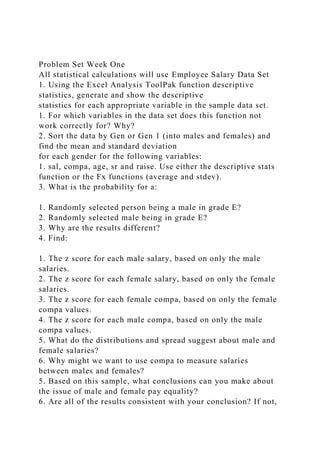
ID
Sal
Compa
Mid
Age
EES
SER
G
Raise
Deg
Gen1
Gr
1
58
1.017
57
34
85
8
0
5.7
0
M
E
The ongoing question that the weekly
assignments will focus on is:
Are males and females paid the same
for equal work
(under the Equal Pay Act)?
2
27
0.870
31
52
80
7
0
3.9
0
M
B
Note: to simplfy the analysis,
we will assume that jobs within
each grade comprise equal work.
3
34
1.096
31
30
75
5
1
3.6
1
F
B
4
66
1.157
57
42
100
16
0
5.5
1
M
E
The column labels in the table mean:
5
47
0.979
48
36
90
16
0
5.7
1
M
D
ID – Employee sample number
Sal – Salary in thousands
6
76
1.134
67
36
70
12
0
4.5
1
M
F
Age – Age in years
EES – Appraisal rating (Employee evaluation score)
7
41
1.025
40
32
100
8
1
5.7
1
F
C
SER – Years of service
G – Gender (0 = male, 1 = female)
8
23
1.000
23
32
90
9
1
5.8
1
F
A
Mid – salary grade midpoint
Raise – percent of last raise
9
77
1.149
67
49
100
10
0
4
1
M
F
Grade – job/pay grade
Deg (0= BS\BA 1 = MS)
10
22
0.956
23
30
80
7
1
4.7
1
F
A
Gen1 (Male or Female)
Compa - salary divided by midpoint, a measure of salary that removes the impact of grade
11
23
1.000
23
41
100
19
1
4.8
1
F
A
12
60
1.052
57
52
95
22
0
4.5
0
M
E
This data should be treated as
a sample of employees taken
from a company that has about 1,000
13
42
1.050
40
30
100
2
1
4.7
0
F
C
employees using
a random sampling approach.
14
24
1.043
23
32
90
12
1
6
1
F
A
15
24
1.043
23
32
80
8
1
4.9
1
F
A
16
47
1.175
40
44
90
4
0
5.7
0
M
C
Mac Users: The
homework in ...
Making communications land - Are they received and understood as intended? we...
Problem Set Week OneAll statistical calculations will use Employ.docx
1. Problem Set Week One
All statistical calculations will use Employee Salary Data Set
1. Using the Excel Analysis ToolPak function descriptive
statistics, generate and show the descriptive
statistics for each appropriate variable in the sample data set.
1. For which variables in the data set does this function not
work correctly for? Why?
2. Sort the data by Gen or Gen 1 (into males and females) and
find the mean and standard deviation
for each gender for the following variables:
1. sal, compa, age, sr and raise. Use either the descriptive stats
function or the Fx functions (average and stdev).
3. What is the probability for a:
1. Randomly selected person being a male in grade E?
2. Randomly selected male being in grade E?
3. Why are the results different?
4. Find:
1. The z score for each male salary, based on only the male
salaries.
2. The z score for each female salary, based on only the female
salaries.
3. The z score for each female compa, based on only the female
compa values.
4. The z score for each male compa, based on only the male
compa values.
5. What do the distributions and spread suggest about male and
female salaries?
6. Why might we want to use compa to measure salaries
between males and females?
5. Based on this sample, what conclusions can you make about
the issue of male and female pay equality?
6. Are all of the results consistent with your conclusion? If not,
3. 52
80
7
0
3.9
0
M
B
Note: to simplfy the analysis,
we will assume that jobs within
each grade comprise equal work.
3
34
1.096
31
30
75
5
1
3.6
1
F
B
4
66
6. 5.7
1
F
C
SER – Years of service
G – Gender (0 = male, 1 = female)
8
23
1.000
23
32
90
9
1
5.8
1
F
A
Mid – salary grade midpoint
Raise – percent of last raise
8. Compa - salary divided by midpoint, a measure of salary that
removes the impact of grade
11
23
1.000
23
41
100
19
1
4.8
1
F
A
12
60
1.052
57
52
9. 95
22
0
4.5
0
M
E
This data should be treated as
a sample of employees taken
from a company that has about 1,000
13
42
1.050
40
30
100
2
1
4.7
0
F
C
employees using
a random sampling approach.
13. B
The analysis tool pak has been
removed from Excel for
Windows, but a free third-party
19
24
1.043
23
32
85
1
0
4.6
1
M
A
tool that can be used
(found on an answers
Microsoft site) is:
15. Like the Microsoft site,
I make cannot guarantee
the program, but do know that
22
57
1.187
48
48
65
6
1
3.8
1
F
D
Statplus is a respected statistical
package.
You may use other approaches or tools
23
23