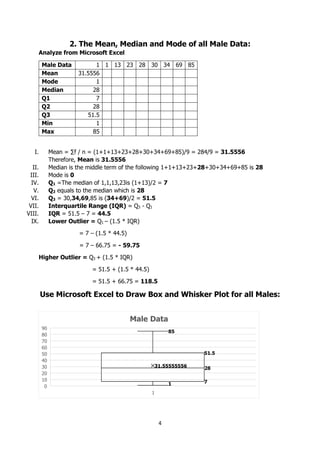
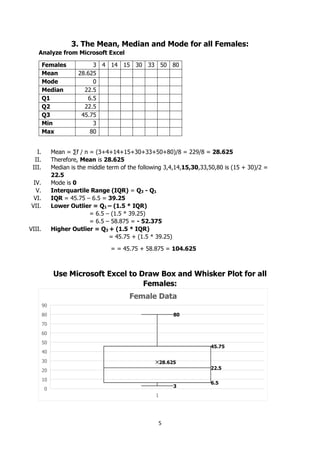
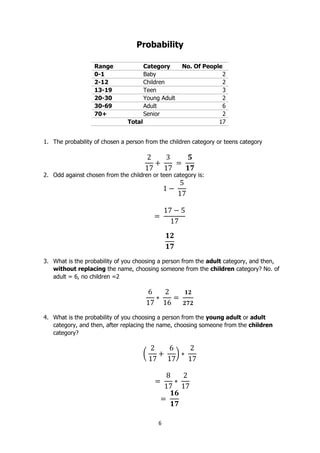
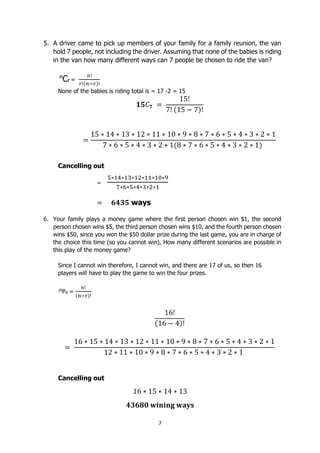
FACULTY OF INFORMATION AND COMMUNICATION TECHNOLOGY
MATH303, Probability and Statistics
Title : Individual Assignment
Issue Date : Week 2
Due Date : Week 4
Lecturer/Examiner : Mr. Abass Conteh
Name of Student/s : Ibrahim Pateh Bah
Student ID No. : 905002467
Class : BICT1203
Semester/Year : Year 3, Semester 1.
Academic Honesty Policy Statement
I/We, hereby attest those contents of this attachment are my own work. Referenced works, articles,
art, programs, papers or parts thereof are acknowledged at the end of this paper. This includes data
excerpted from CD-ROMs, the Internet, other private networks, and other people’s disk of the computer
system.
Student’s Signature : Date: 13th
MAY 2022
LECTURER’S COMMMENTS/GRADE: for office use only upon receive
Remark
DATE :
TIME :
RECEIVER’S NAME :
i
Table of Contents
Statistics ...................................................................................................................... 1
Data Table for All Ages............................................................................................... 1
Stem & Leaf plot for All Ages:..................................................................................... 1
Stem Leaf Plot for Females: Stem Leaf Plot for Males: ................................. 1
Stem and Leaf Plot for both Male and Female Back-to-Back........................................... 2
Circle Graph .............................................................................................................. 2
1a. The Mean, Median and Mode of all Ages: ............................................................... 3
1b. Use Microsoft Excel to Draw Box and Whisker Plot for all Ages................................. 3
2. The Mean, Median and Mode of all Male Data: ......................................................... 4
Use Microsoft Excel to Draw Box and Whisker Plot for all Males: .................................... 4
3. The Mean, Median and Mode for all Females:........................................................... 5
Use Microsoft Excel to Draw Box and Whisker Plot for all Females: ................................ 5
Probability.................................................................................................................... 6
References ................................................................................................................... 8
1
Statistics
Data Table for All Ages
Stem & Leaf plot for All Ages:
Stem Leaf
0 1,1,3,4
1 3,4,5
2 3,8
3 0,0,3,4
5 0
6 9
8 0,5
Stem Leaf Plot for Females: Stem Leaf Plot for Males:
Stem Leaf
0 3,4
1 4,5
3 0,3
5 0
8 0
Individual Relationship Gender Category Age
Salimatu Mother Female Adult 50
Haja Grand Ma Female Senior 80
Bella Sister Female Adult 30
Hawa Sister Female Child 3
Salimatu Cousin Female Child 4
Binta Sister Female Teen 14
Fatima Sister Female Adult 33
Zainabu Sister Female Teen 15
Umaru Father Male Adult 69
Hadi Uncle Male Teen 13
Mohamed Brother Male Young Adult 28
Abdulai Cousin Male Baby 1
Sullay Cousin Male Young Adult 23
Alieu Uncle Male Adult 34
Alhaji Kindi Grand Pa Male Senior 85
Pateh Me Male Adult 30
Abubakarr Cousin Male Baby 1
Total 346
Stem Leaf
0 1,1
1 3
2 3,8
3 0,4
6 9
8 5
2
Stem and Leaf Plot for both Male and Female Back-to-Back
Male Female
Leaf Stem Leaf
1,1 0 3,4
3 1 4,5
8,3 2
4,0 3 0,3
5 0
9 6
5 8 0
Circle Graph
Range Category No. Of People
0-1 Baby 2
2-12 Children 2
13-19 Teen 3
20-29 Young Adult 2
30-69 Adult 6
70+ Senior 2
0-1 Baby
12%
2-12 Children
12%
13-19 Teen
17%
20-29 Young Adult
12%
30-69 Adult
35%
70+ Senior
12%
Circle Graph for all Gender
0-1 Baby
2-12 Children
13-19 Teen
20-29 Young Adult
30-69 Adult
70+ Senior
3
1a. The Mean, Median and Mode of all Ages:
The Mean, Median and Mode of all Data from Microsoft Excel
Family
Ages
1 1 3 4 13 14 15 23 28 30 30 33 34 50 69 80 85
Mean 30.1765
Mode 1
Median 28
Q1 8.5
Q2 28
Q3 42
Min 1
Max 85
I. Mean = ∑f / n = (1+1+3+4+13+14++15+23+28+30+30+33+34+50+69++80+85)/17
= 513/17 = 30.1765
Therefore, Mean is 30.1765
II. Median is the middle term of the following
1,1,3,4,13,14,15,23,28,30,30,33,34,50,69,80,85 is 28
III. Mode is 1
IV. Q1 =The median of 1,1,3,4,13,14,15,23 is (4+13)/2 = 8.5
V. Q2 equals to the median which is 30
VI. Q3 = 30,30,33,34,50,69,80,85 is (34+50)/2 = 42
VII. Interquartile Range (IQR) = Q3 - Q1
IQR = 42 – 10.5 = 33.5
VIII. Lower Outlier = Q1 – (1.5 * IQR)
= 8.5 – (1.5 * 33.5)
= 8.5 – 50.25 = - 41.75
Higher Outlier = Q3 + (1.5 * IQR)
= 42 + (1.5 * 33.5)
= 42 + 50.25 = 92.25
1b. Use Microsoft Excel to Draw Box and Whisker Plot for all
Ages
4
2. The Mean, Median and Mode of all Male Data:
Analyze from Microsoft Excel
Male Data 1 1 13 23 28 30 34 69 85
Mean 31.5556
Mode 1
Median 28
Q1 7
Q2 28
Q3 51.5
Min 1
Max 85
I. Mean = ∑f / n = (1+1+13+23+28+30+34+69+85)/9 = 284/9 = 31.5556
Therefore, Mean is 31.5556
II. Median is the middle term of the following 1+1+13+23+28+30+34+69+85 is 28
III. Mode is 0
IV. Q1 =The median of 1,1,13,23is (1+13)/2 = 7
V. Q2 equals to the median which is 28
VI. Q3 = 30,34,69,85 is (34+69)/2 = 51.5
VII. Interquartile Range (IQR) = Q3 - Q1
VIII. IQR = 51.5 – 7 = 44.5
IX. Lower Outlier = Q1 – (1.5 * IQR)
= 7 – (1.5 * 44.5)
= 7 – 66.75 = - 59.75
Higher Outlier = Q3 + (1.5 * IQR)
= 51.5 + (1.5 * 44.5)
= 51.5 + 66.75 = 118.5
Use Microsoft Excel to Draw Box and Whisker Plot for all Males:
5
3. The Mean, Median and Mode for all Females:
Analyze from Microsoft Excel
Females 3 4 14 15 30 33 50 80
Mean 28.625
Mode 0
Median 22.5
Q1 6.5
Q2 22.5
Q3 45.75
Min 3
Max 80
I. Mean = ∑f / n = (3+4+14+15+30+33+50+80)/8 = 229/8 = 28.625
II. Therefore, Mean is 28.625
III. Median is the middle term of the following 3,4,14,15,30,33,50,80 is (15 + 30)/2 =
22.5
IV. Mode is 0
V. Interquartile Range (IQR) = Q3 - Q1
VI. IQR = 45.75 – 6.5 = 39.25
VII. Lower Outlier = Q1 – (1.5 * IQR)
= 6.5 – (1.5 * 39.25)
= 6.5 – 58.875 = - 52.375
VIII. Higher Outlier = Q3 + (1.5 * IQR)
= 45.75 + (1.5 * 39.25)
= = 45.75 + 58.875 = 104.625
Use Microsoft Excel to Draw Box and Whisker Plot for all
Females:
6
Probability
Range Category No. Of People
0-1 Baby 2
2-12 Children 2
13-19 Teen 3
20-30 Young Adult 2
30-69 Adult 6
70+ Senior 2
Total 17
1. The probability of chosen a person from the children category or teens category
2
17
+
3
17
=
𝟓
𝟏𝟕
2. Odd against chosen from the children or teen category is:
1 −
5
17
=
17 − 5
17
𝟏𝟐
𝟏𝟕
3. What is the probability of you choosing a person from the adult category, and then,
without replacing the name, choosing someone from the children category? No. of
adult = 6, no children =2
6
17
∗
2
16
=
𝟏𝟐
𝟐𝟕𝟐
4. What is the probability of you choosing a person from the young adult or adult
category, and then, after replacing the name, choosing someone from the children
category?
(
2
17
+
6
17
) ∗
2
17
=
8
17
∗
2
17
=
𝟏𝟔
𝟏𝟕
7
5. A driver came to pick up members of your family for a family reunion, the van
hold 7 people, not including the driver. Assuming that none of the babies is riding
in the van how many different ways can 7 people be chosen to ride the van?
n
Cr =
𝑛!
𝑟!(𝑛−𝑟)!
None of the babies is riding total is = 17 -2 = 15
𝟏𝟓𝐶𝟕 =
15!
7! (15 − 7)!
=
15 ∗ 14 ∗ 13 ∗ 12 ∗ 11 ∗ 10 ∗ 9 ∗ 8 ∗ 7 ∗ 6 ∗ 5 ∗ 4 ∗ 3 ∗ 2 ∗ 1
7 ∗ 6 ∗ 5 ∗ 4 ∗ 3 ∗ 2 ∗ 1(8 ∗ 7 ∗ 6 ∗ 5 ∗ 4 ∗ 3 ∗ 2 ∗ 1)
Cancelling out
=
5∗14∗13∗12∗11∗10∗9
7∗6∗5∗4∗3∗2∗1
= 𝟔𝟒𝟑𝟓 ways
6. Your family plays a money game where the first person chosen win $1, the second
person chosen wins $5, the third person chosen wins $10, and the fourth person chosen
wins $50, since you won the $50 dollar prize during the last game, you are in charge of
the choice this time (so you cannot win), How many different scenarios are possible in
this play of the money game?
Since I cannot win therefore, I cannot win, and there are 17 of us, so then 16
players will have to play the game to win the four prizes.
16
P4 =
n!
(n−r)!
16!
(16 − 4)!
=
16 ∗ 15 ∗ 14 ∗ 13 ∗ 12 ∗ 11 ∗ 10 ∗ 9 ∗ 8 ∗ 7 ∗ 6 ∗ 5 ∗ 4 ∗ 3 ∗ 2 ∗ 1
12 ∗ 11 ∗ 10 ∗ 9 ∗ 8 ∗ 7 ∗ 6 ∗ 5 ∗ 4 ∗ 3 ∗ 2 ∗ 1
Cancelling out
16 ∗ 15 ∗ 14 ∗ 13
𝟒𝟑𝟔𝟖𝟎 𝐰𝐢𝐧𝐢𝐧𝐠 𝐰𝐚𝐲𝐬
8
References
Calculator Soup, 2022. Combinations. [Online]
Available at:
https://www.calculatorsoup.com/calculators/discretemathematics/combinations.php
[Accessed 19 April 2022].
calculator soup, 2022. Permutations. [Online]
Available at:
https://www.calculatorsoup.com/calculators/discretemathematics/permutations.php
[Accessed 19 April 2022].
Just Answer, 2022. first-question-family-plays-money-game.html. [Online]
Available at: https://www.justanswer.com/homework/e6fxg-first-question-family-plays-
money-game.html
[Accessed 20 April 2022].
Khan Academy, 2022. box-whisker-plots. [Online]
Available at: https://www.khanacademy.org/math/statistics-probability/summarizing-
quantitative-data/box-whisker-plots/a/box-plot-
review#:~:text=The%20five%2Dnumber%20summary%20is,to%20the%20minimum%20o
r%20maximum.
[Accessed 21 April 2022].
Study, 2022. quartiles-the-interquartile-range-definition-formulate-examples. [Online]
Available at: https://study.com/academy/lesson/quartiles-the-interquartile-range-definition-
formulate-examples.html
[Accessed 18 April 2022].
Wyzant, 2022. probality-and-statistics. [Online]
Available at: https://www.wyzant.com/resources/answers/762342/probality-and-statistics
[Accessed 20 April 2022].

Probability & Statistic.pdf

  • 1.
    FACULTY OF INFORMATIONAND COMMUNICATION TECHNOLOGY MATH303, Probability and Statistics Title : Individual Assignment Issue Date : Week 2 Due Date : Week 4 Lecturer/Examiner : Mr. Abass Conteh Name of Student/s : Ibrahim Pateh Bah Student ID No. : 905002467 Class : BICT1203 Semester/Year : Year 3, Semester 1. Academic Honesty Policy Statement I/We, hereby attest those contents of this attachment are my own work. Referenced works, articles, art, programs, papers or parts thereof are acknowledged at the end of this paper. This includes data excerpted from CD-ROMs, the Internet, other private networks, and other people’s disk of the computer system. Student’s Signature : Date: 13th MAY 2022 LECTURER’S COMMMENTS/GRADE: for office use only upon receive Remark DATE : TIME : RECEIVER’S NAME :
  • 2.
    i Table of Contents Statistics...................................................................................................................... 1 Data Table for All Ages............................................................................................... 1 Stem & Leaf plot for All Ages:..................................................................................... 1 Stem Leaf Plot for Females: Stem Leaf Plot for Males: ................................. 1 Stem and Leaf Plot for both Male and Female Back-to-Back........................................... 2 Circle Graph .............................................................................................................. 2 1a. The Mean, Median and Mode of all Ages: ............................................................... 3 1b. Use Microsoft Excel to Draw Box and Whisker Plot for all Ages................................. 3 2. The Mean, Median and Mode of all Male Data: ......................................................... 4 Use Microsoft Excel to Draw Box and Whisker Plot for all Males: .................................... 4 3. The Mean, Median and Mode for all Females:........................................................... 5 Use Microsoft Excel to Draw Box and Whisker Plot for all Females: ................................ 5 Probability.................................................................................................................... 6 References ................................................................................................................... 8
  • 3.
    1 Statistics Data Table forAll Ages Stem & Leaf plot for All Ages: Stem Leaf 0 1,1,3,4 1 3,4,5 2 3,8 3 0,0,3,4 5 0 6 9 8 0,5 Stem Leaf Plot for Females: Stem Leaf Plot for Males: Stem Leaf 0 3,4 1 4,5 3 0,3 5 0 8 0 Individual Relationship Gender Category Age Salimatu Mother Female Adult 50 Haja Grand Ma Female Senior 80 Bella Sister Female Adult 30 Hawa Sister Female Child 3 Salimatu Cousin Female Child 4 Binta Sister Female Teen 14 Fatima Sister Female Adult 33 Zainabu Sister Female Teen 15 Umaru Father Male Adult 69 Hadi Uncle Male Teen 13 Mohamed Brother Male Young Adult 28 Abdulai Cousin Male Baby 1 Sullay Cousin Male Young Adult 23 Alieu Uncle Male Adult 34 Alhaji Kindi Grand Pa Male Senior 85 Pateh Me Male Adult 30 Abubakarr Cousin Male Baby 1 Total 346 Stem Leaf 0 1,1 1 3 2 3,8 3 0,4 6 9 8 5
  • 4.
    2 Stem and LeafPlot for both Male and Female Back-to-Back Male Female Leaf Stem Leaf 1,1 0 3,4 3 1 4,5 8,3 2 4,0 3 0,3 5 0 9 6 5 8 0 Circle Graph Range Category No. Of People 0-1 Baby 2 2-12 Children 2 13-19 Teen 3 20-29 Young Adult 2 30-69 Adult 6 70+ Senior 2 0-1 Baby 12% 2-12 Children 12% 13-19 Teen 17% 20-29 Young Adult 12% 30-69 Adult 35% 70+ Senior 12% Circle Graph for all Gender 0-1 Baby 2-12 Children 13-19 Teen 20-29 Young Adult 30-69 Adult 70+ Senior
  • 5.
    3 1a. The Mean,Median and Mode of all Ages: The Mean, Median and Mode of all Data from Microsoft Excel Family Ages 1 1 3 4 13 14 15 23 28 30 30 33 34 50 69 80 85 Mean 30.1765 Mode 1 Median 28 Q1 8.5 Q2 28 Q3 42 Min 1 Max 85 I. Mean = ∑f / n = (1+1+3+4+13+14++15+23+28+30+30+33+34+50+69++80+85)/17 = 513/17 = 30.1765 Therefore, Mean is 30.1765 II. Median is the middle term of the following 1,1,3,4,13,14,15,23,28,30,30,33,34,50,69,80,85 is 28 III. Mode is 1 IV. Q1 =The median of 1,1,3,4,13,14,15,23 is (4+13)/2 = 8.5 V. Q2 equals to the median which is 30 VI. Q3 = 30,30,33,34,50,69,80,85 is (34+50)/2 = 42 VII. Interquartile Range (IQR) = Q3 - Q1 IQR = 42 – 10.5 = 33.5 VIII. Lower Outlier = Q1 – (1.5 * IQR) = 8.5 – (1.5 * 33.5) = 8.5 – 50.25 = - 41.75 Higher Outlier = Q3 + (1.5 * IQR) = 42 + (1.5 * 33.5) = 42 + 50.25 = 92.25 1b. Use Microsoft Excel to Draw Box and Whisker Plot for all Ages
  • 6.
    4 2. The Mean,Median and Mode of all Male Data: Analyze from Microsoft Excel Male Data 1 1 13 23 28 30 34 69 85 Mean 31.5556 Mode 1 Median 28 Q1 7 Q2 28 Q3 51.5 Min 1 Max 85 I. Mean = ∑f / n = (1+1+13+23+28+30+34+69+85)/9 = 284/9 = 31.5556 Therefore, Mean is 31.5556 II. Median is the middle term of the following 1+1+13+23+28+30+34+69+85 is 28 III. Mode is 0 IV. Q1 =The median of 1,1,13,23is (1+13)/2 = 7 V. Q2 equals to the median which is 28 VI. Q3 = 30,34,69,85 is (34+69)/2 = 51.5 VII. Interquartile Range (IQR) = Q3 - Q1 VIII. IQR = 51.5 – 7 = 44.5 IX. Lower Outlier = Q1 – (1.5 * IQR) = 7 – (1.5 * 44.5) = 7 – 66.75 = - 59.75 Higher Outlier = Q3 + (1.5 * IQR) = 51.5 + (1.5 * 44.5) = 51.5 + 66.75 = 118.5 Use Microsoft Excel to Draw Box and Whisker Plot for all Males:
  • 7.
    5 3. The Mean,Median and Mode for all Females: Analyze from Microsoft Excel Females 3 4 14 15 30 33 50 80 Mean 28.625 Mode 0 Median 22.5 Q1 6.5 Q2 22.5 Q3 45.75 Min 3 Max 80 I. Mean = ∑f / n = (3+4+14+15+30+33+50+80)/8 = 229/8 = 28.625 II. Therefore, Mean is 28.625 III. Median is the middle term of the following 3,4,14,15,30,33,50,80 is (15 + 30)/2 = 22.5 IV. Mode is 0 V. Interquartile Range (IQR) = Q3 - Q1 VI. IQR = 45.75 – 6.5 = 39.25 VII. Lower Outlier = Q1 – (1.5 * IQR) = 6.5 – (1.5 * 39.25) = 6.5 – 58.875 = - 52.375 VIII. Higher Outlier = Q3 + (1.5 * IQR) = 45.75 + (1.5 * 39.25) = = 45.75 + 58.875 = 104.625 Use Microsoft Excel to Draw Box and Whisker Plot for all Females:
  • 8.
    6 Probability Range Category No.Of People 0-1 Baby 2 2-12 Children 2 13-19 Teen 3 20-30 Young Adult 2 30-69 Adult 6 70+ Senior 2 Total 17 1. The probability of chosen a person from the children category or teens category 2 17 + 3 17 = 𝟓 𝟏𝟕 2. Odd against chosen from the children or teen category is: 1 − 5 17 = 17 − 5 17 𝟏𝟐 𝟏𝟕 3. What is the probability of you choosing a person from the adult category, and then, without replacing the name, choosing someone from the children category? No. of adult = 6, no children =2 6 17 ∗ 2 16 = 𝟏𝟐 𝟐𝟕𝟐 4. What is the probability of you choosing a person from the young adult or adult category, and then, after replacing the name, choosing someone from the children category? ( 2 17 + 6 17 ) ∗ 2 17 = 8 17 ∗ 2 17 = 𝟏𝟔 𝟏𝟕
  • 9.
    7 5. A drivercame to pick up members of your family for a family reunion, the van hold 7 people, not including the driver. Assuming that none of the babies is riding in the van how many different ways can 7 people be chosen to ride the van? n Cr = 𝑛! 𝑟!(𝑛−𝑟)! None of the babies is riding total is = 17 -2 = 15 𝟏𝟓𝐶𝟕 = 15! 7! (15 − 7)! = 15 ∗ 14 ∗ 13 ∗ 12 ∗ 11 ∗ 10 ∗ 9 ∗ 8 ∗ 7 ∗ 6 ∗ 5 ∗ 4 ∗ 3 ∗ 2 ∗ 1 7 ∗ 6 ∗ 5 ∗ 4 ∗ 3 ∗ 2 ∗ 1(8 ∗ 7 ∗ 6 ∗ 5 ∗ 4 ∗ 3 ∗ 2 ∗ 1) Cancelling out = 5∗14∗13∗12∗11∗10∗9 7∗6∗5∗4∗3∗2∗1 = 𝟔𝟒𝟑𝟓 ways 6. Your family plays a money game where the first person chosen win $1, the second person chosen wins $5, the third person chosen wins $10, and the fourth person chosen wins $50, since you won the $50 dollar prize during the last game, you are in charge of the choice this time (so you cannot win), How many different scenarios are possible in this play of the money game? Since I cannot win therefore, I cannot win, and there are 17 of us, so then 16 players will have to play the game to win the four prizes. 16 P4 = n! (n−r)! 16! (16 − 4)! = 16 ∗ 15 ∗ 14 ∗ 13 ∗ 12 ∗ 11 ∗ 10 ∗ 9 ∗ 8 ∗ 7 ∗ 6 ∗ 5 ∗ 4 ∗ 3 ∗ 2 ∗ 1 12 ∗ 11 ∗ 10 ∗ 9 ∗ 8 ∗ 7 ∗ 6 ∗ 5 ∗ 4 ∗ 3 ∗ 2 ∗ 1 Cancelling out 16 ∗ 15 ∗ 14 ∗ 13 𝟒𝟑𝟔𝟖𝟎 𝐰𝐢𝐧𝐢𝐧𝐠 𝐰𝐚𝐲𝐬
  • 10.
    8 References Calculator Soup, 2022.Combinations. [Online] Available at: https://www.calculatorsoup.com/calculators/discretemathematics/combinations.php [Accessed 19 April 2022]. calculator soup, 2022. Permutations. [Online] Available at: https://www.calculatorsoup.com/calculators/discretemathematics/permutations.php [Accessed 19 April 2022]. Just Answer, 2022. first-question-family-plays-money-game.html. [Online] Available at: https://www.justanswer.com/homework/e6fxg-first-question-family-plays- money-game.html [Accessed 20 April 2022]. Khan Academy, 2022. box-whisker-plots. [Online] Available at: https://www.khanacademy.org/math/statistics-probability/summarizing- quantitative-data/box-whisker-plots/a/box-plot- review#:~:text=The%20five%2Dnumber%20summary%20is,to%20the%20minimum%20o r%20maximum. [Accessed 21 April 2022]. Study, 2022. quartiles-the-interquartile-range-definition-formulate-examples. [Online] Available at: https://study.com/academy/lesson/quartiles-the-interquartile-range-definition- formulate-examples.html [Accessed 18 April 2022]. Wyzant, 2022. probality-and-statistics. [Online] Available at: https://www.wyzant.com/resources/answers/762342/probality-and-statistics [Accessed 20 April 2022].