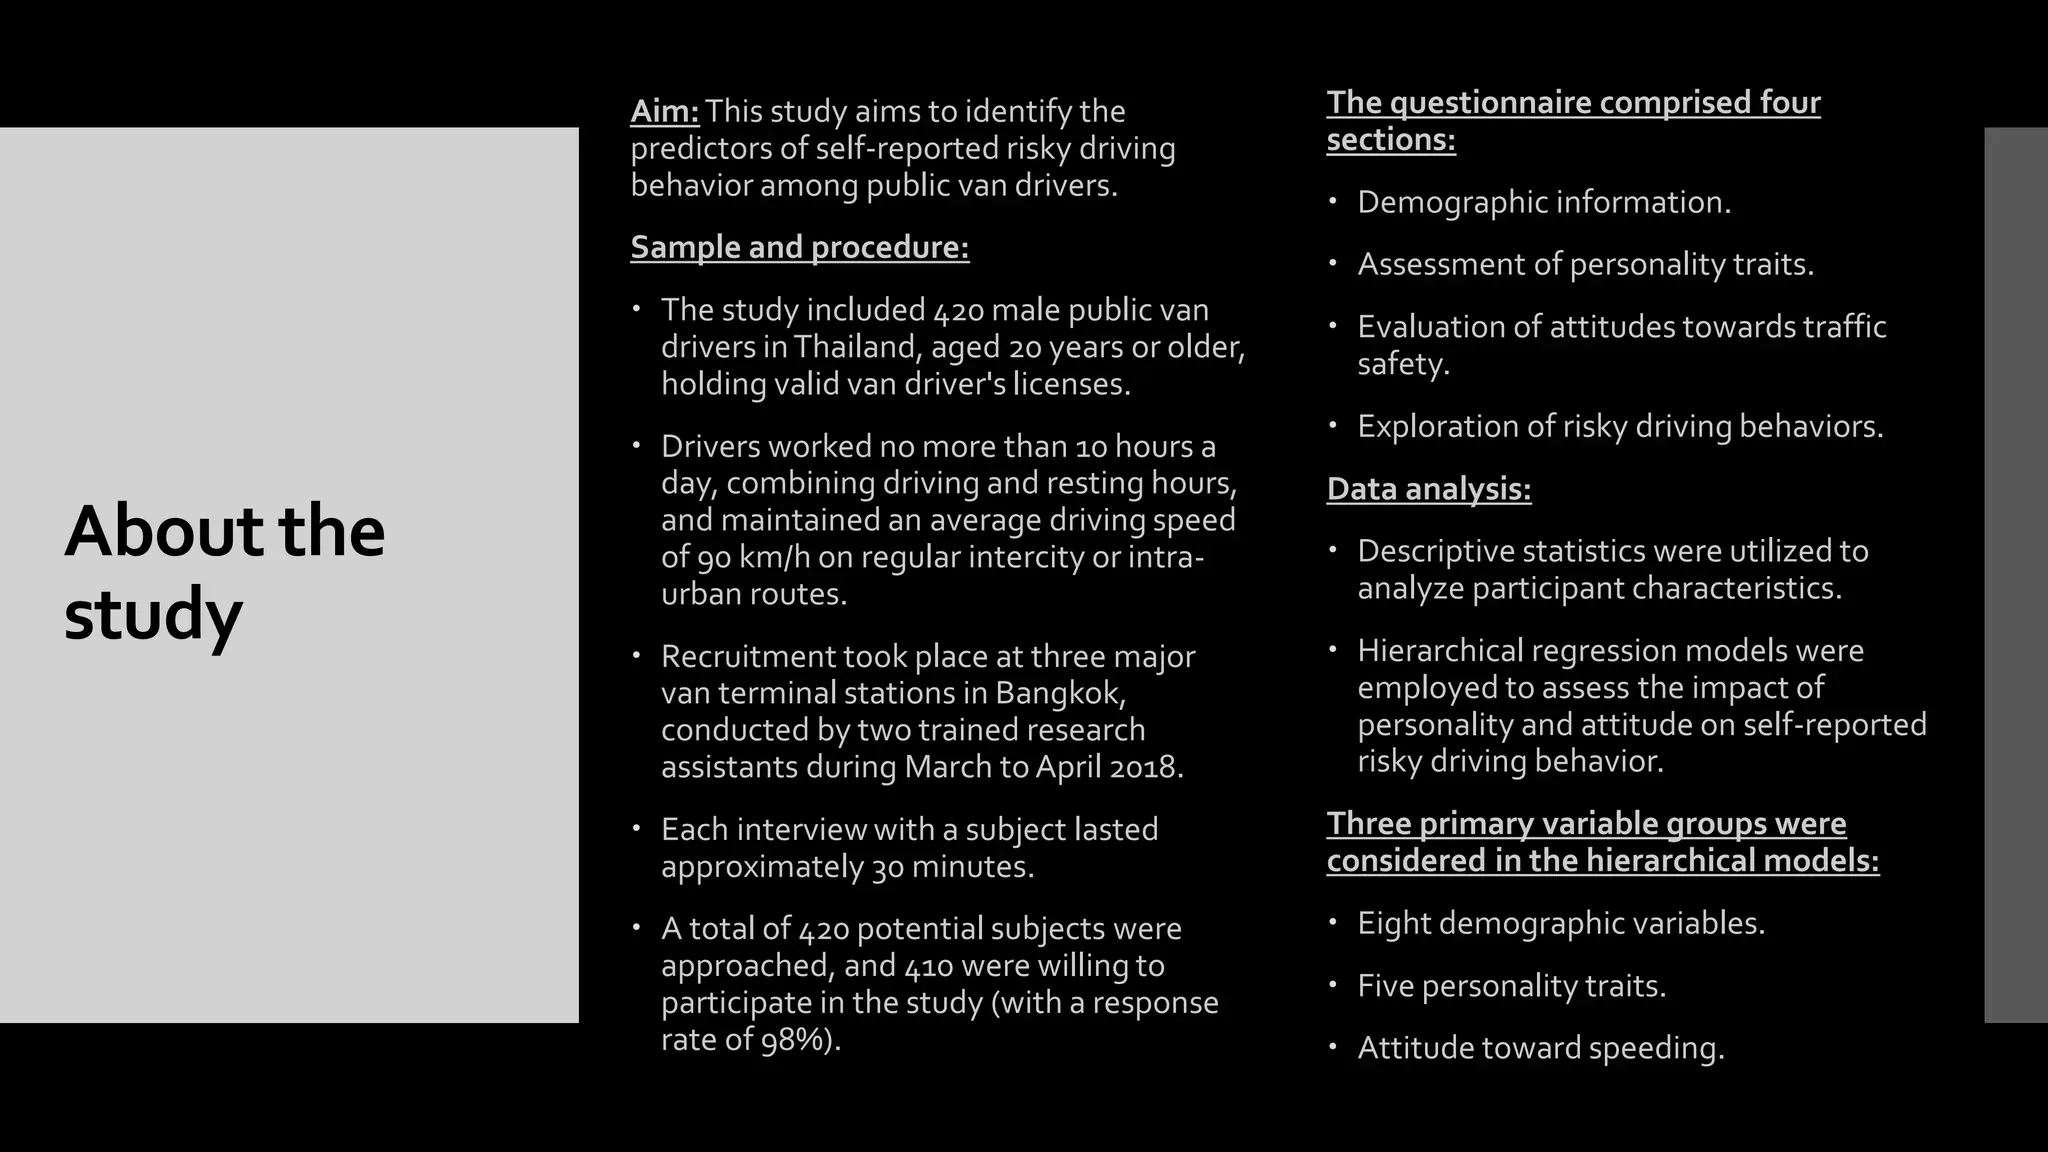
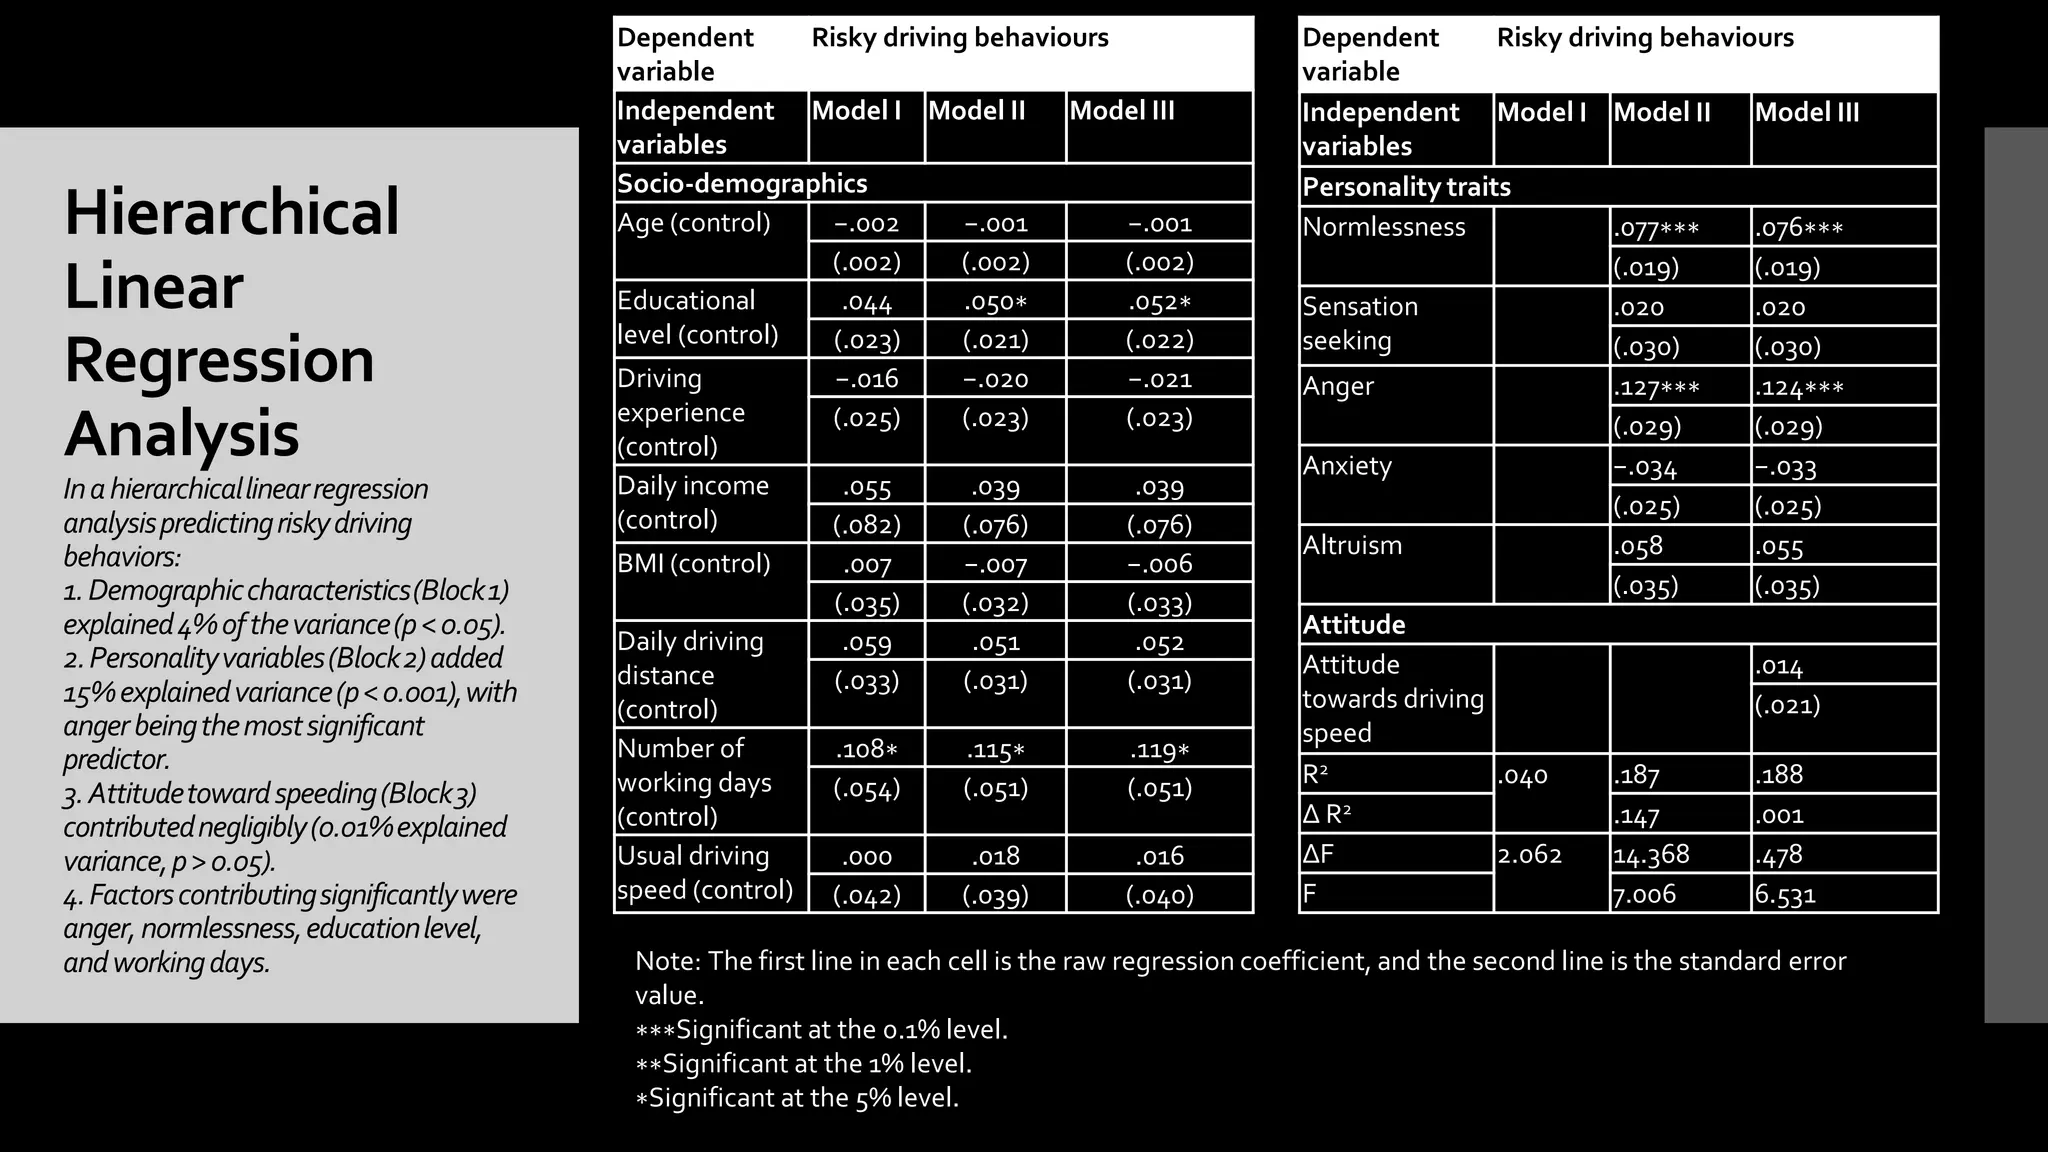
Probability &
Statisticsfor
DecisionSciences
Review Paper: “The Effects of
Personality andAttitude on Risky
Driving BehaviorAmong Public van
Drivers: Hierarchical Modeling”
About the
study
Aim:This study aims to identify the
predictors of self-reported risky driving
behavior among public van drivers.
Sample and procedure:
 The study included 420 male public van
drivers inThailand, aged 20 years or older,
holding valid van driver's licenses.
 Drivers worked no more than 10 hours a
day, combining driving and resting hours,
and maintained an average driving speed
of 90 km/h on regular intercity or intra-
urban routes.
 Recruitment took place at three major
van terminal stations in Bangkok,
conducted by two trained research
assistants during March to April 2018.
 Each interview with a subject lasted
approximately 30 minutes.
 A total of 420 potential subjects were
approached, and 410 were willing to
participate in the study (with a response
rate of 98%).
The questionnaire comprised four
sections:
 Demographic information.
 Assessment of personality traits.
 Evaluation of attitudes towards traffic
safety.
 Exploration of risky driving behaviors.
Data analysis:
 Descriptive statistics were utilized to
analyze participant characteristics.
 Hierarchical regression models were
employed to assess the impact of
personality and attitude on self-reported
risky driving behavior.
Three primary variable groups were
considered in the hierarchical models:
 Eight demographic variables.
 Five personality traits.
 Attitude toward speeding.
Variables Frequency (%)
Age group (years)
<30 33 (8.0)
30–39 83 (20.2)
40–49 132 (32.2)
>49 162 (39.6)
(Median = 45.5, QD = 7.5 Min = 24, Max = 75)
Educational level
Primary school 151 (36.8)
Secondary school 120 (29.3)
Higher than secondary school 139 (33.9)
Van driving experience (years)
<5 163 (39.8)
5–10 166 (40.5)
>10 81 (19.8)
(Median = 7, QD = 3 Min = 0.3, Max = 40)
Variables Frequency (%)
Daily income (Baht)
<400 109 (26.6)
400–500 154 (36.7)
501–1000 109 (26.6)
>1,000 38 (9.3)
(Median = 500, QD = 81 Min = 200, Max = 5,000)
Body mass index (kg/m2)
<18.5 11 (2.7)
18.5–22.9 113 (27.6)
23–24.9 89 (21.7)
25–29.9 139 (33.9)
≥ 30 58 (14.1)
(Median = 24.89, QD = 2.68 Min = 16.46,
Max = 49.59)
Descriptive
Analysis
Variables Frequency (%)
Daily driving distance (km/day)
<100 54 (13.2)
100–199 140 (34.1)
200–299 137 (33.4)
300–399 57 (13.9)
>399 22 (5.4)
(Median = 200, QD = 55, Min = 20, Max = 1,050)
Number of working days in the past week
1–6 days 113 (27.3)
Every day 297 (72.4)
(Median = 7, QD = 0.5 Min = 1, Max = 7)
Driving speed (km/h)
<80 32 (7.8)
80–90 329 (80.2)
>90 49 (12.0)
(Mean = 90, S.D. = 4.5 Min = 60, Max = 110)
Variables Frequency (%)
Self-reported risky behaviour
Low risk 240 (58.5)
High risk 170 (41.5)
Personality traits and
attitude
Mean (SD)
Normlessness 2.97 (0.90)
Sensation seeking 1.60 (0.63)
Anger 1.75 (0.67)
Anxiety 2.03 (0.74)
Altruism 4.56 (0.52)
Attitude towards
speeding
2.43 (0.85)
Descriptive
Analysis
Dependent
variable
Risky driving behaviours
Independent
variables
Model I Model II Model III
Socio-demographics
Age (control) −.002 −.001 −.001
(.002) (.002) (.002)
Educational
level (control)
.044 .050∗ .052∗
(.023) (.021) (.022)
Driving
experience
(control)
−.016 −.020 −.021
(.025) (.023) (.023)
Daily income
(control)
.055 .039 .039
(.082) (.076) (.076)
BMI (control) .007 −.007 −.006
(.035) (.032) (.033)
Daily driving
distance
(control)
.059 .051 .052
(.033) (.031) (.031)
Number of
working days
(control)
.108∗ .115∗ .119∗
(.054) (.051) (.051)
Usual driving
speed (control)
.000 .018 .016
(.042) (.039) (.040)
Hierarchical
Linear
Regression
Analysis
Inahierarchicallinearregression
analysispredictingriskydriving
behaviors:
1.Demographiccharacteristics(Block1)
explained4%ofthevariance(p<0.05).
2.Personalityvariables(Block2)added
15%explainedvariance(p<0.001),with
angerbeingthemostsignificant
predictor.
3.Attitudetowardspeeding(Block3)
contributednegligibly(0.01%explained
variance,p>0.05).
4.Factorscontributingsignificantlywere
anger,normlessness,educationlevel,
andworkingdays.
Dependent
variable
Risky driving behaviours
Independent
variables
Model I Model II Model III
Personality traits
Normlessness .077∗∗∗ .076∗∗∗
(.019) (.019)
Sensation
seeking
.020 .020
(.030) (.030)
Anger .127∗∗∗ .124∗∗∗
(.029) (.029)
Anxiety −.034 −.033
(.025) (.025)
Altruism .058 .055
(.035) (.035)
Attitude
Attitude
towards driving
speed
.014
(.021)
R2 .040 .187 .188
Δ R2 .147 .001
ΔF 2.062 14.368 .478
F 7.006 6.531
Note: The first line in each cell is the raw regression coefficient, and the second line is the standard error
value.
∗∗∗Significant at the 0.1% level.
∗∗Significant at the 1% level.
∗Significant at the 5% level.
ThankYou

Prob & Stats.pdf

  • 1.
    Probability & Statisticsfor DecisionSciences Review Paper:“The Effects of Personality andAttitude on Risky Driving BehaviorAmong Public van Drivers: Hierarchical Modeling”
  • 2.
    About the study Aim:This studyaims to identify the predictors of self-reported risky driving behavior among public van drivers. Sample and procedure:  The study included 420 male public van drivers inThailand, aged 20 years or older, holding valid van driver's licenses.  Drivers worked no more than 10 hours a day, combining driving and resting hours, and maintained an average driving speed of 90 km/h on regular intercity or intra- urban routes.  Recruitment took place at three major van terminal stations in Bangkok, conducted by two trained research assistants during March to April 2018.  Each interview with a subject lasted approximately 30 minutes.  A total of 420 potential subjects were approached, and 410 were willing to participate in the study (with a response rate of 98%). The questionnaire comprised four sections:  Demographic information.  Assessment of personality traits.  Evaluation of attitudes towards traffic safety.  Exploration of risky driving behaviors. Data analysis:  Descriptive statistics were utilized to analyze participant characteristics.  Hierarchical regression models were employed to assess the impact of personality and attitude on self-reported risky driving behavior. Three primary variable groups were considered in the hierarchical models:  Eight demographic variables.  Five personality traits.  Attitude toward speeding.
  • 3.
    Variables Frequency (%) Agegroup (years) <30 33 (8.0) 30–39 83 (20.2) 40–49 132 (32.2) >49 162 (39.6) (Median = 45.5, QD = 7.5 Min = 24, Max = 75) Educational level Primary school 151 (36.8) Secondary school 120 (29.3) Higher than secondary school 139 (33.9) Van driving experience (years) <5 163 (39.8) 5–10 166 (40.5) >10 81 (19.8) (Median = 7, QD = 3 Min = 0.3, Max = 40) Variables Frequency (%) Daily income (Baht) <400 109 (26.6) 400–500 154 (36.7) 501–1000 109 (26.6) >1,000 38 (9.3) (Median = 500, QD = 81 Min = 200, Max = 5,000) Body mass index (kg/m2) <18.5 11 (2.7) 18.5–22.9 113 (27.6) 23–24.9 89 (21.7) 25–29.9 139 (33.9) ≥ 30 58 (14.1) (Median = 24.89, QD = 2.68 Min = 16.46, Max = 49.59) Descriptive Analysis
  • 4.
    Variables Frequency (%) Dailydriving distance (km/day) <100 54 (13.2) 100–199 140 (34.1) 200–299 137 (33.4) 300–399 57 (13.9) >399 22 (5.4) (Median = 200, QD = 55, Min = 20, Max = 1,050) Number of working days in the past week 1–6 days 113 (27.3) Every day 297 (72.4) (Median = 7, QD = 0.5 Min = 1, Max = 7) Driving speed (km/h) <80 32 (7.8) 80–90 329 (80.2) >90 49 (12.0) (Mean = 90, S.D. = 4.5 Min = 60, Max = 110) Variables Frequency (%) Self-reported risky behaviour Low risk 240 (58.5) High risk 170 (41.5) Personality traits and attitude Mean (SD) Normlessness 2.97 (0.90) Sensation seeking 1.60 (0.63) Anger 1.75 (0.67) Anxiety 2.03 (0.74) Altruism 4.56 (0.52) Attitude towards speeding 2.43 (0.85) Descriptive Analysis
  • 5.
    Dependent variable Risky driving behaviours Independent variables ModelI Model II Model III Socio-demographics Age (control) −.002 −.001 −.001 (.002) (.002) (.002) Educational level (control) .044 .050∗ .052∗ (.023) (.021) (.022) Driving experience (control) −.016 −.020 −.021 (.025) (.023) (.023) Daily income (control) .055 .039 .039 (.082) (.076) (.076) BMI (control) .007 −.007 −.006 (.035) (.032) (.033) Daily driving distance (control) .059 .051 .052 (.033) (.031) (.031) Number of working days (control) .108∗ .115∗ .119∗ (.054) (.051) (.051) Usual driving speed (control) .000 .018 .016 (.042) (.039) (.040) Hierarchical Linear Regression Analysis Inahierarchicallinearregression analysispredictingriskydriving behaviors: 1.Demographiccharacteristics(Block1) explained4%ofthevariance(p<0.05). 2.Personalityvariables(Block2)added 15%explainedvariance(p<0.001),with angerbeingthemostsignificant predictor. 3.Attitudetowardspeeding(Block3) contributednegligibly(0.01%explained variance,p>0.05). 4.Factorscontributingsignificantlywere anger,normlessness,educationlevel, andworkingdays. Dependent variable Risky driving behaviours Independent variables Model I Model II Model III Personality traits Normlessness .077∗∗∗ .076∗∗∗ (.019) (.019) Sensation seeking .020 .020 (.030) (.030) Anger .127∗∗∗ .124∗∗∗ (.029) (.029) Anxiety −.034 −.033 (.025) (.025) Altruism .058 .055 (.035) (.035) Attitude Attitude towards driving speed .014 (.021) R2 .040 .187 .188 Δ R2 .147 .001 ΔF 2.062 14.368 .478 F 7.006 6.531 Note: The first line in each cell is the raw regression coefficient, and the second line is the standard error value. ∗∗∗Significant at the 0.1% level. ∗∗Significant at the 1% level. ∗Significant at the 5% level.
  • 6.