PRINT
MANAGEMENT STRATEGY SCORING GUIDE
Due Date: End of Unit 4.
Percentage of Course Grade: 8%.
Note: Your instructor may also use the Writing Feedback Tool to provide feedback on your writing. In the tool, click on the linked resources for helpful writing information.
MANAGEMENT STRATEGY SCORING GUIDE GRADING RUBRIC
Criteria
Non-performance
Basic
Proficient
Distinguished
Develop a flowchart with new or different information about the causes of a problem.
22%
Does not develop a flowchart with information about the causes of a problem.
Develops a flowchart, but it does not offer new or different information about the causes of a problem.
Develops a flowchart with new or different information about the causes of a problem.
Analyzes a flowchart with new or different information about the causes of a problem.
Analyze potential quantitative and qualitative measurement strategies for use in a selected improvement process.
22%
Does not identify potential quantitative and qualitative measurement strategies for use in a selected improvement process.
Identifies potential quantitative and qualitative measurement strategies for use in a selected improvement process.
Analyzes potential quantitative and qualitative measurement strategies for use in a selected improvement process.
Evaluates potential quantitative and qualitative measurement strategies for use in a selected improvement process. Analyzes strategy characteristics that would result in the most viable improvement.
Develop a measurement strategy for improvements in a selected process.
23%
Does not identify a measurement strategy for improvements in a selected process.
Identifies a measurement strategy for improvements in a selected process.
Develops a measurement strategy for improvements in a selected process.
Evaluates a measurement strategy for improvements in a selected process to determine whether improvements have a positive or negative impact, cross-functionally.
Describe revisions to a flowchart and measurement strategy.
23%
Does not identify revisions to a flowchart and measurement strategy.
Identifies revisions to a flowchart and measurement strategy.
Describes revisions to a flowchart and measurement strategy.
Interprets revisions to a flowchart and measurement strategy.
Communicate in a manner that is professional and consistent with expectations for members of the business professions.
10%
Communicates in a manner that is not professional or consistent with expectations for members of the business professions.
Communicates in a manner that is inconsistent with expectations for members of the business professions.
Communicates in a manner that is professional and consistent with expectations for members of the business professions.
Communicates in a manner that is professional, scholarly, and consistent with expectations for members of the business professions. Adheres to APA guidelines, and work is appropriate for publication.
Fishbone Diagram
The below cause and e.
PRINTMANAGEMENT STRATEGY SCORING GUIDEDue Date End of Unit 4..docx
1. PRINT
MANAGEMENT STRATEGY SCORING GUIDE
Due Date: End of Unit 4.
Percentage of Course Grade: 8%.
Note: Your instructor may also use the Writing Feedback
Tool to provide feedback on your writing. In the tool, click on
the linked resources for helpful writing information.
MANAGEMENT STRATEGY SCORING GUIDE GRADING
RUBRIC
Criteria
Non-performance
Basic
Proficient
Distinguished
Develop a flowchart with new or different information about the
causes of a problem.
22%
Does not develop a flowchart with information about the causes
of a problem.
Develops a flowchart, but it does not offer new or different
information about the causes of a problem.
Develops a flowchart with new or different information about
the causes of a problem.
Analyzes a flowchart with new or different information about
the causes of a problem.
Analyze potential quantitative and qualitative measurement
strategies for use in a selected improvement process.
22%
Does not identify potential quantitative and qualitative
measurement strategies for use in a selected improvement
process.
Identifies potential quantitative and qualitative measurement
strategies for use in a selected improvement process.
Analyzes potential quantitative and qualitative measurement
2. strategies for use in a selected improvement process.
Evaluates potential quantitative and qualitative measurement
strategies for use in a selected improvement process. Analyzes
strategy characteristics that would result in the most viable
improvement.
Develop a measurement strategy for improvements in a selected
process.
23%
Does not identify a measurement strategy for improvements in a
selected process.
Identifies a measurement strategy for improvements in a
selected process.
Develops a measurement strategy for improvements in a
selected process.
Evaluates a measurement strategy for improvements in a
selected process to determine whether improvements have a
positive or negative impact, cross-functionally.
Describe revisions to a flowchart and measurement strategy.
23%
Does not identify revisions to a flowchart and measurement
strategy.
Identifies revisions to a flowchart and measurement strategy.
Describes revisions to a flowchart and measurement strategy.
Interprets revisions to a flowchart and measurement strategy.
Communicate in a manner that is professional and consistent
with expectations for members of the business professions.
10%
Communicates in a manner that is not professional or consistent
with expectations for members of the business professions.
Communicates in a manner that is inconsistent with
expectations for members of the business professions.
Communicates in a manner that is professional and consistent
with expectations for members of the business professions.
Communicates in a manner that is professional, scholarly, and
consistent with expectations for members of the business
professions. Adheres to APA guidelines, and work is
3. appropriate for publication.
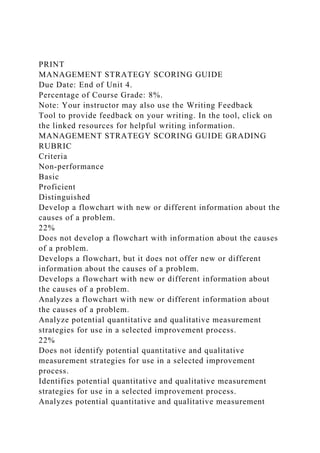
Fishbone Diagram
The below cause and effect diagram shows the major
categories and possible causes to Toyota’s poor handling of
customer complaints.
The fishbone diagram is a display that hones on a
primary goal output to delivering the end result as desired. In
the case example, the selection to focusing on customer service
metrics for improving the overall company's objective is for
business continuity to encouraging returning customers.
Therefore, the main focus on a fishbone diagram is customer
service as an objective for aiming in meeting accomplishments
within the timeframe set forth, for instance, the improving of
customer service metrics (feedback, surveys, and customer
preferences) to delivering a customer satisfaction.
Fish head = Customer Service {Toyota Corporation objective is
improving their customer service} Try and identify the one
concept focus to improving the business organization, which, in
the case example the customer service processes requires a
change method in processing to reaching satisfactory metrics.
Left (or top) side of Fishbone = Employees and management
team {Toyota internal human capital should reflect an
investment in training and communication methods that
empower and share information} Try and list the core areas of
needed focus that outline both positives and negatives in
regards to employees, such as, training seminars can positively
improve customer service standards, while, the lack of training
restricts knowledge in problem solving for customers. The
management criteria should reflect the same element on both
sides of the bone link; i.e. management lack of communication
skills results in lower productivity that impact customer's
4. experience.
Right (or bottom) side of Fishbone = Product quality {Toyota
manufacturing of the product fails to meeting corporate and
industry standards for long-term efficiency for customers} Try
and think of the product quality as layers that will promote the
end main goal of good customer service due to implementing
strategies. Businesses impose strategies on a basis that
reinforces the beneficial aspects in the product lines that will
promote good customer service upon delivery to the targeted
consumer demographic. Keep in mind, the product quality
elements can entail work processes and knowledge base to
adhering to company's procedures on using technology (i.e.
product manufacturing line).
Thus, the objective in outlining processes and operations
protocols (management communication model to work teams)
provides the content for the both sides of the fishbone leading
to customer service goals metric. In doing so, the fishbone
diagram will detail the main correlation to required phases,
processes, and decisions implemented for successfully obtaining
the customer service satisfactory levels.
Graphical flowchart
Below is a graphical flowchart created from the
information provided in the exhibits from the Accelerator Crisis
article and from the Toyota Motor Manufacturing article.
By using the Fishbone diagram as a blueprint to the
causes of the issues of customer services, the objective is met as
well by seeing the opposite needs to be done in order to fix the
customer service problem at the corporation, i.e. Management
decisions on spending not enough of resources yes or no – if no,
then the lack of training employees occur to a level that impact
quality output, and so forth on the corresponding issues
identified to the problem statement.
Problem Statement
In order for Toyota to have continuous improvement
5. and excellent customer satisfaction achieved, the first step in
any significant change effort is to bring together a
knowledgeable group of people to address the basic
implementation issues and establish a guiding direction. The PI
steering team should be cross-functional, with members that
understand the organization well, have a strong desire to
participate, and see the team as critical to organizational
success. Once the guiding process improvement plan is
developed, the steering team must present it to the senior
management team. Without top management’s understanding
and approval, no plan will have the support it needs to succeed.
Once approved, the role of the steering team is literally to steer
implementation and generate course correction.
Contributing Cause and Process Improvement
One of the main causes of Toyota’s slow handling of
customer complaints is Lack of employee interaction, due to
their standardized handling in dealing with any problems or
issues. Information went directly to Japan without ever being
relayed back to the U.S. organization, and that all key
engineering decisions came from Japan. The scope of the
improvement process focuses on shortening the overall time to
meet corrective action. By implementing this process
improvement, the company would realize a number of benefits
in terms of communication management among company’s
dealers and headquarters. Toyota understands that in a typical
business system, meeting and exceeding the customer’s
requirements is the task of everyone within an organization.
And they comprehended the definition of customer to include
both internal and external customers. Each person or step in a
production line or business process was to be treated as a
customer and to be supplied with exactly what was needed, at
the exact time needed.
6. References:
Greto, M., Schotter, A., & Teagarden, M. (2010). Toyota: The
accelerator crisis. Thunderbird School of Global Management.
Mishina, K. & Takeda, K. (1995). Toyota motor manufacturing,
U.S.A., Inc. Harvard Business Review.
ASSIGNMENT (Toyota accelerator crisis)
Management Strategy
Activity Objective
This assignment helps you develop the skills to master the
following course competencies:
· Develop innovative and sustainable solutions to strategic and
global operations management challenges.
· Apply theories, models, and practices of global operations
management to address business problems.
· Integrate operations management analyses into general
business management planning and decision making.
· Communicate in a manner that is professional and consistent
with expectations for members of the business professions.
Activity Instructions
There are two parts to this assignment.
Part 1: Continue your analysis of the organizational problem
and the process you will propose in your OIP by researching,
collecting, and verifying further data. Complete the following:
1. Address the following questions, as well as any other new
questions you encounter in your research:
· Does any information from the cause-and-effect diagram or
the flowcharts you created in Unit 3 seem to point to a
particular cause?
· Does your cause-and-effect diagram conflict with your
7. flowchart? If so, how?
· Does the cause-and-effect diagram reveal any process steps
that were not previously documented?
· Do you need to do further research on any causes identified in
the cause-and-effect diagram?
· Is there a key stakeholder who might have additional or
updated feedback for the process flowchart? If so, identify the
position (or role) of the stakeholder and describe what he or she
might say.
· Does any of this information change or impact your problem
statement?
2. Update the before-and-after flowchart you initially created in
Unit 3, changing the information based on your new findings,
focused on the causes of the organizational problem. Write a
summary describing your revisions to the flowchart. Describe
how (if at all) your problem statement is impacted by the
revisions. Include copies of both the original flowchart and the
revised version within the text of your paper.
Part 2: The tool that you use to measure the effectiveness of
your new process will make a difference in defining and
quantifying your outcomes. For this part of your assignment,
complete the following:
1. Research various measurement strategies that you might use
for your OIP.
2. Develop a measurement strategy that enables you to measure
the improvements your proposed process will offer. Your
measurement strategy should help you determine whether the
results are actually positive and ensure that your process does
not have an unanticipated negative impact elsewhere. Note that
you may need to revise your measurement strategy as more
historical data is gathered.
3. Identify what types of quantitative or qualitative measures
you will employ in your measurement strategy, including the
following:
1. An analysis of potential quantitative and qualitative
measurement strategies that would apply to your OIP.
8. 2. A description of the qualitative or quantitative measure (or
measures) you have chosen.
3. A description of how often the improvement results are
measured when using this strategy.
Submission Requirements
· Written communication: Written communication is free of
errors that detract from the overall message.
· APA formatting: Resources and citations are formatted
according to APA (6th edition) style and formatting.
· Font and font size: Times New Roman, 12-point.
Review the Management Strategy Scoring Guide to make sure
you have met all of the criteria of this assignment.
N.B
I did not show the "after" flowchart that visually illustrates
what it might look like after my recommendations are
incorporated in my last assignment(unit 3).I will need the
“after” flowchart in this assignment(i.e. updated).