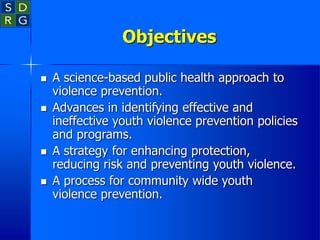
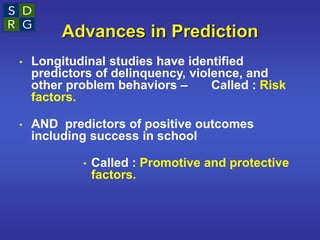
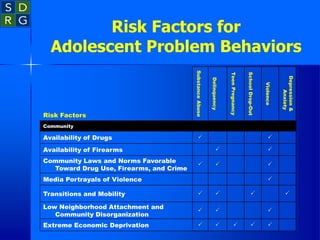
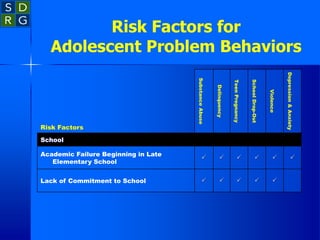
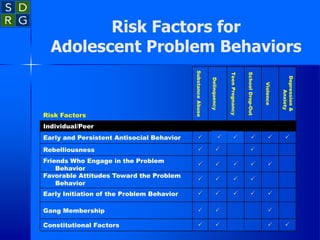
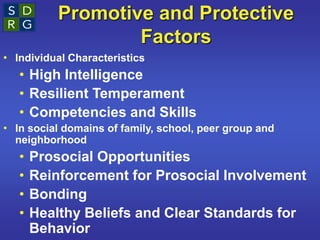
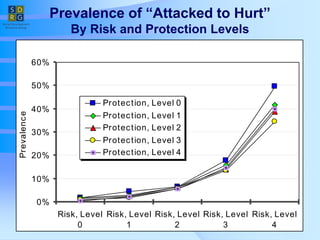
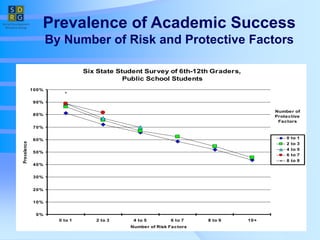
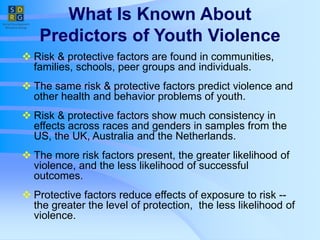
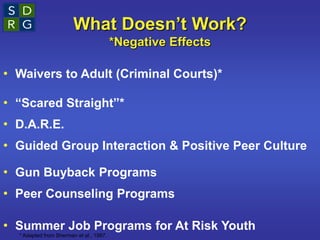
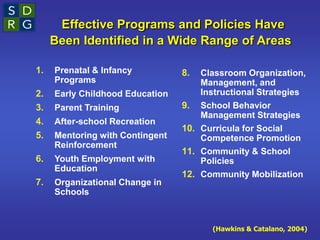
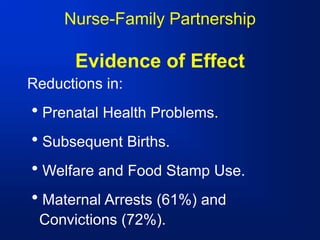
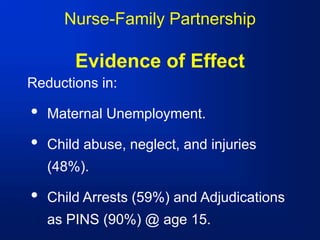
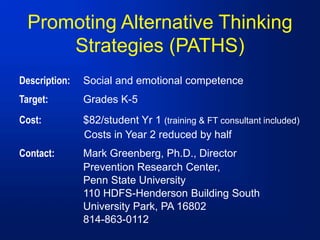
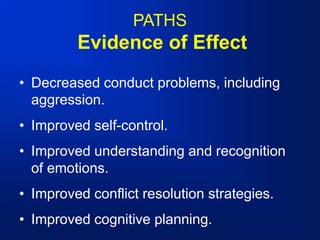
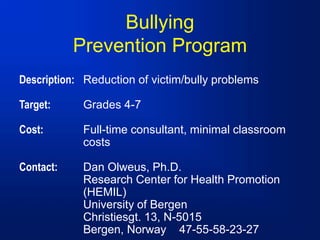
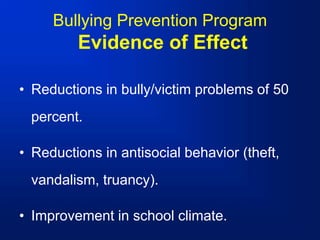
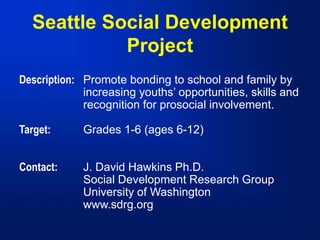
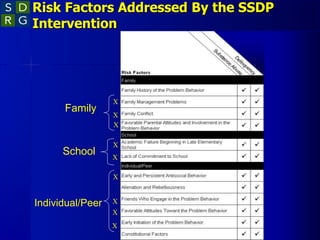
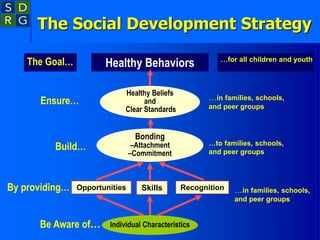
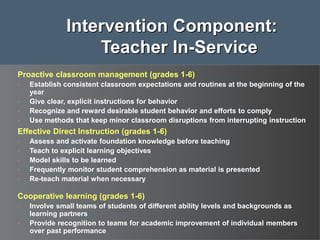
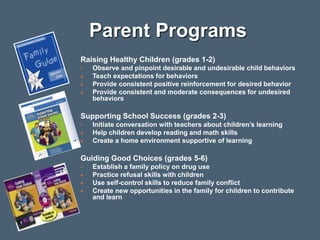
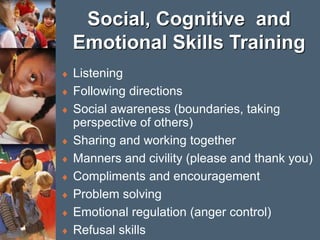
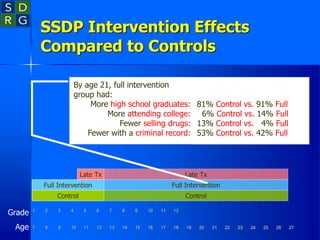
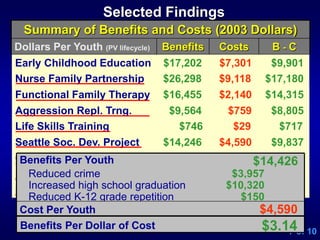
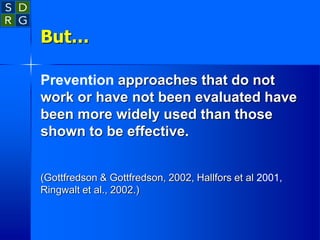
Using Prevention Science
to Guide Community Action
J. David Hawkins, Ph.D.
Endowed Professor of Prevention
Social Development Research Group
School of Social Work
University of Washington
jdh@u.washington.edu
www.sdrg.org
Objectives
 A science-based public health approach to
violence prevention.
 Advances in identifying effective and
ineffective youth violence prevention policies
and programs.
 A strategy for enhancing protection,
reducing risk and preventing youth violence.
 A process for community wide youth
violence prevention.
History of Delinquency
Prevention in the U.S.
 Before 1980, nine experimental tests of
delinquency prevention programs were
conducted in the U.S.
– NONE found desired effects in preventing
delinquency. (Berleman, 1980)
The Premise of Prevention
Science
To prevent a problem before it
happens, the factors that
predict the problem must be
changed.
Advances in Prediction
• Longitudinal studies have identified
predictors of delinquency, violence, and
other problem behaviors – Called : Risk
factors.
• AND predictors of positive outcomes
including success in school
• Called : Promotive and protective
factors.
Risk Factors for
Adolescent Problem Behaviors





Extreme Economic Deprivation



Low Neighborhood Attachment and
Community Disorganization




Transitions and Mobility

Media Portrayals of Violence



Community Laws and Norms Favorable
Toward Drug Use, Firearms, and Crime


Availability of Firearms


Availability of Drugs
Community
Depression
&
Anxiety
Violence
School
Drop-Out
Teen
Pregnancy
Delinquency
Substance
Abuse
Risk Factors
Risk Factors for
Adolescent Problem Behaviors



Favorable Parental Attitudes and
Involvement in the Problem Behavior






Family Conflict






Family Management Problems






Family History of the Problem Behavior
Family
Depression
&
Anxiety
Violence
School
Drop-Out
Teen
Pregnancy
Delinquency
Substance
Abuse
Risk Factors
Risk Factors for
Adolescent Problem Behaviors





Lack of Commitment to School






Academic Failure Beginning in Late
Elementary School
School
Depression
&
Anxiety
Violence
School
Drop-Out
Teen
Pregnancy
Delinquency
Substance
Abuse
Risk Factors
Risk Factors for
Adolescent Problem Behaviors




Constitutional Factors



Gang Membership





Early Initiation of the Problem Behavior




Favorable Attitudes Toward the Problem
Behavior





Friends Who Engage in the Problem
Behavior



Rebelliousness




Early and Persistent Antisocial Behavior
Individual/Peer
Depression
&
Anxiety
Violence
School
Drop-Out
Teen
Pregnancy
Delinquency
Substance
Abuse
Risk Factors
 
Promotive and Protective
Factors
• Individual Characteristics
• High Intelligence
• Resilient Temperament
• Competencies and Skills
• In social domains of family, school, peer group and
neighborhood
• Prosocial Opportunities
• Reinforcement for Prosocial Involvement
• Bonding
• Healthy Beliefs and Clear Standards for
Behavior
Prevalence of “Attacked to Hurt”
By Risk and Protection Levels
0%
10%
20%
30%
40%
50%
60%
Risk, Level
0
Risk, Level
1
Risk, Level
2
Risk, Level
3
Risk, Level
4
Pr
evalenc
e
Protection, Level 0
Protection, Level 1
Protection, Level 2
Protection, Level 3
Protection, Level 4
Prevalence of Academic Success
By Number of Risk and Protective Factors
0%
10%
20%
30%
40%
50%
60%
70%
80%
90%
100%
0 to 1 2 to 3 4 to 5 6 to 7 8 to 9 10+
Number of Risk Factors
Prevalence
0 to 1
2 to 3
4 to 5
6 to 7
8 to 9
Number of
Protective
Factors
Six State Student Survey of 6th-12th Graders,
Public School Students
What Is Known About
Predictors of Youth Violence
 Risk & protective factors are found in communities,
families, schools, peer groups and individuals.
 The same risk & protective factors predict violence and
other health and behavior problems of youth.
 Risk & protective factors show much consistency in
effects across races and genders in samples from the
US, the UK, Australia and the Netherlands.
 The more risk factors present, the greater likelihood of
violence, and the less likelihood of successful
outcomes.
 Protective factors reduce effects of exposure to risk --
the greater the level of protection, the less likelihood of
violence.
Advances in Prevention
Controlled studies have identified
both ineffective and effective
prevention and youth development
policies and programs.
What Doesn’t Work?
*Negative Effects
• Waivers to Adult (Criminal Courts)*
• “Scared Straight”*
• D.A.R.E.
• Guided Group Interaction & Positive Peer Culture
• Gun Buyback Programs
• Peer Counseling Programs
• Summer Job Programs for At Risk Youth
* Adapted from Sherman et al., 1997.
Effective Programs and Policies Have
Been Identified in a Wide Range of Areas
1. Prenatal & Infancy
Programs
2. Early Childhood Education
3. Parent Training
4. After-school Recreation
5. Mentoring with Contingent
Reinforcement
6. Youth Employment with
Education
7. Organizational Change in
Schools
8. Classroom Organization,
Management, and
Instructional Strategies
9. School Behavior
Management Strategies
10. Curricula for Social
Competence Promotion
11. Community & School
Policies
12. Community Mobilization
(Hawkins & Catalano, 2004)
Lists of Rigorously Tested and
Effective Youth Violence Prevention
Approaches
• Blueprints for Violence Prevention
www.colorado.edu/cspv/blueprints/
• Communities That Care Prevention
Strategies Guide
http://preventionplatform.samhsa.gov/
Nurse-Family Partnership
Description: Nurse home visitation
Target: Low-income, at-risk pregnant women bearing
their first child
Contact: David Olds, M.D., Director
Prevention Research Center
1825 Marion Street
Denver, CO 80218
303-864-5200
Nurse-Family Partnership
Evidence of Effect
Reductions in:
Prenatal Health Problems.
Subsequent Births.
Welfare and Food Stamp Use.
Maternal Arrests (61%) and
Convictions (72%).
Nurse-Family Partnership
Evidence of Effect
Reductions in:
 Maternal Unemployment.
 Child abuse, neglect, and injuries
(48%).
 Child Arrests (59%) and Adjudications
as PINS (90%) @ age 15.
Promoting Alternative Thinking
Strategies (PATHS)
Description: Social and emotional competence
Target: Grades K-5
Cost: $82/student Yr 1 (training & FT consultant included)
Costs in Year 2 reduced by half
Contact: Mark Greenberg, Ph.D., Director
Prevention Research Center,
Penn State University
110 HDFS-Henderson Building South
University Park, PA 16802
814-863-0112
PATHS
Evidence of Effect
• Decreased conduct problems, including
aggression.
• Improved self-control.
• Improved understanding and recognition
of emotions.
• Improved conflict resolution strategies.
• Improved cognitive planning.
Bullying
Prevention Program
Description: Reduction of victim/bully problems
Target: Grades 4-7
Cost: Full-time consultant, minimal classroom
costs
Contact: Dan Olweus, Ph.D.
Research Center for Health Promotion
(HEMIL)
University of Bergen
Christiesgt. 13, N-5015
Bergen, Norway 47-55-58-23-27
Bullying Prevention Program
Evidence of Effect
• Reductions in bully/victim problems of 50
percent.
• Reductions in antisocial behavior (theft,
vandalism, truancy).
• Improvement in school climate.
Seattle Social Development
Project
Description: Promote bonding to school and family by
increasing youths’ opportunities, skills and
recognition for prosocial involvement.
Target: Grades 1-6 (ages 6-12)
Contact: J. David Hawkins Ph.D.
Social Development Research Group
University of Washington
www.sdrg.org
Family
School
Individual/Peer
X
X
X
X
X
X
X
X
X
Risk Factors Addressed By the SSDP
Intervention
Individual Characteristics
Be Aware of…
The Social Development Strategy
The Goal… Healthy Behaviors …for all children and youth
Healthy Beliefs
and
Clear Standards
…in families, schools,
and peer groups
Ensure…
Build…
Bonding
–Attachment
–Commitment
…to families, schools,
and peer groups
By providing… Opportunities Skills Recognition …in families, schools,
and peer groups
Seattle Social Development Project
Core Components
Teacher Training in Classroom
Instruction and Management
Parent Training
in Behavior Management and
Academic Support
Child Social and Emotional Skill
Development
Proactive classroom management (grades 1-6)
• Establish consistent classroom expectations and routines at the beginning of the
year
• Give clear, explicit instructions for behavior
• Recognize and reward desirable student behavior and efforts to comply
• Use methods that keep minor classroom disruptions from interrupting instruction
Effective Direct Instruction (grades 1-6)
• Assess and activate foundation knowledge before teaching
• Teach to explicit learning objectives
• Model skills to be learned
• Frequently monitor student comprehension as material is presented
• Re-teach material when necessary
Cooperative learning (grades 1-6)
• Involve small teams of students of different ability levels and backgrounds as
learning partners
• Provide recognition to teams for academic improvement of individual members
over past performance
Intervention Component:
Teacher In-Service
Parent Programs
Raising Healthy Children (grades 1-2)
• Observe and pinpoint desirable and undesirable child behaviors
 Teach expectations for behaviors
 Provide consistent positive reinforcement for desired behavior
 Provide consistent and moderate consequences for undesired
behaviors
Supporting School Success (grades 2-3)
• Initiate conversation with teachers about children’s learning
 Help children develop reading and math skills
 Create a home environment supportive of learning
Guiding Good Choices (grades 5-6)
• Establish a family policy on drug use
 Practice refusal skills with children
 Use self-control skills to reduce family conflict
 Create new opportunities in the family for children to contribute
and learn
Social, Cognitive and
Emotional Skills Training
 Listening
 Following directions
 Social awareness (boundaries, taking
perspective of others)
 Sharing and working together
 Manners and civility (please and thank you)
 Compliments and encouragement
 Problem solving
 Emotional regulation (anger control)
 Refusal skills
Support Structures
 School Staff
– Implementation team training
– 7 days of teacher training
– Coaching
– Principal support
 Family
– Training in each parenting curriculum
SSDP Intervention Effects
Compared to Controls
1 2 3 4 5 6 7 8 9 10 11 12
7 8 9 10 11 12 13 14 15 16 17 18 19 20 21 22 23 24 25 26 27
Control
Full Intervention
Late Tx
Control
Full Intervention
Late Tx
At the end of the 2nd grade
• boys less aggressive
• girls less self-destructive
By the start of 5th grade, those in the full
intervention had
• less initiation of alcohol
• less initiation of delinquency
• better family management
• better family communication
• better family involvement
• higher attachment to family
• higher school rewards
• higher school bonding
Grade
Age
2.70
2.75
2.80
2.85
2.90
2.95
3.00
3.05
3.10
13 14 15 16 17 18
Age
Level
of
School
Bonding
Full Treatment
Late Treatment
Control
Effects of SSDP Intervention on
School Bonding from Age 13 to 18
Hawkins, Guo, Hill, Battin-Pearson & Abbott (2001)
SSDP Intervention Effects
Compared to Controls
1 2 3 4 5 6 7 8 9 10 11 12
7 8 9 10 11 12 13 14 15 16 17 18 19 20 21 22 23 24 25 26 27
Control
Full Intervention
Late Tx
Control
Full Intervention
Late Tx
By age 18 Youths in the
Full Intervention had
less heavy alcohol use:
less lifetime violence:
fewer lifetime sex partners:
less grade repetition:
Grade
Age
25.0% Control vs. 15.4% Full
59.7% Control vs. 48.3% Full
61.5% Control vs. 49.7% Full
22.8% Control vs. 14.0% Full
SSDP Intervention Effects
Compared to Controls
1 2 3 4 5 6 7 8 9 10 11 12
7 8 9 10 11 12 13 14 15 16 17 18 19 20 21 22 23 24 25 26 27
Control
Full Intervention
Late Tx
Control
Full Intervention
Late Tx
Grade
Age
By age 21, full intervention
group had:
More high school graduates:
More attending college:
Fewer selling drugs:
Fewer with a criminal record:
81% Control vs. 91% Full
6% Control vs. 14% Full
13% Control vs. 4% Full
53% Control vs. 42% Full
Steve Aos, Associate Director
Washington State Institute for Public Policy
Phone: (360) 586-2768
E-mail: saos@wsipp.wa.gov
Institute Publications: www.wa.gov/wsipp
Benefits and Costs of
Prevention and Early
Intervention Programs for Youth
Summary of Benefits and Costs (2003 Dollars)
Dollars Per Youth (PV lifecycle) Benefits Costs B - C
Early Childhood Education $17,202 $7,301 $9,901
Nurse Family Partnership $26,298 $9,118 $17,180
Functional Family Therapy $16,455 $2,140 $14,315
Life Skills Training $746 $29 $717
Seattle Soc. Dev. Project $14,246 $4,590 $9,837
Guiding Good Choices $7,605 $687 $6,918
Multi-D Treat. Foster Care $26,748 $2,459 $24,290
Intensive Juv. Supervision $0 $1,482 -$1,482
Selected Findings
Aggression Repl. Trng. $9,564 $759 $8,805
7 of 10
$3,957
Reduced crime
$150
Reduced K-12 grade repetition
$10,320
Increased high school graduation
$14,426
Benefits Per Youth
$4,590
$3.14
Benefits Per Dollar of Cost
Cost Per Youth
But…
Prevention approaches that do not
work or have not been evaluated have
been more widely used than those
shown to be effective.
(Gottfredson & Gottfredson, 2002, Hallfors et al 2001,
Ringwalt et al., 2002.)
Empowering Communities
to Prevent Youth Violence
 Youths in different neighborhoods and
communities are exposed to different
levels of risk and protection.
Distribution of Risk in a City
John A. Pollard ,P h.D. Developmental Research and Pr ograms
No s tudents
in t his a re a .
In su f fic ie nt n um b e r of
st u de n ts in this ar e a.
N eighborhood #2
N eighborhood #1 N eighborhood #3
M adison M iddle School Risk Profile 8th Grade
0%
10%
20%
30%
40%
50%
60%
70%
80%
90%
100%
L
o
w
N
e
i
g
h
b
o
r
h
o
o
d
A
t
t
a
c
h
m
e
n
t
C
o
m
m
u
n
i
t
y
D
i
s
o
r
g
a
n
i
z
a
t
i
o
n
L
a
w
s
a
n
d
N
o
r
m
s
F
a
v
o
r
a
b
l
e
t
o
D
r
u
g
U
s
e
P
e
r
c
e
i
v
e
d
A
v
a
i
l
a
b
i
l
i
t
y
o
f
D
r
u
g
s
P
e
r
c
e
i
v
e
d
A
v
a
i
l
a
b
i
l
i
t
y
o
f
H
a
n
d
g
u
n
s
P
o
o
r
F
a
m
i
l
y
M
a
n
a
g
e
m
e
n
t
F
a
m
i
l
y
C
o
n
f
l
i
c
t
F
a
m
i
l
y
H
i
s
t
o
r
y
o
f
A
n
t
i
s
o
c
i
a
l
B
e
h
a
v
i
o
r
P
a
r
e
n
t
a
l
A
t
t
i
t
u
d
e
s
F
a
v
o
r
a
b
l
e
T
o
w
a
r
d
s
D
r
u
g
U
s
e
P
a
r
e
n
t
a
l
A
t
t
i
t
u
d
e
s
F
a
v
o
r
a
b
l
e
t
o
A
n
t
i
s
o
c
i
a
l
B
e
h
a
v
i
o
r
A
c
a
d
e
m
i
c
F
a
i
l
u
r
e
L
o
w
C
o
m
m
i
t
m
e
n
t
t
o
S
c
h
o
o
l
R
e
b
e
l
l
i
o
u
s
n
e
s
s
E
a
r
l
y
P
r
o
b
l
e
m
B
e
h
a
v
i
o
r
E
a
r
l
y
I
n
i
t
i
a
t
i
o
n
o
f
D
r
u
g
U
s
e
F
a
v
o
r
a
b
l
e
A
t
t
i
t
u
d
e
s
T
o
w
a
r
d
A
n
t
i
s
o
c
i
a
l
B
e
h
a
v
i
o
r
F
a
v
o
r
a
b
l
e
A
t
t
i
t
u
d
e
s
T
o
w
a
r
d
D
r
u
g
U
s
e
L
o
w
P
e
r
c
e
i
v
e
d
R
i
s
k
s
o
f
D
r
u
g
U
s
e
F
r
i
e
n
d
s
'
U
s
e
o
f
D
r
u
g
s
S
e
n
s
a
t
i
o
n
S
e
e
k
i
n
g
R
e
w
a
r
d
s
f
o
r
A
n
t
i
s
o
c
i
a
l
I
n
v
o
l
v
e
m
e
n
t
O
v
e
r
a
l
l
R
i
s
k
Pe
r
ce
n
t
A
t
Risk
School 2002 District 2002
Community Family School
Survey Participation Rate 2002: 87.4%
2002
Estimated National Value
Peer-Individual
Madison Middle School Risk Profile 8th Grade
2002
N ova H igh School Risk Profile 10th Grade
0%
10%
20%
30%
40%
50%
60%
70%
80%
90%
100%
L
o
w
N
e
i
g
h
b
o
r
h
o
o
d
A
t
t
a
c
h
m
e
n
t
C
o
m
m
u
n
i
t
y
D
i
s
o
r
g
a
n
i
z
a
t
i
o
n
L
a
w
s
a
n
d
N
o
r
m
s
F
a
v
o
r
a
b
l
e
t
o
D
r
u
g
U
s
e
P
e
r
c
e
i
v
e
d
A
v
a
i
l
a
b
i
l
i
t
y
o
f
D
r
u
g
s
P
e
r
c
e
i
v
e
d
A
v
a
i
l
a
b
i
l
i
t
y
o
f
H
a
n
d
g
u
n
s
P
o
o
r
F
a
m
i
l
y
M
a
n
a
g
e
m
e
n
t
F
a
m
i
l
y
C
o
n
f
l
i
c
t
F
a
m
i
l
y
H
i
s
t
o
r
y
o
f
A
n
t
i
s
o
c
i
a
l
B
e
h
a
v
i
o
r
P
a
r
e
n
t
a
l
A
t
t
i
t
u
d
e
s
F
a
v
o
r
a
b
l
e
T
o
w
a
r
d
s
D
r
u
g
U
s
e
P
a
r
e
n
t
a
l
A
t
t
i
t
u
d
e
s
F
a
v
o
r
a
b
l
e
t
o
A
n
t
i
s
o
c
i
a
l
B
e
h
a
v
i
o
r
*
*
A
c
a
d
e
m
i
c
F
a
i
l
u
r
e
L
o
w
C
o
m
m
i
t
m
e
n
t
t
o
S
c
h
o
o
l
R
e
b
e
l
l
i
o
u
s
n
e
s
s
E
a
r
l
y
P
r
o
b
l
e
m
B
e
h
a
v
i
o
r
E
a
r
l
y
I
n
i
t
i
a
t
i
o
n
o
f
D
r
u
g
U
s
e
F
a
v
o
r
a
b
l
e
A
t
t
i
t
u
d
e
s
T
o
w
a
r
d
A
n
t
i
s
o
c
i
a
l
B
e
h
a
v
i
o
r
F
a
v
o
r
a
b
l
e
A
t
t
i
t
u
d
e
s
T
o
w
a
r
d
D
r
u
g
U
s
e
L
o
w
P
e
r
c
e
i
v
e
d
R
i
s
k
s
o
f
D
r
u
g
U
s
e
F
r
i
e
n
d
s
'
U
s
e
o
f
D
r
u
g
s
S
e
n
s
a
t
i
o
n
S
e
e
k
i
n
g
R
e
w
a
r
d
s
f
o
r
A
n
t
i
s
o
c
i
a
l
I
n
v
o
l
v
e
m
e
n
t
O
v
e
r
a
l
l
R
i
s
k
Pe
r
ce
n
t
A
t
Risk
School 2002 District 2002
Community Family School
Survey Participation Rate 2002: 79.7%
2002
Peer-Individual
Estimated National Value
Peer-Individual
Nova High School Risk Profile 10th Grade
2002
The Goal for Community Prevention
To identify and address those risk
factors that are most prevalent and
those protective factors that are most
depressed with tested and effective
policies and programs.
Challenges for Community
Prevention
 To identify the community’s profile of
risk and protection.
 To address elevated risks and low
protection with tested and effective
preventive actions.
 To evaluate outcomes to insure desired
effects are achieved in the community.
The Communities That Care
Operating System
Creating
Communities
That Care
Get Started
Get Organized
Develop a Profile
Create a Plan
Implement and
Evaluate
The Communities That Care
Operating System
Creating
Communities
That Care
Get Started
Get Organized
Develop a Profile
Create a Plan
Implement and
Evaluate
• Community readiness
assessment.
• Identification of key
individuals, stakeholders,
and organizations.
The Communities That Care
Operating System
Creating
Communities
That Care
Get Started
Get Organized
Develop a Profile
Create a Plan
Implement and
Evaluate
• Training key leaders
and board in CTC
• Building the
community coalition.
The Communities That Care
Operating System
Creating
Communities
That Care
Get Started
Get Organized
Develop a Profile
Create a Plan
Implement and
Evaluate
• Collect
risk/protective factor
and outcome data.
•Collect information on
community resources
• Construct a
community profile from
the data.
Diffusion Consortium Project
Social Development Research Group, University of Washington
M adison M iddle School Risk Profile 8th Grade
0%
10%
20%
30%
40%
50%
60%
70%
80%
90%
100%
L
o
w
N
e
i
g
h
b
o
r
h
o
o
d
A
t
t
a
c
h
m
e
n
t
C
o
m
m
u
n
i
t
y
D
i
s
o
r
g
a
n
i
z
a
t
i
o
n
L
a
w
s
a
n
d
N
o
r
m
s
F
a
v
o
r
a
b
l
e
t
o
D
r
u
g
U
s
e
P
e
r
c
e
i
v
e
d
A
v
a
i
l
a
b
i
l
i
t
y
o
f
D
r
u
g
s
P
e
r
c
e
i
v
e
d
A
v
a
i
l
a
b
i
l
i
t
y
o
f
H
a
n
d
g
u
n
s
P
o
o
r
F
a
m
i
l
y
M
a
n
a
g
e
m
e
n
t
F
a
m
i
l
y
C
o
n
f
l
i
c
t
F
a
m
i
l
y
H
i
s
t
o
r
y
o
f
A
n
t
i
s
o
c
i
a
l
B
e
h
a
v
i
o
r
P
a
r
e
n
t
a
l
A
t
t
i
t
u
d
e
s
F
a
v
o
r
a
b
l
e
T
o
w
a
r
d
s
D
r
u
g
U
s
e
P
a
r
e
n
t
a
l
A
t
t
i
t
u
d
e
s
F
a
v
o
r
a
b
l
e
t
o
A
n
t
i
s
o
c
i
a
l
B
e
h
a
v
i
o
r
A
c
a
d
e
m
i
c
F
a
i
l
u
r
e
L
o
w
C
o
m
m
i
t
m
e
n
t
t
o
S
c
h
o
o
l
R
e
b
e
l
l
i
o
u
s
n
e
s
s
E
a
r
l
y
P
r
o
b
l
e
m
B
e
h
a
v
i
o
r
E
a
r
l
y
I
n
i
t
i
a
t
i
o
n
o
f
D
r
u
g
U
s
e
F
a
v
o
r
a
b
l
e
A
t
t
i
t
u
d
e
s
T
o
w
a
r
d
A
n
t
i
s
o
c
i
a
l
B
e
h
a
v
i
o
r
F
a
v
o
r
a
b
l
e
A
t
t
i
t
u
d
e
s
T
o
w
a
r
d
D
r
u
g
U
s
e
L
o
w
P
e
r
c
e
i
v
e
d
R
i
s
k
s
o
f
D
r
u
g
U
s
e
F
r
i
e
n
d
s
'
U
s
e
o
f
D
r
u
g
s
S
e
n
s
a
t
i
o
n
S
e
e
k
i
n
g
R
e
w
a
r
d
s
f
o
r
A
n
t
i
s
o
c
i
a
l
I
n
v
o
l
v
e
m
e
n
t
O
v
e
r
a
l
l
R
i
s
k
Pe
r
ce
n
t
A
t
Risk
School 2002 District 2002
Community Family School
Survey Participation Rate 2002: 87.4%
2002
Estimated National Value
Peer-Individual
The Communities That Care
Operating System
Creating
Communities
That Care
Get Started
Get Organized
Develop a Profile
Create a Plan
Implement and
Evaluate
• Define outcomes.
•Prioritize factors to be
targeted.
• Select tested, effective
interventions.
• Create action plan.
• Develop evaluation plan.
Diffusion Consortium Project
Social Development Research Group, University of Washington
Addressing Barriers with Effective
Action
3-5
Early Childhood Education
prenatal-2
Prenatal/Infancy Programs
6-14
Family Therapy
prenatal-14
Parent Training
Family Management
Problems
Developmental Period
Program Strategy
Factor Addressed
Diffusion Consortium Project
Social Development Research Group, University of Washington
Effective Training for
Middle School Parents
• Guiding Good Choices (Spoth et al., 1998)
• Adolescent Transitions Program (Dishion and
Andrews, 1995)
• Parenting Adolescents Wisely (Gordon et al.,
1998)
• Creating Lasting Connections (Johnson et al.,
1996)
• Strengthening Families 10 to 14 Program (Spoth,
1998)
• Focus on Families (Catalano et al., 1999; 1997)
The Communities That Care
Operating System
Creating
Communities
That Care
Get Started
Get Organized
Develop a Profile
Create a Plan
Implement and
Evaluate
• Form task forces.
• Identify and train
implementers.
• Sustain collaborative
relationships.
• Evaluate processes and
outcomes.
• Adjust programming.
The Communities That Care Prevention
Operating System is available at:
http://preventionplatform.samhsa.gov/
Summary and Implications
Organizations concerned with violence and
health and behavior problems of youth
should:
 Collect epidemiologic data on levels of risk
and protective factors to focus community
action on the most elevated risks.
 Collaborate to strengthen protection and
reduce shared risks for these problems.
Summary and Implications
 Tested and effective policies and
programs for preventing youth
violence are available.
 Use tested and effective approaches
where possible and appropriate.
 Support rigorous evaluation of these
approaches in these new contexts.
Using Prevention Science
to Guide Community Action
J. David Hawkins, Ph.D.
Endowed Professor of Prevention
Social Development Research Group
School of Social Work
University of Washington
jdh@u.washington.edu
www.sdrg.org

preventionscience.ppt

  • 1.
    Using Prevention Science toGuide Community Action J. David Hawkins, Ph.D. Endowed Professor of Prevention Social Development Research Group School of Social Work University of Washington jdh@u.washington.edu www.sdrg.org
  • 2.
    Objectives  A science-basedpublic health approach to violence prevention.  Advances in identifying effective and ineffective youth violence prevention policies and programs.  A strategy for enhancing protection, reducing risk and preventing youth violence.  A process for community wide youth violence prevention.
  • 3.
    History of Delinquency Preventionin the U.S.  Before 1980, nine experimental tests of delinquency prevention programs were conducted in the U.S. – NONE found desired effects in preventing delinquency. (Berleman, 1980)
  • 4.
    The Premise ofPrevention Science To prevent a problem before it happens, the factors that predict the problem must be changed.
  • 5.
    Advances in Prediction •Longitudinal studies have identified predictors of delinquency, violence, and other problem behaviors – Called : Risk factors. • AND predictors of positive outcomes including success in school • Called : Promotive and protective factors.
  • 6.
    Risk Factors for AdolescentProblem Behaviors      Extreme Economic Deprivation    Low Neighborhood Attachment and Community Disorganization     Transitions and Mobility  Media Portrayals of Violence    Community Laws and Norms Favorable Toward Drug Use, Firearms, and Crime   Availability of Firearms   Availability of Drugs Community Depression & Anxiety Violence School Drop-Out Teen Pregnancy Delinquency Substance Abuse Risk Factors
  • 7.
    Risk Factors for AdolescentProblem Behaviors    Favorable Parental Attitudes and Involvement in the Problem Behavior       Family Conflict       Family Management Problems       Family History of the Problem Behavior Family Depression & Anxiety Violence School Drop-Out Teen Pregnancy Delinquency Substance Abuse Risk Factors
  • 8.
    Risk Factors for AdolescentProblem Behaviors      Lack of Commitment to School       Academic Failure Beginning in Late Elementary School School Depression & Anxiety Violence School Drop-Out Teen Pregnancy Delinquency Substance Abuse Risk Factors
  • 9.
    Risk Factors for AdolescentProblem Behaviors     Constitutional Factors    Gang Membership      Early Initiation of the Problem Behavior     Favorable Attitudes Toward the Problem Behavior      Friends Who Engage in the Problem Behavior    Rebelliousness     Early and Persistent Antisocial Behavior Individual/Peer Depression & Anxiety Violence School Drop-Out Teen Pregnancy Delinquency Substance Abuse Risk Factors  
  • 10.
    Promotive and Protective Factors •Individual Characteristics • High Intelligence • Resilient Temperament • Competencies and Skills • In social domains of family, school, peer group and neighborhood • Prosocial Opportunities • Reinforcement for Prosocial Involvement • Bonding • Healthy Beliefs and Clear Standards for Behavior
  • 11.
    Prevalence of “Attackedto Hurt” By Risk and Protection Levels 0% 10% 20% 30% 40% 50% 60% Risk, Level 0 Risk, Level 1 Risk, Level 2 Risk, Level 3 Risk, Level 4 Pr evalenc e Protection, Level 0 Protection, Level 1 Protection, Level 2 Protection, Level 3 Protection, Level 4
  • 12.
    Prevalence of AcademicSuccess By Number of Risk and Protective Factors 0% 10% 20% 30% 40% 50% 60% 70% 80% 90% 100% 0 to 1 2 to 3 4 to 5 6 to 7 8 to 9 10+ Number of Risk Factors Prevalence 0 to 1 2 to 3 4 to 5 6 to 7 8 to 9 Number of Protective Factors Six State Student Survey of 6th-12th Graders, Public School Students
  • 13.
    What Is KnownAbout Predictors of Youth Violence  Risk & protective factors are found in communities, families, schools, peer groups and individuals.  The same risk & protective factors predict violence and other health and behavior problems of youth.  Risk & protective factors show much consistency in effects across races and genders in samples from the US, the UK, Australia and the Netherlands.  The more risk factors present, the greater likelihood of violence, and the less likelihood of successful outcomes.  Protective factors reduce effects of exposure to risk -- the greater the level of protection, the less likelihood of violence.
  • 14.
    Advances in Prevention Controlledstudies have identified both ineffective and effective prevention and youth development policies and programs.
  • 15.
    What Doesn’t Work? *NegativeEffects • Waivers to Adult (Criminal Courts)* • “Scared Straight”* • D.A.R.E. • Guided Group Interaction & Positive Peer Culture • Gun Buyback Programs • Peer Counseling Programs • Summer Job Programs for At Risk Youth * Adapted from Sherman et al., 1997.
  • 16.
    Effective Programs andPolicies Have Been Identified in a Wide Range of Areas 1. Prenatal & Infancy Programs 2. Early Childhood Education 3. Parent Training 4. After-school Recreation 5. Mentoring with Contingent Reinforcement 6. Youth Employment with Education 7. Organizational Change in Schools 8. Classroom Organization, Management, and Instructional Strategies 9. School Behavior Management Strategies 10. Curricula for Social Competence Promotion 11. Community & School Policies 12. Community Mobilization (Hawkins & Catalano, 2004)
  • 17.
    Lists of RigorouslyTested and Effective Youth Violence Prevention Approaches • Blueprints for Violence Prevention www.colorado.edu/cspv/blueprints/ • Communities That Care Prevention Strategies Guide http://preventionplatform.samhsa.gov/
  • 18.
    Nurse-Family Partnership Description: Nursehome visitation Target: Low-income, at-risk pregnant women bearing their first child Contact: David Olds, M.D., Director Prevention Research Center 1825 Marion Street Denver, CO 80218 303-864-5200
  • 19.
    Nurse-Family Partnership Evidence ofEffect Reductions in: Prenatal Health Problems. Subsequent Births. Welfare and Food Stamp Use. Maternal Arrests (61%) and Convictions (72%).
  • 20.
    Nurse-Family Partnership Evidence ofEffect Reductions in:  Maternal Unemployment.  Child abuse, neglect, and injuries (48%).  Child Arrests (59%) and Adjudications as PINS (90%) @ age 15.
  • 21.
    Promoting Alternative Thinking Strategies(PATHS) Description: Social and emotional competence Target: Grades K-5 Cost: $82/student Yr 1 (training & FT consultant included) Costs in Year 2 reduced by half Contact: Mark Greenberg, Ph.D., Director Prevention Research Center, Penn State University 110 HDFS-Henderson Building South University Park, PA 16802 814-863-0112
  • 22.
    PATHS Evidence of Effect •Decreased conduct problems, including aggression. • Improved self-control. • Improved understanding and recognition of emotions. • Improved conflict resolution strategies. • Improved cognitive planning.
  • 23.
    Bullying Prevention Program Description: Reductionof victim/bully problems Target: Grades 4-7 Cost: Full-time consultant, minimal classroom costs Contact: Dan Olweus, Ph.D. Research Center for Health Promotion (HEMIL) University of Bergen Christiesgt. 13, N-5015 Bergen, Norway 47-55-58-23-27
  • 24.
    Bullying Prevention Program Evidenceof Effect • Reductions in bully/victim problems of 50 percent. • Reductions in antisocial behavior (theft, vandalism, truancy). • Improvement in school climate.
  • 25.
    Seattle Social Development Project Description:Promote bonding to school and family by increasing youths’ opportunities, skills and recognition for prosocial involvement. Target: Grades 1-6 (ages 6-12) Contact: J. David Hawkins Ph.D. Social Development Research Group University of Washington www.sdrg.org
  • 26.
  • 27.
    Individual Characteristics Be Awareof… The Social Development Strategy The Goal… Healthy Behaviors …for all children and youth Healthy Beliefs and Clear Standards …in families, schools, and peer groups Ensure… Build… Bonding –Attachment –Commitment …to families, schools, and peer groups By providing… Opportunities Skills Recognition …in families, schools, and peer groups
  • 28.
    Seattle Social DevelopmentProject Core Components Teacher Training in Classroom Instruction and Management Parent Training in Behavior Management and Academic Support Child Social and Emotional Skill Development
  • 29.
    Proactive classroom management(grades 1-6) • Establish consistent classroom expectations and routines at the beginning of the year • Give clear, explicit instructions for behavior • Recognize and reward desirable student behavior and efforts to comply • Use methods that keep minor classroom disruptions from interrupting instruction Effective Direct Instruction (grades 1-6) • Assess and activate foundation knowledge before teaching • Teach to explicit learning objectives • Model skills to be learned • Frequently monitor student comprehension as material is presented • Re-teach material when necessary Cooperative learning (grades 1-6) • Involve small teams of students of different ability levels and backgrounds as learning partners • Provide recognition to teams for academic improvement of individual members over past performance Intervention Component: Teacher In-Service
  • 30.
    Parent Programs Raising HealthyChildren (grades 1-2) • Observe and pinpoint desirable and undesirable child behaviors  Teach expectations for behaviors  Provide consistent positive reinforcement for desired behavior  Provide consistent and moderate consequences for undesired behaviors Supporting School Success (grades 2-3) • Initiate conversation with teachers about children’s learning  Help children develop reading and math skills  Create a home environment supportive of learning Guiding Good Choices (grades 5-6) • Establish a family policy on drug use  Practice refusal skills with children  Use self-control skills to reduce family conflict  Create new opportunities in the family for children to contribute and learn
  • 31.
    Social, Cognitive and EmotionalSkills Training  Listening  Following directions  Social awareness (boundaries, taking perspective of others)  Sharing and working together  Manners and civility (please and thank you)  Compliments and encouragement  Problem solving  Emotional regulation (anger control)  Refusal skills
  • 32.
    Support Structures  SchoolStaff – Implementation team training – 7 days of teacher training – Coaching – Principal support  Family – Training in each parenting curriculum
  • 33.
    SSDP Intervention Effects Comparedto Controls 1 2 3 4 5 6 7 8 9 10 11 12 7 8 9 10 11 12 13 14 15 16 17 18 19 20 21 22 23 24 25 26 27 Control Full Intervention Late Tx Control Full Intervention Late Tx At the end of the 2nd grade • boys less aggressive • girls less self-destructive By the start of 5th grade, those in the full intervention had • less initiation of alcohol • less initiation of delinquency • better family management • better family communication • better family involvement • higher attachment to family • higher school rewards • higher school bonding Grade Age
  • 34.
    2.70 2.75 2.80 2.85 2.90 2.95 3.00 3.05 3.10 13 14 1516 17 18 Age Level of School Bonding Full Treatment Late Treatment Control Effects of SSDP Intervention on School Bonding from Age 13 to 18 Hawkins, Guo, Hill, Battin-Pearson & Abbott (2001)
  • 35.
    SSDP Intervention Effects Comparedto Controls 1 2 3 4 5 6 7 8 9 10 11 12 7 8 9 10 11 12 13 14 15 16 17 18 19 20 21 22 23 24 25 26 27 Control Full Intervention Late Tx Control Full Intervention Late Tx By age 18 Youths in the Full Intervention had less heavy alcohol use: less lifetime violence: fewer lifetime sex partners: less grade repetition: Grade Age 25.0% Control vs. 15.4% Full 59.7% Control vs. 48.3% Full 61.5% Control vs. 49.7% Full 22.8% Control vs. 14.0% Full
  • 36.
    SSDP Intervention Effects Comparedto Controls 1 2 3 4 5 6 7 8 9 10 11 12 7 8 9 10 11 12 13 14 15 16 17 18 19 20 21 22 23 24 25 26 27 Control Full Intervention Late Tx Control Full Intervention Late Tx Grade Age By age 21, full intervention group had: More high school graduates: More attending college: Fewer selling drugs: Fewer with a criminal record: 81% Control vs. 91% Full 6% Control vs. 14% Full 13% Control vs. 4% Full 53% Control vs. 42% Full
  • 37.
    Steve Aos, AssociateDirector Washington State Institute for Public Policy Phone: (360) 586-2768 E-mail: saos@wsipp.wa.gov Institute Publications: www.wa.gov/wsipp Benefits and Costs of Prevention and Early Intervention Programs for Youth
  • 38.
    Summary of Benefitsand Costs (2003 Dollars) Dollars Per Youth (PV lifecycle) Benefits Costs B - C Early Childhood Education $17,202 $7,301 $9,901 Nurse Family Partnership $26,298 $9,118 $17,180 Functional Family Therapy $16,455 $2,140 $14,315 Life Skills Training $746 $29 $717 Seattle Soc. Dev. Project $14,246 $4,590 $9,837 Guiding Good Choices $7,605 $687 $6,918 Multi-D Treat. Foster Care $26,748 $2,459 $24,290 Intensive Juv. Supervision $0 $1,482 -$1,482 Selected Findings Aggression Repl. Trng. $9,564 $759 $8,805 7 of 10 $3,957 Reduced crime $150 Reduced K-12 grade repetition $10,320 Increased high school graduation $14,426 Benefits Per Youth $4,590 $3.14 Benefits Per Dollar of Cost Cost Per Youth
  • 39.
    But… Prevention approaches thatdo not work or have not been evaluated have been more widely used than those shown to be effective. (Gottfredson & Gottfredson, 2002, Hallfors et al 2001, Ringwalt et al., 2002.)
  • 40.
    Empowering Communities to PreventYouth Violence  Youths in different neighborhoods and communities are exposed to different levels of risk and protection.
  • 41.
    Distribution of Riskin a City John A. Pollard ,P h.D. Developmental Research and Pr ograms No s tudents in t his a re a . In su f fic ie nt n um b e r of st u de n ts in this ar e a. N eighborhood #2 N eighborhood #1 N eighborhood #3
  • 42.
    M adison Middle School Risk Profile 8th Grade 0% 10% 20% 30% 40% 50% 60% 70% 80% 90% 100% L o w N e i g h b o r h o o d A t t a c h m e n t C o m m u n i t y D i s o r g a n i z a t i o n L a w s a n d N o r m s F a v o r a b l e t o D r u g U s e P e r c e i v e d A v a i l a b i l i t y o f D r u g s P e r c e i v e d A v a i l a b i l i t y o f H a n d g u n s P o o r F a m i l y M a n a g e m e n t F a m i l y C o n f l i c t F a m i l y H i s t o r y o f A n t i s o c i a l B e h a v i o r P a r e n t a l A t t i t u d e s F a v o r a b l e T o w a r d s D r u g U s e P a r e n t a l A t t i t u d e s F a v o r a b l e t o A n t i s o c i a l B e h a v i o r A c a d e m i c F a i l u r e L o w C o m m i t m e n t t o S c h o o l R e b e l l i o u s n e s s E a r l y P r o b l e m B e h a v i o r E a r l y I n i t i a t i o n o f D r u g U s e F a v o r a b l e A t t i t u d e s T o w a r d A n t i s o c i a l B e h a v i o r F a v o r a b l e A t t i t u d e s T o w a r d D r u g U s e L o w P e r c e i v e d R i s k s o f D r u g U s e F r i e n d s ' U s e o f D r u g s S e n s a t i o n S e e k i n g R e w a r d s f o r A n t i s o c i a l I n v o l v e m e n t O v e r a l l R i s k Pe r ce n t A t Risk School 2002 District 2002 Community Family School Survey Participation Rate 2002: 87.4% 2002 Estimated National Value Peer-Individual Madison Middle School Risk Profile 8th Grade 2002
  • 43.
    N ova High School Risk Profile 10th Grade 0% 10% 20% 30% 40% 50% 60% 70% 80% 90% 100% L o w N e i g h b o r h o o d A t t a c h m e n t C o m m u n i t y D i s o r g a n i z a t i o n L a w s a n d N o r m s F a v o r a b l e t o D r u g U s e P e r c e i v e d A v a i l a b i l i t y o f D r u g s P e r c e i v e d A v a i l a b i l i t y o f H a n d g u n s P o o r F a m i l y M a n a g e m e n t F a m i l y C o n f l i c t F a m i l y H i s t o r y o f A n t i s o c i a l B e h a v i o r P a r e n t a l A t t i t u d e s F a v o r a b l e T o w a r d s D r u g U s e P a r e n t a l A t t i t u d e s F a v o r a b l e t o A n t i s o c i a l B e h a v i o r * * A c a d e m i c F a i l u r e L o w C o m m i t m e n t t o S c h o o l R e b e l l i o u s n e s s E a r l y P r o b l e m B e h a v i o r E a r l y I n i t i a t i o n o f D r u g U s e F a v o r a b l e A t t i t u d e s T o w a r d A n t i s o c i a l B e h a v i o r F a v o r a b l e A t t i t u d e s T o w a r d D r u g U s e L o w P e r c e i v e d R i s k s o f D r u g U s e F r i e n d s ' U s e o f D r u g s S e n s a t i o n S e e k i n g R e w a r d s f o r A n t i s o c i a l I n v o l v e m e n t O v e r a l l R i s k Pe r ce n t A t Risk School 2002 District 2002 Community Family School Survey Participation Rate 2002: 79.7% 2002 Peer-Individual Estimated National Value Peer-Individual Nova High School Risk Profile 10th Grade 2002
  • 44.
    The Goal forCommunity Prevention To identify and address those risk factors that are most prevalent and those protective factors that are most depressed with tested and effective policies and programs.
  • 45.
    Challenges for Community Prevention To identify the community’s profile of risk and protection.  To address elevated risks and low protection with tested and effective preventive actions.  To evaluate outcomes to insure desired effects are achieved in the community.
  • 46.
    The Communities ThatCare Operating System Creating Communities That Care Get Started Get Organized Develop a Profile Create a Plan Implement and Evaluate
  • 47.
    The Communities ThatCare Operating System Creating Communities That Care Get Started Get Organized Develop a Profile Create a Plan Implement and Evaluate • Community readiness assessment. • Identification of key individuals, stakeholders, and organizations.
  • 48.
    The Communities ThatCare Operating System Creating Communities That Care Get Started Get Organized Develop a Profile Create a Plan Implement and Evaluate • Training key leaders and board in CTC • Building the community coalition.
  • 49.
    The Communities ThatCare Operating System Creating Communities That Care Get Started Get Organized Develop a Profile Create a Plan Implement and Evaluate • Collect risk/protective factor and outcome data. •Collect information on community resources • Construct a community profile from the data.
  • 50.
    Diffusion Consortium Project SocialDevelopment Research Group, University of Washington M adison M iddle School Risk Profile 8th Grade 0% 10% 20% 30% 40% 50% 60% 70% 80% 90% 100% L o w N e i g h b o r h o o d A t t a c h m e n t C o m m u n i t y D i s o r g a n i z a t i o n L a w s a n d N o r m s F a v o r a b l e t o D r u g U s e P e r c e i v e d A v a i l a b i l i t y o f D r u g s P e r c e i v e d A v a i l a b i l i t y o f H a n d g u n s P o o r F a m i l y M a n a g e m e n t F a m i l y C o n f l i c t F a m i l y H i s t o r y o f A n t i s o c i a l B e h a v i o r P a r e n t a l A t t i t u d e s F a v o r a b l e T o w a r d s D r u g U s e P a r e n t a l A t t i t u d e s F a v o r a b l e t o A n t i s o c i a l B e h a v i o r A c a d e m i c F a i l u r e L o w C o m m i t m e n t t o S c h o o l R e b e l l i o u s n e s s E a r l y P r o b l e m B e h a v i o r E a r l y I n i t i a t i o n o f D r u g U s e F a v o r a b l e A t t i t u d e s T o w a r d A n t i s o c i a l B e h a v i o r F a v o r a b l e A t t i t u d e s T o w a r d D r u g U s e L o w P e r c e i v e d R i s k s o f D r u g U s e F r i e n d s ' U s e o f D r u g s S e n s a t i o n S e e k i n g R e w a r d s f o r A n t i s o c i a l I n v o l v e m e n t O v e r a l l R i s k Pe r ce n t A t Risk School 2002 District 2002 Community Family School Survey Participation Rate 2002: 87.4% 2002 Estimated National Value Peer-Individual
  • 51.
    The Communities ThatCare Operating System Creating Communities That Care Get Started Get Organized Develop a Profile Create a Plan Implement and Evaluate • Define outcomes. •Prioritize factors to be targeted. • Select tested, effective interventions. • Create action plan. • Develop evaluation plan.
  • 52.
    Diffusion Consortium Project SocialDevelopment Research Group, University of Washington Addressing Barriers with Effective Action 3-5 Early Childhood Education prenatal-2 Prenatal/Infancy Programs 6-14 Family Therapy prenatal-14 Parent Training Family Management Problems Developmental Period Program Strategy Factor Addressed
  • 53.
    Diffusion Consortium Project SocialDevelopment Research Group, University of Washington Effective Training for Middle School Parents • Guiding Good Choices (Spoth et al., 1998) • Adolescent Transitions Program (Dishion and Andrews, 1995) • Parenting Adolescents Wisely (Gordon et al., 1998) • Creating Lasting Connections (Johnson et al., 1996) • Strengthening Families 10 to 14 Program (Spoth, 1998) • Focus on Families (Catalano et al., 1999; 1997)
  • 54.
    The Communities ThatCare Operating System Creating Communities That Care Get Started Get Organized Develop a Profile Create a Plan Implement and Evaluate • Form task forces. • Identify and train implementers. • Sustain collaborative relationships. • Evaluate processes and outcomes. • Adjust programming.
  • 55.
    The Communities ThatCare Prevention Operating System is available at: http://preventionplatform.samhsa.gov/
  • 56.
    Summary and Implications Organizationsconcerned with violence and health and behavior problems of youth should:  Collect epidemiologic data on levels of risk and protective factors to focus community action on the most elevated risks.  Collaborate to strengthen protection and reduce shared risks for these problems.
  • 57.
    Summary and Implications Tested and effective policies and programs for preventing youth violence are available.  Use tested and effective approaches where possible and appropriate.  Support rigorous evaluation of these approaches in these new contexts.
  • 58.
    Using Prevention Science toGuide Community Action J. David Hawkins, Ph.D. Endowed Professor of Prevention Social Development Research Group School of Social Work University of Washington jdh@u.washington.edu www.sdrg.org