![FORMULA PLANS When the theories do not take us far to success in the stock price prediction and in making gain in operations, then practical tricks of the trade can be done. When the prices are falling purchase has to be done and when the prices are rising selling has to be done. The above automatic formula rules should lay down : When to purchase In what quantity Selection of scrips The implementation or execution of the plan at least cost [Cost of deals and incidentals] 10](https://image.slidesharecdn.com/pptpresentationofsecurityanaly-12719122251802-phpapp02/75/Presentation-Of-Security-Analy-11-2048.jpg)
![EBT = [ R + ( R – I ) L/E ] E Where R is Average Return on Investments or Assets and I is Interest Cost on Liabilities other than Equity . EAT = EBT – CORPORATE TAX EPS = EAT / NO. OF SHARES MP = EPS X P/E Where P/E is Price Earning Ratio of past can be taken HPY [Holding Period Yield] = (FV – PV + D)/PV Where PV is present value, FV is future value and D is dividend paid per share. 11 FORECASTING EARNINGS](https://image.slidesharecdn.com/pptpresentationofsecurityanaly-12719122251802-phpapp02/75/Presentation-Of-Security-Analy-12-2048.jpg)


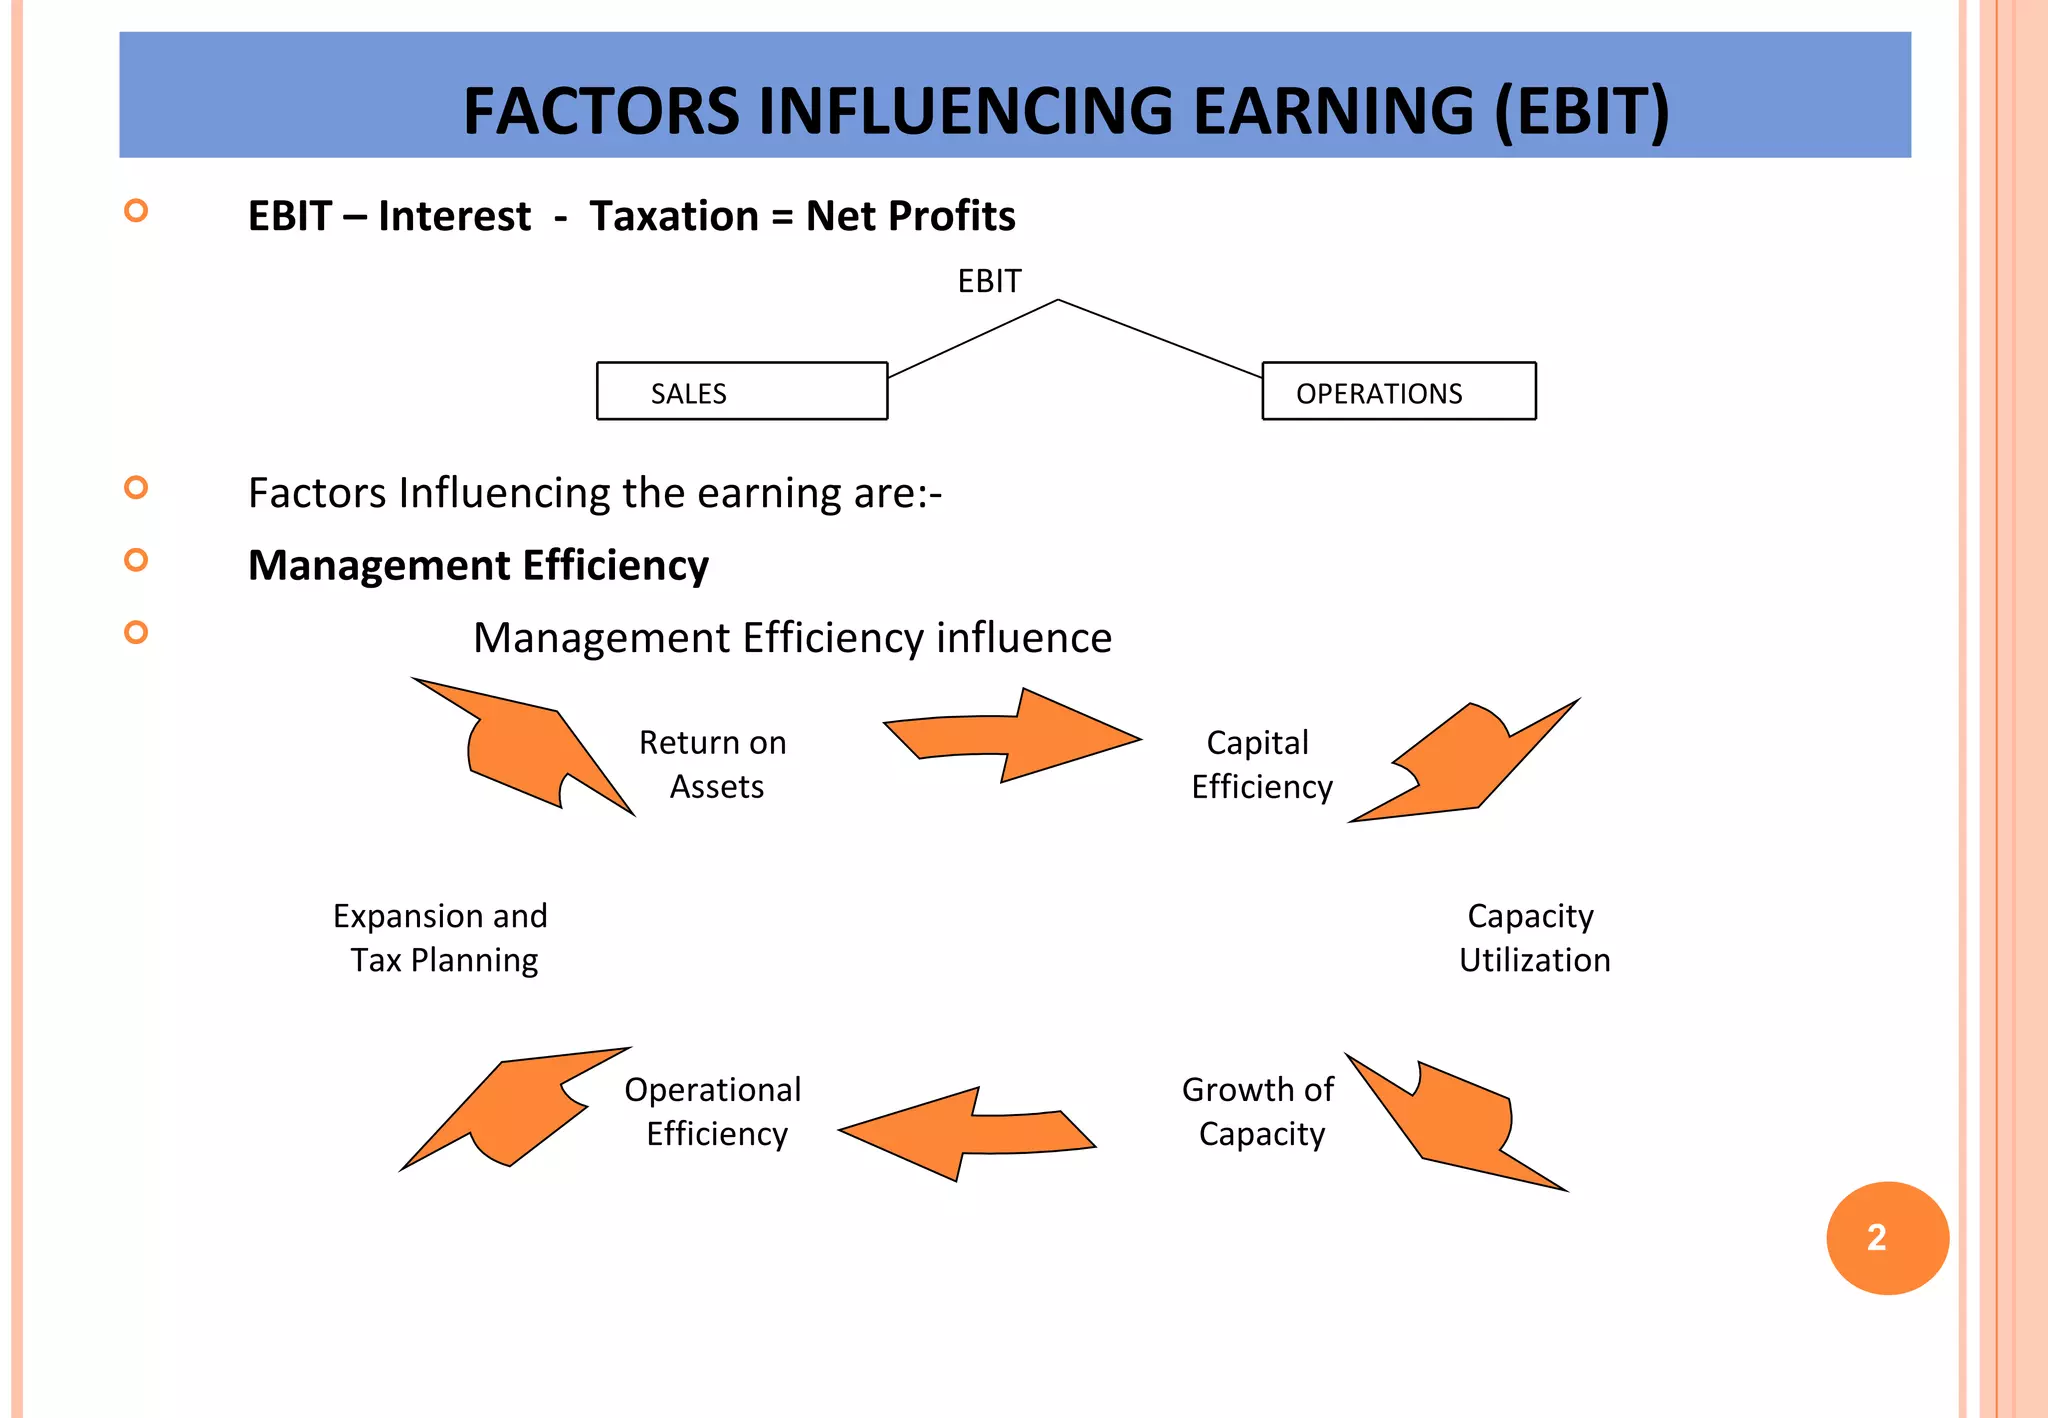
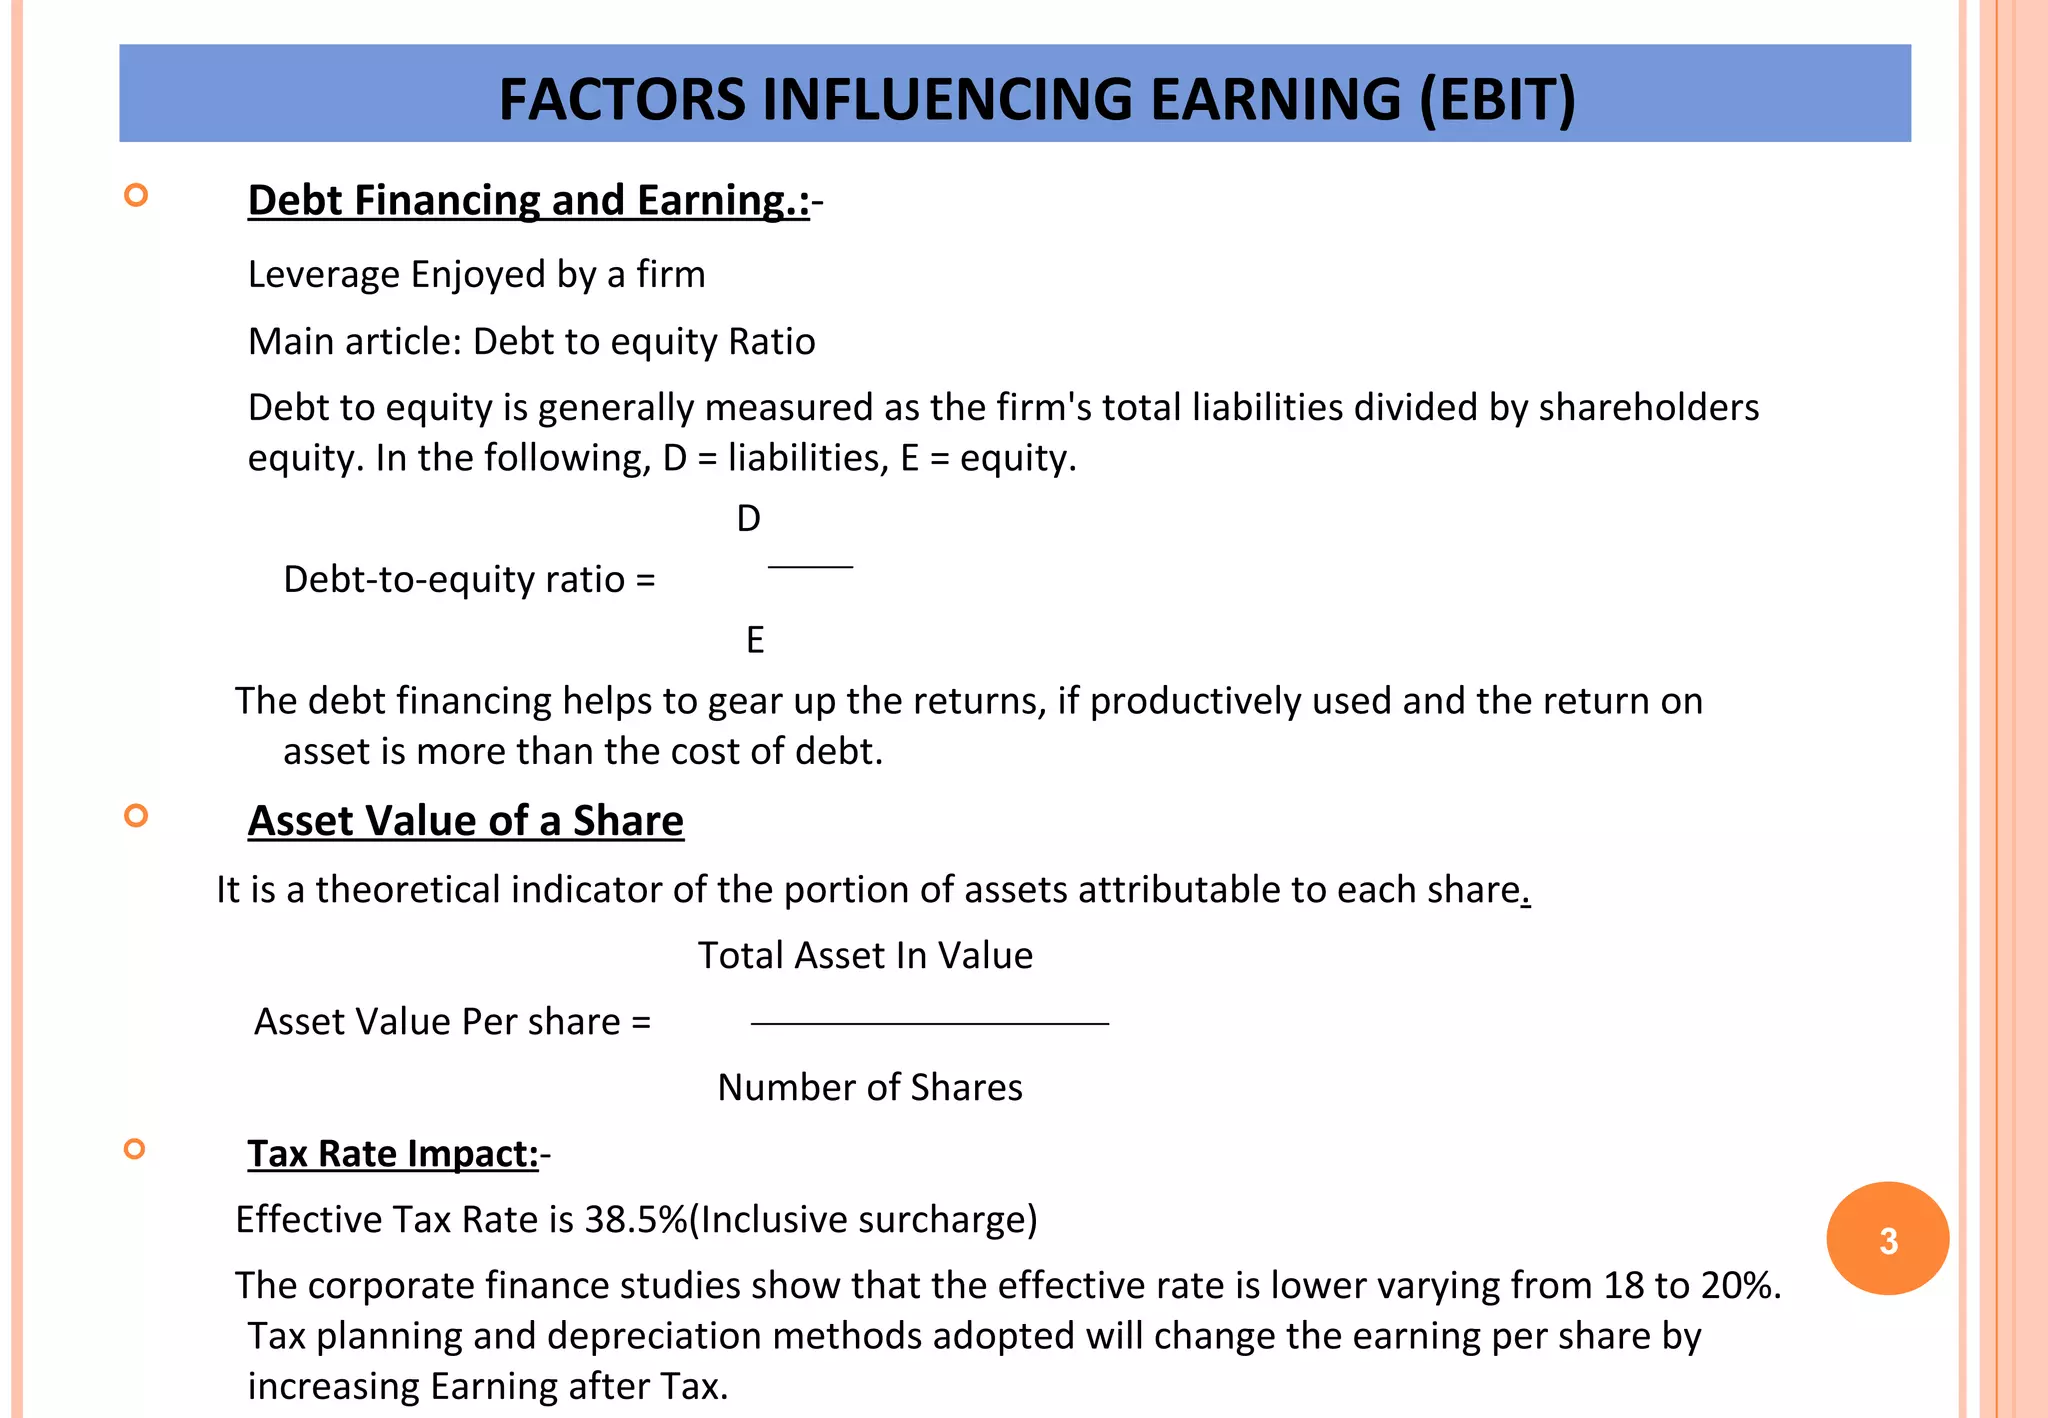
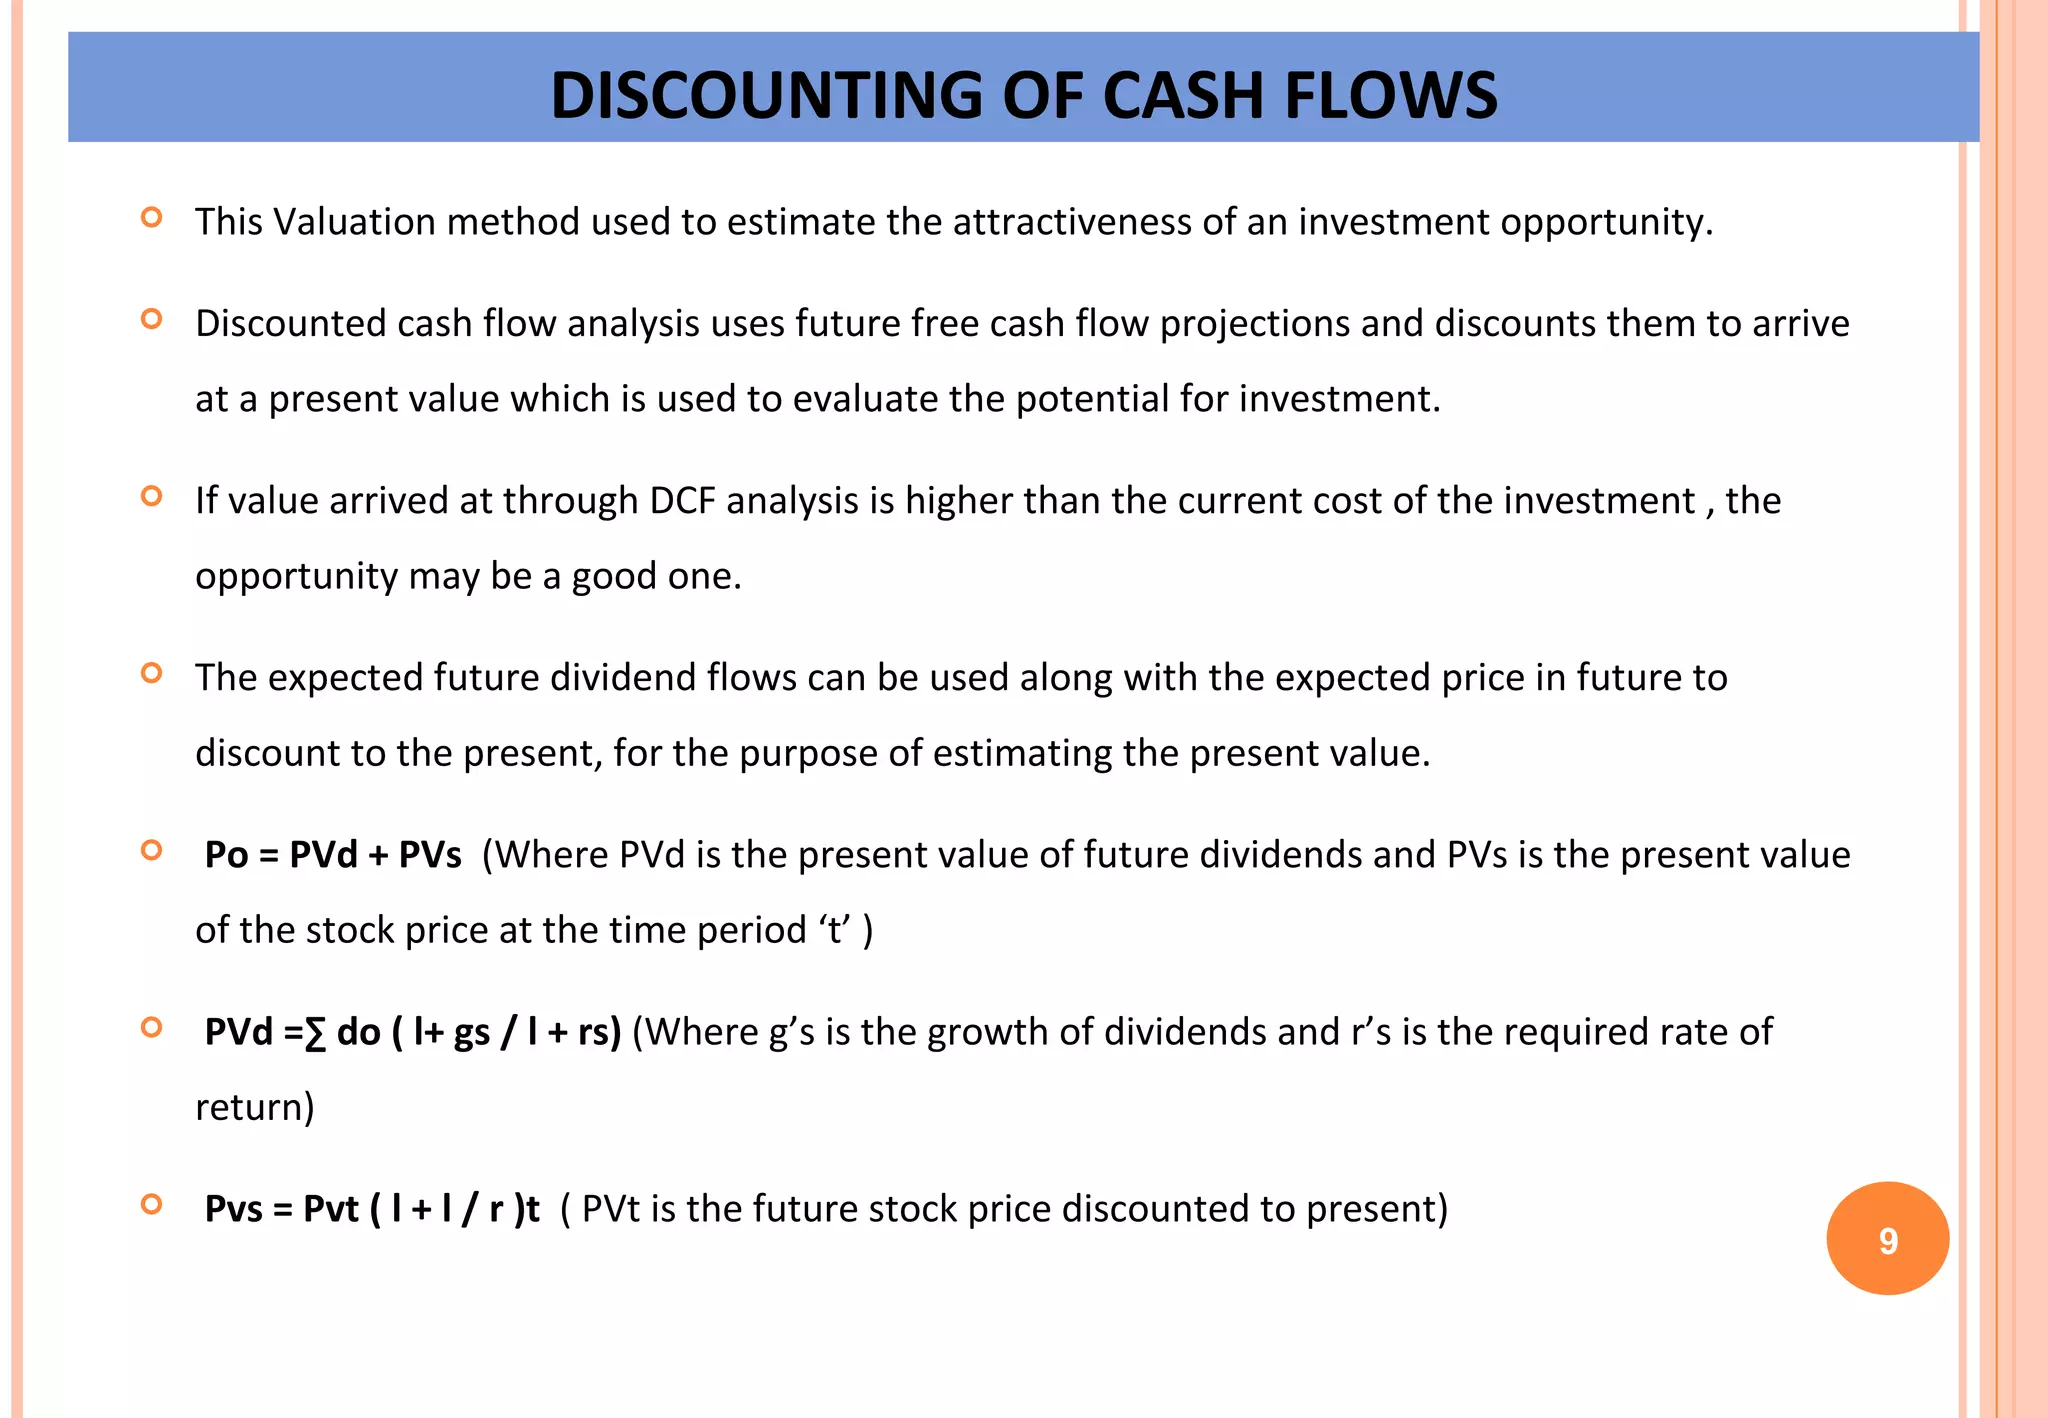
The document discusses factors that influence company earnings and forecasts. It covers topics like earnings before interest and taxes (EBIT), return on assets, earnings per share, leverage, tax rates, fixed and variable costs, and break-even point analysis. Management efficiency, sales, capacity utilization, debt financing, asset value, and tax planning can all impact EBIT. Forecasting individual revenue and expense items provides the most scientific way to estimate earnings, which are used along with the price-earnings ratio to deduce expected market price. Companies with large capital investments have high break-even points and longer periods to generate profits and dividends.


