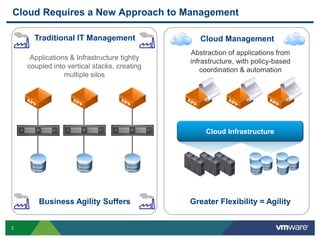
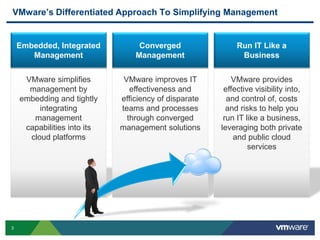
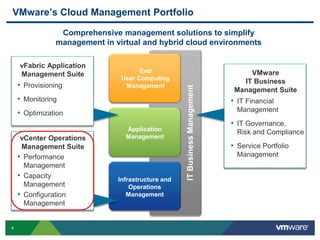
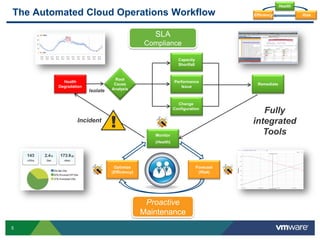
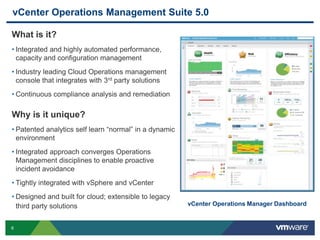
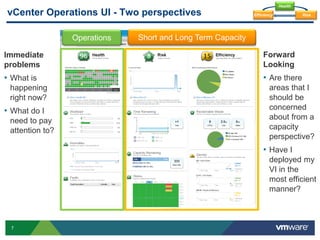
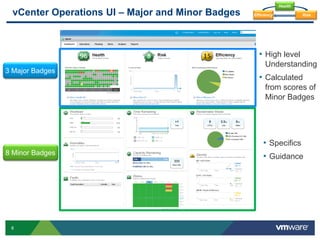
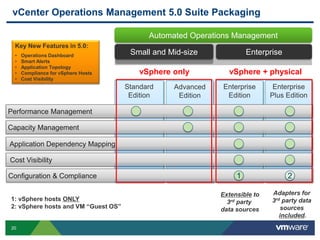
© 2012 VMware Inc. All rights reserved
Managing the virtual environment
Ashley Davies
VMware
2
Cloud Requires a New Approach to Management
Traditional IT Management
Applications & Infrastructure tightly
coupled into vertical stacks, creating
multiple silos
Business Agility Suffers Greater Flexibility = Agility
Cloud Management
Abstraction of applications from
infrastructure, with policy-based
coordination & automation
Cloud Infrastructure
3
VMware’s Differentiated Approach To Simplifying Management
VMware simplifies
management by
embedding and tightly
integrating
management
capabilities into its
cloud platforms
Embedded, Integrated
Management
VMware improves IT
effectiveness and
efficiency of disparate
teams and processes
through converged
management solutions
Converged
Management
VMware provides
effective visibility into,
and control of, costs
and risks to help you
run IT like a business,
leveraging both private
and public cloud
services
Run IT Like a
Business
4
VMware’s Cloud Management Portfolio
ITBusinessManagement
Application
Management
End
User Computing
Management
Infrastructure and
Operations
Management
vFabric Application
Management Suite
• Provisioning
• Monitoring
• Optimization
VMware
IT Business
Management Suite
• IT Financial
Management
• IT Governance,
Risk and Compliance
• Service Portfolio
Management
Comprehensive management solutions to simplify
management in virtual and hybrid cloud environments
vCenter Operations
Management Suite
• Performance
Management
• Capacity
Management
• Configuration
Management
5
The Automated Cloud Operations Workflow
Health
Degradation
Root
Cause
AnalysisIsolate
Performance
Issue
Change
Configuration
Capacity
Shortfall
SLA
Compliance
Proactive
Maintenance
Forecast
(Risk)
Optimize
(Efficiency)
Monitor
(Health)
Incident
!
Health
RiskEfficiency
Fully
integrated
Tools
Remediate
6
vCenter Operations Management Suite 5.0
vCenter Operations Manager Dashboard
What is it?
• Integrated and highly automated performance,
capacity and configuration management
• Industry leading Cloud Operations management
console that integrates with 3rd party solutions
• Continuous compliance analysis and remediation
Why is it unique?
• Patented analytics self learn “normal” in a dynamic
environment
• Integrated approach converges Operations
Management disciplines to enable proactive
incident avoidance
• Tightly integrated with vSphere and vCenter
• Designed and built for cloud; extensible to legacy
third party solutions
7
vCenter Operations UI - Two perspectives
Immediate
problems
• What is
happening
right now?
• What do I
need to pay
attention to?
Operations Short and Long Term Capacity
Forward
Looking
• Are there
areas that I
should be
concerned
about from a
capacity
perspective?
• Have I
deployed my
VI in the
most efficient
manner?
Health
RiskEfficiency
8
vCenter Operations UI – Major and Minor Badges
• High level
Understanding
• Calculated
from scores of
Minor Badges
3 Major Badges
8 Minor Badges
• Specifics
• Guidance
Health
RiskEfficiency
9
Cloud Operations Workflow – High-Level Indicators
Health: indication of immediate performance
and availability issues
• Consolidates thousands of metrics into a single
indicator of well-being
• Investigate and triage these first
Risk: projection of future capacity and
availability issues
• Trends long-term behavior and projects forward
• Some risk issues can be near-term, but to be
addressed after Health issues
Efficiency: identification of opportunities for
optimization
• Does not identify problems, but points our areas
for improvements
• Tackle these issues after Health and Risk issues
1
2
3
Health
RiskEfficiency
10
Operations: Major Badge – Health
Health
RiskEfficiency
“How is our world doing?” One Source of Truth Across the Enterprise
 Health Score - Objective measure of performance
based on underlying level of abnormal behavior
 High Health is good (100-0)
 Identifies current problems in the systems
 Issues that need to be resolved immediately to avoid
problems
 Analytics based, calculated from 3 minor badges
(Workload, Anomalies, Faults)
 For any resource or grouping:
 A single Server, Device, Resource
 Entire Tier or Silo
 Entire Application or Service
 Entire Datacenter
 Any Arbitrary Group of Resources
Heatmap
-> Provides quick view of many objects at once
-> Shows Health of all parent and child objects
-> Go back in time (6 hours) and see the
“weather” of the Virtual Infrastructure
11
Capacity Planning – Risk
Are there future risks to my systems
and virtual Infrastructure?
Risk score over the last 7 days
Low risk is good (0-100)
Identifies potential problems that could
eventually hurt the performance
Health
RiskEfficiency
Minor badges
12
Capacity Planning: Forecast - “What-If” Analysis
Current capacity
cross-over point
Actual VMs
deployed
VM count
capacity
Capacity state
today
New capacity
shortfall if I add
10 new VMs
Health
RiskEfficiency
13
Capacity Planning: Major Badge – Efficiency
 Are there optimization opportunities in
my systems?
• Save £££ by better utilizing resources
 How to run a leaner datacenter
 High Efficiency is good (100-0)
 Graph Depicts VMs by Percent
• Optimal – Optimally Provisioned VMs
• Waste – Over Provisioned VMs
• Stress – Under Provisioned VMs
 Efficiency Score calculated from Minor
Badges
• Reclaimable Waste
• Density
 Three Resources Considered
• CPU
• Memory
• Disk Space
Health
RiskEfficiency
14
Sub-Badges - Optimization Opportunities
 Reclaimable Waste: lists excessive
resource allocation
• Identifies VMs with too many
CPUs/vRAM and hosts with too few VMs
 Density: computes the ideal
consolidation ratio
• Computes optimal VMs per host to
maximize resource utilization without
sacrificing performance
Health
RiskEfficiency
15
Opportunities for more efficiency?
 On average, customers find out that 90% of their VMs are
overprovisioned
Health
RiskEfficiency
16
Business cases around Capacity Costs Avoidance
Capacity Management analyses findings from a real customer site
 Immediate opportunities for:
• Better consolidation ratios
• Deferred investments in servers and related additional hardware and software (Network & Storage
connectivity, OS….)
• Storage Reallocation:
• Deferred investments. Costs savings based on Storage Tiers (340 k$ for Tier 1 Storage)
• License costs savings
• vRAM/CPU based software licensing – vSphere!
• Depends on application software licensing model
Health
RiskEfficiency
VM type Quantity Resources Possible savings
Idle 265 vCPU 2226
Powered off 502 vRAM 9.2 TB
Oversized 6879 Disk Space 22.5 TB
17
Smart Alerts – Before problems happen….
Overview
 Proactive alerts that provide early
warning on building issues
 Identify upcoming health,
performance and capacity issues
 Automatic root cause analysis of
offending metrics across all layers
Benefits
 Advance notification of abnormal
behavior help avoid incidents
 Immediately focus on the root cause
rather than symptoms or false alerts
Root cause and
potential impact
Early warning
Smart Alert
Health
RiskEfficiency
18
Application and Infrastructure Dependency Mapping
Overview
 Automated Discovery and
Visualization of Application and
Infrastructure Dependencies
 Pre-built knowledge base for easy
and accurate labeling of
application names and version
numbers
 Integrated with Site Recovery Mgr
for more complete DR protection
Benefits
 Application-aware operations
management eliminates risk of
human error
Visualize application dependencies
and DR-protection status
Automated discovery of application
services, relationships and
infrastructure dependencies
Health
RiskEfficiency
19
Example of OPEX Savings with vCenter Operations
Before
 400 critical alerts/hour
 End user complaints
alerted IT to the problem
 End users impacted (avg. 2
hours/outage)
 12 Level-2 engineers on
bridge call to address
problem
After
 20 alerts/MONTH
 3 hours advanced warning
of slowdown w/root cause
 NO end user impact
 1 Level-2 Engineer and 1
DBA to address problems
Learn Normal
Smart Alerting
Root Cause
Solve performance
issues BEFORE
end users are affected
and reduce total alerts
20
Enterprise
vCenter Operations Management 5.0 Suite Packaging
Automated Operations Management
Small and Mid-size
Enterprise
Plus Edition
Enterprise
Edition
Standard
Edition
Advanced
Edition
Performance Management
Capacity Management
Application Dependency Mapping
Cost Visibility
Extensible to
3rd party
data sources
Adapters for
3rd party data
sources
included.
Configuration & Compliance 1 2
vSphere only
1: vSphere hosts ONLY
2: vSphere hosts and VM “Guest OS”
vSphere + physical
Key New Features in 5.0:
• Operations Dashboard
• Smart Alerts
• Application Topology
• Compliance for vSphere Hosts
• Cost Visibility
21
vCenter Operations Customer success story: TUI InfoTec
Industry
Headquarters
Employees
“Through virtualization we have established the foundation for our IT
Transformation. However, the pace and scale of our operations has
greatly accelerated, and our current approach to IT Management is
standing in the way of our ability to achieve the agility and operational
efficiency we need. VMware uniquely understands the challenges we
face. Their strategy and solutions will deliver a modern approach to
IT management that will enable us to take the next step in our
journey to the cloud.”
— Helmut Clemens, Head of Windows Operations, TUI InfoTec
Objectives
• Reduce existing performance issues
• To have the ability to measure end to end performance
VMware Solution
• vCenter Operations has provided simple analysis of any problem
areas in the existing infrastructure. It has also allowed the IT team
to determine the level of normal latency on storage, enabling an
alert when the storage latency threshold is exceeded
Business Impact
• 50% reduction in time taken to troubleshoot issues
• Improved operational efficiency and performance of existing
infrastructure
PROFILE
Information Technology
Germany
420
VMWARE PRODUCTS & SERVICES
• VMware vSphere
• VMware vCenter Operations
• VMware View
• VMware ThinApp
• PSO: TAM
Podcast available on www.briefingsdirect.com
22
Automating Your Cloud Operations – Summary
 Purpose Built for dynamic Cloud environments – best for vSphere
 Proactive smart alerts for service health degradation before end users are
impacted – patented analytics & actionable intelligence
 Visibility into capacity and configuration changes and understanding of
correlation with performance issues
 Issues fixed quickly through right-click remediation
Q & A
Thank You!

Presentation managing the virtual environment

  • 1.
    © 2012 VMwareInc. All rights reserved Managing the virtual environment Ashley Davies VMware
  • 2.
    2 Cloud Requires aNew Approach to Management Traditional IT Management Applications & Infrastructure tightly coupled into vertical stacks, creating multiple silos Business Agility Suffers Greater Flexibility = Agility Cloud Management Abstraction of applications from infrastructure, with policy-based coordination & automation Cloud Infrastructure
  • 3.
    3 VMware’s Differentiated ApproachTo Simplifying Management VMware simplifies management by embedding and tightly integrating management capabilities into its cloud platforms Embedded, Integrated Management VMware improves IT effectiveness and efficiency of disparate teams and processes through converged management solutions Converged Management VMware provides effective visibility into, and control of, costs and risks to help you run IT like a business, leveraging both private and public cloud services Run IT Like a Business
  • 4.
    4 VMware’s Cloud ManagementPortfolio ITBusinessManagement Application Management End User Computing Management Infrastructure and Operations Management vFabric Application Management Suite • Provisioning • Monitoring • Optimization VMware IT Business Management Suite • IT Financial Management • IT Governance, Risk and Compliance • Service Portfolio Management Comprehensive management solutions to simplify management in virtual and hybrid cloud environments vCenter Operations Management Suite • Performance Management • Capacity Management • Configuration Management
  • 5.
    5 The Automated CloudOperations Workflow Health Degradation Root Cause AnalysisIsolate Performance Issue Change Configuration Capacity Shortfall SLA Compliance Proactive Maintenance Forecast (Risk) Optimize (Efficiency) Monitor (Health) Incident ! Health RiskEfficiency Fully integrated Tools Remediate
  • 6.
    6 vCenter Operations ManagementSuite 5.0 vCenter Operations Manager Dashboard What is it? • Integrated and highly automated performance, capacity and configuration management • Industry leading Cloud Operations management console that integrates with 3rd party solutions • Continuous compliance analysis and remediation Why is it unique? • Patented analytics self learn “normal” in a dynamic environment • Integrated approach converges Operations Management disciplines to enable proactive incident avoidance • Tightly integrated with vSphere and vCenter • Designed and built for cloud; extensible to legacy third party solutions
  • 7.
    7 vCenter Operations UI- Two perspectives Immediate problems • What is happening right now? • What do I need to pay attention to? Operations Short and Long Term Capacity Forward Looking • Are there areas that I should be concerned about from a capacity perspective? • Have I deployed my VI in the most efficient manner? Health RiskEfficiency
  • 8.
    8 vCenter Operations UI– Major and Minor Badges • High level Understanding • Calculated from scores of Minor Badges 3 Major Badges 8 Minor Badges • Specifics • Guidance Health RiskEfficiency
  • 9.
    9 Cloud Operations Workflow– High-Level Indicators Health: indication of immediate performance and availability issues • Consolidates thousands of metrics into a single indicator of well-being • Investigate and triage these first Risk: projection of future capacity and availability issues • Trends long-term behavior and projects forward • Some risk issues can be near-term, but to be addressed after Health issues Efficiency: identification of opportunities for optimization • Does not identify problems, but points our areas for improvements • Tackle these issues after Health and Risk issues 1 2 3 Health RiskEfficiency
  • 10.
    10 Operations: Major Badge– Health Health RiskEfficiency “How is our world doing?” One Source of Truth Across the Enterprise  Health Score - Objective measure of performance based on underlying level of abnormal behavior  High Health is good (100-0)  Identifies current problems in the systems  Issues that need to be resolved immediately to avoid problems  Analytics based, calculated from 3 minor badges (Workload, Anomalies, Faults)  For any resource or grouping:  A single Server, Device, Resource  Entire Tier or Silo  Entire Application or Service  Entire Datacenter  Any Arbitrary Group of Resources Heatmap -> Provides quick view of many objects at once -> Shows Health of all parent and child objects -> Go back in time (6 hours) and see the “weather” of the Virtual Infrastructure
  • 11.
    11 Capacity Planning –Risk Are there future risks to my systems and virtual Infrastructure? Risk score over the last 7 days Low risk is good (0-100) Identifies potential problems that could eventually hurt the performance Health RiskEfficiency Minor badges
  • 12.
    12 Capacity Planning: Forecast- “What-If” Analysis Current capacity cross-over point Actual VMs deployed VM count capacity Capacity state today New capacity shortfall if I add 10 new VMs Health RiskEfficiency
  • 13.
    13 Capacity Planning: MajorBadge – Efficiency  Are there optimization opportunities in my systems? • Save £££ by better utilizing resources  How to run a leaner datacenter  High Efficiency is good (100-0)  Graph Depicts VMs by Percent • Optimal – Optimally Provisioned VMs • Waste – Over Provisioned VMs • Stress – Under Provisioned VMs  Efficiency Score calculated from Minor Badges • Reclaimable Waste • Density  Three Resources Considered • CPU • Memory • Disk Space Health RiskEfficiency
  • 14.
    14 Sub-Badges - OptimizationOpportunities  Reclaimable Waste: lists excessive resource allocation • Identifies VMs with too many CPUs/vRAM and hosts with too few VMs  Density: computes the ideal consolidation ratio • Computes optimal VMs per host to maximize resource utilization without sacrificing performance Health RiskEfficiency
  • 15.
    15 Opportunities for moreefficiency?  On average, customers find out that 90% of their VMs are overprovisioned Health RiskEfficiency
  • 16.
    16 Business cases aroundCapacity Costs Avoidance Capacity Management analyses findings from a real customer site  Immediate opportunities for: • Better consolidation ratios • Deferred investments in servers and related additional hardware and software (Network & Storage connectivity, OS….) • Storage Reallocation: • Deferred investments. Costs savings based on Storage Tiers (340 k$ for Tier 1 Storage) • License costs savings • vRAM/CPU based software licensing – vSphere! • Depends on application software licensing model Health RiskEfficiency VM type Quantity Resources Possible savings Idle 265 vCPU 2226 Powered off 502 vRAM 9.2 TB Oversized 6879 Disk Space 22.5 TB
  • 17.
    17 Smart Alerts –Before problems happen…. Overview  Proactive alerts that provide early warning on building issues  Identify upcoming health, performance and capacity issues  Automatic root cause analysis of offending metrics across all layers Benefits  Advance notification of abnormal behavior help avoid incidents  Immediately focus on the root cause rather than symptoms or false alerts Root cause and potential impact Early warning Smart Alert Health RiskEfficiency
  • 18.
    18 Application and InfrastructureDependency Mapping Overview  Automated Discovery and Visualization of Application and Infrastructure Dependencies  Pre-built knowledge base for easy and accurate labeling of application names and version numbers  Integrated with Site Recovery Mgr for more complete DR protection Benefits  Application-aware operations management eliminates risk of human error Visualize application dependencies and DR-protection status Automated discovery of application services, relationships and infrastructure dependencies Health RiskEfficiency
  • 19.
    19 Example of OPEXSavings with vCenter Operations Before  400 critical alerts/hour  End user complaints alerted IT to the problem  End users impacted (avg. 2 hours/outage)  12 Level-2 engineers on bridge call to address problem After  20 alerts/MONTH  3 hours advanced warning of slowdown w/root cause  NO end user impact  1 Level-2 Engineer and 1 DBA to address problems Learn Normal Smart Alerting Root Cause Solve performance issues BEFORE end users are affected and reduce total alerts
  • 20.
    20 Enterprise vCenter Operations Management5.0 Suite Packaging Automated Operations Management Small and Mid-size Enterprise Plus Edition Enterprise Edition Standard Edition Advanced Edition Performance Management Capacity Management Application Dependency Mapping Cost Visibility Extensible to 3rd party data sources Adapters for 3rd party data sources included. Configuration & Compliance 1 2 vSphere only 1: vSphere hosts ONLY 2: vSphere hosts and VM “Guest OS” vSphere + physical Key New Features in 5.0: • Operations Dashboard • Smart Alerts • Application Topology • Compliance for vSphere Hosts • Cost Visibility
  • 21.
    21 vCenter Operations Customersuccess story: TUI InfoTec Industry Headquarters Employees “Through virtualization we have established the foundation for our IT Transformation. However, the pace and scale of our operations has greatly accelerated, and our current approach to IT Management is standing in the way of our ability to achieve the agility and operational efficiency we need. VMware uniquely understands the challenges we face. Their strategy and solutions will deliver a modern approach to IT management that will enable us to take the next step in our journey to the cloud.” — Helmut Clemens, Head of Windows Operations, TUI InfoTec Objectives • Reduce existing performance issues • To have the ability to measure end to end performance VMware Solution • vCenter Operations has provided simple analysis of any problem areas in the existing infrastructure. It has also allowed the IT team to determine the level of normal latency on storage, enabling an alert when the storage latency threshold is exceeded Business Impact • 50% reduction in time taken to troubleshoot issues • Improved operational efficiency and performance of existing infrastructure PROFILE Information Technology Germany 420 VMWARE PRODUCTS & SERVICES • VMware vSphere • VMware vCenter Operations • VMware View • VMware ThinApp • PSO: TAM Podcast available on www.briefingsdirect.com
  • 22.
    22 Automating Your CloudOperations – Summary  Purpose Built for dynamic Cloud environments – best for vSphere  Proactive smart alerts for service health degradation before end users are impacted – patented analytics & actionable intelligence  Visibility into capacity and configuration changes and understanding of correlation with performance issues  Issues fixed quickly through right-click remediation
  • 23.