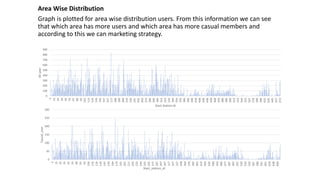
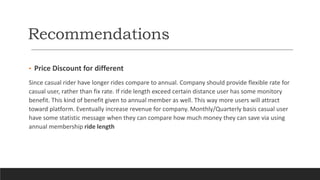
How Does a Bike-Share
Navigate Speedy Success?
DIP PATEL
12/11/2021
Table of Content
• Business Objective
• Business task
• Visualization and key findings
• Recommendation
• Description Of data
Business Objective
• Cyclistic, a bike-share company in Chicago that features more than 5,800 bicycles and 600
docking stations. The director of marketing believes the company’s future success depends on
maximizing the number of annual memberships. Therefore, management wants to understand
how casual riders and annual members use Cyclistic bikes differently.
• Annual members are much more profitable than casual riders, what must be done to convert
casual members into annual members.
Business task
• How do annual members and casual riders use Cyclistic bikes differently ?
• Why would casual riders buy Cyclistic annual memberships?
• How can Cyclistic use digital media to influence casual riders to become members?
Visualization and key finding
Number of users :
From the viz we can see that annual members are more compare to annual members. But there is big
opportunity for company by converting this casual members into annual members.
23458
60280
0
10000
20000
30000
40000
50000
60000
70000
Total
casual
member
Users Distribution by Weekday
We can conclude that both causal as well annual members are more active on weekends. (1=Sunday & 7 = Saturday)
1 2 3 4 5 6 7
casual 6426 2662 3644 1777 2429 2479 4041
member 11262 7962 9022 6825 9147 7355 8707
0
2000
4000
6000
8000
10000
12000
Mean ride length:
Though annual members are higher than casual users, there mean time varying drastically.
Same thing verified by weekly distribution.
Total
casual 12:42:21 AM
member 12:18:30 AM
12:00:00 AM
12:07:12 AM
12:14:24 AM
12:21:36 AM
12:28:48 AM
12:36:00 AM
12:43:12 AM
12:50:24 AM
1 2 3 4 5 6 7
casual 12:45:12 AM 12:36:47 AM 12:44:24 AM 12:38:04 AM 12:36:05 AM 12:41:38 AM 12:45:43 AM
member 12:21:31 AM 12:17:40 AM 12:18:31 AM 12:16:19 AM 12:16:09 AM 12:17:51 AM 12:20:02 AM
12:00:00 AM
12:07:12 AM
12:14:24 AM
12:21:36 AM
12:28:48 AM
12:36:00 AM
12:43:12 AM
12:50:24 AM
Max ride length:
Max ride length for members.
Same thing verified by weekly distribution.
Total
casual 11:58:33 PM
member 11:56:39 PM
11:58:33 PM
11:56:39 PM
11:55:41 PM
11:56:24 PM
11:57:07 PM
11:57:50 PM
11:58:34 PM
11:59:17 PM
1 2 3 4 5 6 7
casual 11:50:16 PM 10:28:30 PM 11:55:10 PM 11:55:10 PM 9:58:41 PM 11:58:33 PM 11:55:57 PM
member 11:56:29 PM 11:17:37 PM 11:56:39 PM 11:34:32 PM 10:25:18 PM 11:31:50 PM 11:26:52 PM
8:38:24 PM
9:07:12 PM
9:36:00 PM
10:04:48 PM
10:33:36 PM
11:02:24 PM
11:31:12 PM
12:00:00 AM
12:28:48 AM
Area Wise Distribution
Graph is plotted for area wise distribution users. From this information we can see
that which area has more users and which area has more casual members and
according to this we can marketing strategy.
0
100
200
300
400
500
600
700
800
900 2
14
24
34
44
54
67
80
92
102
114
124
134
145
157
167
177
188
199
209
219
230
241
252
262
274
284
294
304
314
324
334
344
354
370
384
396
408
418
428
438
448
458
468
479
489
499
509
523
533
544
555
567
578
589
599
622
635
645
657
672
All
user
Start Station Id
0
50
100
150
200
250
300
2
15
25
35
45
55
68
81
93
106
116
126
136
147
159
169
179
191
201
211
223
233
244
255
265
277
287
297
307
317
327
337
348
364
376
392
403
414
424
434
446
456
466
477
487
497
507
520
533
550
567
580
591
601
624
638
660
Casual_user
Start_station_id
Recommendations
• Price Discount for different
Since casual rider have longer rides compare to annual. Company should provide flexible rate for
casual user, rather than fix rate. If ride length exceed certain distance user has some monitory
benefit. This kind of benefit given to annual member as well. This way more users will attract
toward platform. Eventually increase revenue for company. Monthly/Quarterly basis casual user
have some statistic message when they can compare how much money they can save via using
annual membership ride length
• Promotion/Publicity
Social media is effective tools for advertisement. Target particular region which have more
users and where more potential. Digital platform (Facebook, Instagram, linkdin...) are quite
effective compare to traditional ways.
• Marketing Strategy
Create effective add which clearly states that you have bike experience of any bike at anytime
without having one. Another strategy should be added for renting vehicle, where owner and
user both have benefit.
Data Description
• Data source :
This data is provided by Cyclistic itself. (Note: The datasets have a different name because Cyclistic
is a fictional company.) Data is stored locally.
• Data privacy and securities:
The data has been made available by Motivate International Inc. under this license.
Thank you

Presentation

  • 1.
    How Does aBike-Share Navigate Speedy Success? DIP PATEL 12/11/2021
  • 2.
    Table of Content •Business Objective • Business task • Visualization and key findings • Recommendation • Description Of data
  • 3.
    Business Objective • Cyclistic,a bike-share company in Chicago that features more than 5,800 bicycles and 600 docking stations. The director of marketing believes the company’s future success depends on maximizing the number of annual memberships. Therefore, management wants to understand how casual riders and annual members use Cyclistic bikes differently. • Annual members are much more profitable than casual riders, what must be done to convert casual members into annual members.
  • 4.
    Business task • Howdo annual members and casual riders use Cyclistic bikes differently ? • Why would casual riders buy Cyclistic annual memberships? • How can Cyclistic use digital media to influence casual riders to become members?
  • 5.
    Visualization and keyfinding Number of users : From the viz we can see that annual members are more compare to annual members. But there is big opportunity for company by converting this casual members into annual members. 23458 60280 0 10000 20000 30000 40000 50000 60000 70000 Total casual member
  • 6.
    Users Distribution byWeekday We can conclude that both causal as well annual members are more active on weekends. (1=Sunday & 7 = Saturday) 1 2 3 4 5 6 7 casual 6426 2662 3644 1777 2429 2479 4041 member 11262 7962 9022 6825 9147 7355 8707 0 2000 4000 6000 8000 10000 12000
  • 7.
    Mean ride length: Thoughannual members are higher than casual users, there mean time varying drastically. Same thing verified by weekly distribution. Total casual 12:42:21 AM member 12:18:30 AM 12:00:00 AM 12:07:12 AM 12:14:24 AM 12:21:36 AM 12:28:48 AM 12:36:00 AM 12:43:12 AM 12:50:24 AM 1 2 3 4 5 6 7 casual 12:45:12 AM 12:36:47 AM 12:44:24 AM 12:38:04 AM 12:36:05 AM 12:41:38 AM 12:45:43 AM member 12:21:31 AM 12:17:40 AM 12:18:31 AM 12:16:19 AM 12:16:09 AM 12:17:51 AM 12:20:02 AM 12:00:00 AM 12:07:12 AM 12:14:24 AM 12:21:36 AM 12:28:48 AM 12:36:00 AM 12:43:12 AM 12:50:24 AM
  • 8.
    Max ride length: Maxride length for members. Same thing verified by weekly distribution. Total casual 11:58:33 PM member 11:56:39 PM 11:58:33 PM 11:56:39 PM 11:55:41 PM 11:56:24 PM 11:57:07 PM 11:57:50 PM 11:58:34 PM 11:59:17 PM 1 2 3 4 5 6 7 casual 11:50:16 PM 10:28:30 PM 11:55:10 PM 11:55:10 PM 9:58:41 PM 11:58:33 PM 11:55:57 PM member 11:56:29 PM 11:17:37 PM 11:56:39 PM 11:34:32 PM 10:25:18 PM 11:31:50 PM 11:26:52 PM 8:38:24 PM 9:07:12 PM 9:36:00 PM 10:04:48 PM 10:33:36 PM 11:02:24 PM 11:31:12 PM 12:00:00 AM 12:28:48 AM
  • 9.
    Area Wise Distribution Graphis plotted for area wise distribution users. From this information we can see that which area has more users and which area has more casual members and according to this we can marketing strategy. 0 100 200 300 400 500 600 700 800 900 2 14 24 34 44 54 67 80 92 102 114 124 134 145 157 167 177 188 199 209 219 230 241 252 262 274 284 294 304 314 324 334 344 354 370 384 396 408 418 428 438 448 458 468 479 489 499 509 523 533 544 555 567 578 589 599 622 635 645 657 672 All user Start Station Id 0 50 100 150 200 250 300 2 15 25 35 45 55 68 81 93 106 116 126 136 147 159 169 179 191 201 211 223 233 244 255 265 277 287 297 307 317 327 337 348 364 376 392 403 414 424 434 446 456 466 477 487 497 507 520 533 550 567 580 591 601 624 638 660 Casual_user Start_station_id
  • 12.
    Recommendations • Price Discountfor different Since casual rider have longer rides compare to annual. Company should provide flexible rate for casual user, rather than fix rate. If ride length exceed certain distance user has some monitory benefit. This kind of benefit given to annual member as well. This way more users will attract toward platform. Eventually increase revenue for company. Monthly/Quarterly basis casual user have some statistic message when they can compare how much money they can save via using annual membership ride length
  • 13.
    • Promotion/Publicity Social mediais effective tools for advertisement. Target particular region which have more users and where more potential. Digital platform (Facebook, Instagram, linkdin...) are quite effective compare to traditional ways. • Marketing Strategy Create effective add which clearly states that you have bike experience of any bike at anytime without having one. Another strategy should be added for renting vehicle, where owner and user both have benefit.
  • 14.
    Data Description • Datasource : This data is provided by Cyclistic itself. (Note: The datasets have a different name because Cyclistic is a fictional company.) Data is stored locally. • Data privacy and securities: The data has been made available by Motivate International Inc. under this license.
  • 15.