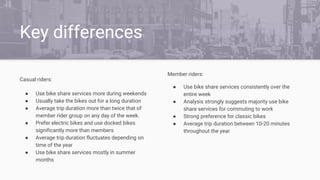
Cyclistic: How does a bike share
navigate speedy success?
Presented by: Oliver Carey
Last updated: 03/02/2023
Contents
1. About Cyclistic
2. Business task
3. Cyclistic bike-share data
4. Total trips
5. Trip duration
6. Bike demand
7. Ride type
8. Conclusions
1. About Cyclistic bike-share
● In 2016, Cyclistic launched a successful bike-share service
● Since then, the programme has grown to a fleet of 5,824 bicycles that are geotracked and
locked into a network of 692 stations across Chicago
● Cyclistic bike share service offers 3 ride types:
○ Classic bike
○ Docked bike
○ Electric bike
● Until now, Cyclistic’s marketing strategy relied on building general awareness
and appealing to broad consumer segments
● One approach that helped make these things possible was the flexibility of its
pricing plans: single-ride passes, full-day passes, and annual memberships
○ Customers who purchase single-ride or full-day passes are referred to as
casual riders.
○ Customers who purchase annual memberships are Cyclistic members
2. Business Task
● Marketing team needs to design marketing strategies aimed at converting casual
riders into annual members. In order to do that, the marketing analyst team needs
to better understand how annual members and casual riders differ
● Objective for this analysis is to gain insight from existing data to shed light on how
the two types of customers use Cyclistic bikeshare
3. Cyclistic bike-share data
● 31 datasets showing Cyclistic’s historical trip data have been made available to
capture the details of every ride logged between April 2020 and December 2022 by
the customers of Cyclistic
● The data has been made available by Motivate International Inc. under this license.
4. Total trips
Total trips by year
● Big jump in total rides from
2020 to 2021
○ Post-covid cycle boom
hit
○ See a large increase in
both casual and member
riders
● Fall in casual riders from 2021
to 2022
● Member numbers have stayed
at a similar level since boom in
2021
● Number of trips made by
members is always higher than
the casual riders across all 3
years
Total trips by
month
● Most busy months for both
member and casual riders are
July, August and September
○ Number of casual riders
exceeds members in
July
● Least busy months for both
member and casual riders are
January, February, March &
December
○ Seasonal weather could
effect rider usage.
○ Peak in riders during
summer months
○ Dip during winter
months.
Total trips by
weekday
● Casual riders
○ Most rides at weekends
○ Huge peak in number of
rides on Saturday
○ During weekdays
number of rides drops
considerably
● Members
○ Number of rides are
more consistent through
the week
○ Stays above 100,000
○ Least rides on Sunday
● Clear difference in members
and casual riders
weekday/weekend usage
5. Trip duration
Trip duration by
year
● Duration of rides has been
decreasing year by year for both
customer types
● Average trip duration for casual
riders fell from over 40 minutes
in 2020 to less than 30 minutes
in 2022
● Analysis of total trips showed
the effect of the covid bike
boom.
● Massive increase in number of
trips in 2021 may be behind the
decline in average trip duration
Trip duration by
month
● Member riders average trip
duration is between 10-20
minutes throughout the
year
● Casual riders average trip
duration fluctuates
depending on time of the
year
○ From as low as 25
minutes in December
○ To ~40 minutes in
June
Trip duration by
weekday
● Casual rider average trip
duration is more than
double that of members
● Both customer types
average longer trips on
weekends compared to
weekdays
6. Bike demand
Bike demand over
a 24 hour day
● Members and casual riders
both have peak in demand
between 5-7 PM
● Members have a 2nd peak
in demand between 7-9 AM
● It’s possible the majority of
members are work
commuters due to the
timings of high demand
7. Ride type
Demand for each
ride type
● Members have a strong
preference for classic bikes
but also like to use the
electric bike
● Casual riders prefer electric
bikes but are relatively split
between electric bike and
classic bike
● Docked bikes are the least in
demand ride type
● Docked bikes are more
preferred by casual riders
than members
Bike demand in each
ride type over a day
● All bike types have peak
demand between 5 - 7 PM
● Significant peak in
members using the classic
bike between 5-7 PM
● Classic bike is the bike of
choice for commuters
● Docked bike is the only
bike type where casual
riders have periods of
higher demand than
members
8. Conclusions
Key differences
Casual riders:
● Use bike share services more during weekends
● Usually take the bikes out for a long duration
● Average trip duration more than twice that of
member rider group on any day of the week.
● Prefer electric bikes and use docked bikes
significantly more than members
● Average trip duration fluctuates depending on
time of the year
● Use bike share services mostly in summer
months
Member riders:
● Use bike share services consistently over the
entire week
● Analysis strongly suggests majority use bike
share services for commuting to work
● Strong preference for classic bikes
● Average trip duration between 10-20 minutes
throughout the year
Recommendations
● Offering alternative memberships where casual riders can purchase a weekend only annual membership with the option to
upgrade
○ Analysis found that a large majority of casual riders only use the bike share service on weekends and not through
the week. Alternative membership options could convert casual riders into members
● Running promotions and discounted pricing during off-peak hours during the weekdays to get more customers using the
bike share through the week
○ Analysis found that casual riders were not using the bikeshare uniformly across the week. Attractive promotions for
casual riders on weekdays could help level out demand over the week
● Run marketing campaign between March and April when number of casual riders begins to increase.
○ Analysis found that the peak time for casual riders using the bike share services is July. Running campaign to
convert casual riders to members in the lead up to this would maximise new membership
Thank you for viewing my
presentation!
If you have any feedback please email me (olivercareyncl@gmail.com)

Cyclistic case study

  • 1.
    Cyclistic: How doesa bike share navigate speedy success? Presented by: Oliver Carey Last updated: 03/02/2023
  • 2.
    Contents 1. About Cyclistic 2.Business task 3. Cyclistic bike-share data 4. Total trips 5. Trip duration 6. Bike demand 7. Ride type 8. Conclusions
  • 3.
    1. About Cyclisticbike-share ● In 2016, Cyclistic launched a successful bike-share service ● Since then, the programme has grown to a fleet of 5,824 bicycles that are geotracked and locked into a network of 692 stations across Chicago ● Cyclistic bike share service offers 3 ride types: ○ Classic bike ○ Docked bike ○ Electric bike
  • 4.
    ● Until now,Cyclistic’s marketing strategy relied on building general awareness and appealing to broad consumer segments ● One approach that helped make these things possible was the flexibility of its pricing plans: single-ride passes, full-day passes, and annual memberships ○ Customers who purchase single-ride or full-day passes are referred to as casual riders. ○ Customers who purchase annual memberships are Cyclistic members
  • 5.
    2. Business Task ●Marketing team needs to design marketing strategies aimed at converting casual riders into annual members. In order to do that, the marketing analyst team needs to better understand how annual members and casual riders differ ● Objective for this analysis is to gain insight from existing data to shed light on how the two types of customers use Cyclistic bikeshare
  • 6.
    3. Cyclistic bike-sharedata ● 31 datasets showing Cyclistic’s historical trip data have been made available to capture the details of every ride logged between April 2020 and December 2022 by the customers of Cyclistic ● The data has been made available by Motivate International Inc. under this license.
  • 7.
  • 8.
    Total trips byyear ● Big jump in total rides from 2020 to 2021 ○ Post-covid cycle boom hit ○ See a large increase in both casual and member riders ● Fall in casual riders from 2021 to 2022 ● Member numbers have stayed at a similar level since boom in 2021 ● Number of trips made by members is always higher than the casual riders across all 3 years
  • 9.
    Total trips by month ●Most busy months for both member and casual riders are July, August and September ○ Number of casual riders exceeds members in July ● Least busy months for both member and casual riders are January, February, March & December ○ Seasonal weather could effect rider usage. ○ Peak in riders during summer months ○ Dip during winter months.
  • 10.
    Total trips by weekday ●Casual riders ○ Most rides at weekends ○ Huge peak in number of rides on Saturday ○ During weekdays number of rides drops considerably ● Members ○ Number of rides are more consistent through the week ○ Stays above 100,000 ○ Least rides on Sunday ● Clear difference in members and casual riders weekday/weekend usage
  • 11.
  • 12.
    Trip duration by year ●Duration of rides has been decreasing year by year for both customer types ● Average trip duration for casual riders fell from over 40 minutes in 2020 to less than 30 minutes in 2022 ● Analysis of total trips showed the effect of the covid bike boom. ● Massive increase in number of trips in 2021 may be behind the decline in average trip duration
  • 13.
    Trip duration by month ●Member riders average trip duration is between 10-20 minutes throughout the year ● Casual riders average trip duration fluctuates depending on time of the year ○ From as low as 25 minutes in December ○ To ~40 minutes in June
  • 14.
    Trip duration by weekday ●Casual rider average trip duration is more than double that of members ● Both customer types average longer trips on weekends compared to weekdays
  • 15.
  • 16.
    Bike demand over a24 hour day ● Members and casual riders both have peak in demand between 5-7 PM ● Members have a 2nd peak in demand between 7-9 AM ● It’s possible the majority of members are work commuters due to the timings of high demand
  • 17.
  • 18.
    Demand for each ridetype ● Members have a strong preference for classic bikes but also like to use the electric bike ● Casual riders prefer electric bikes but are relatively split between electric bike and classic bike ● Docked bikes are the least in demand ride type ● Docked bikes are more preferred by casual riders than members
  • 19.
    Bike demand ineach ride type over a day ● All bike types have peak demand between 5 - 7 PM ● Significant peak in members using the classic bike between 5-7 PM ● Classic bike is the bike of choice for commuters ● Docked bike is the only bike type where casual riders have periods of higher demand than members
  • 20.
  • 21.
    Key differences Casual riders: ●Use bike share services more during weekends ● Usually take the bikes out for a long duration ● Average trip duration more than twice that of member rider group on any day of the week. ● Prefer electric bikes and use docked bikes significantly more than members ● Average trip duration fluctuates depending on time of the year ● Use bike share services mostly in summer months Member riders: ● Use bike share services consistently over the entire week ● Analysis strongly suggests majority use bike share services for commuting to work ● Strong preference for classic bikes ● Average trip duration between 10-20 minutes throughout the year
  • 22.
    Recommendations ● Offering alternativememberships where casual riders can purchase a weekend only annual membership with the option to upgrade ○ Analysis found that a large majority of casual riders only use the bike share service on weekends and not through the week. Alternative membership options could convert casual riders into members ● Running promotions and discounted pricing during off-peak hours during the weekdays to get more customers using the bike share through the week ○ Analysis found that casual riders were not using the bikeshare uniformly across the week. Attractive promotions for casual riders on weekdays could help level out demand over the week ● Run marketing campaign between March and April when number of casual riders begins to increase. ○ Analysis found that the peak time for casual riders using the bike share services is July. Running campaign to convert casual riders to members in the lead up to this would maximise new membership
  • 23.
    Thank you forviewing my presentation! If you have any feedback please email me (olivercareyncl@gmail.com)

Editor's Notes

  • #11 Members have less fluctuation in trip numbers over the week compared to casual riders who don't seem to use the bikeshare services much during weekdays.