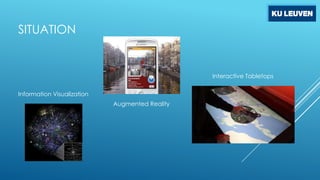
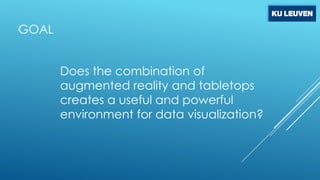
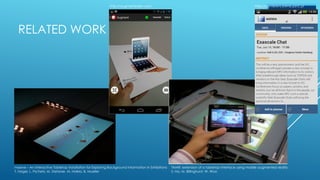
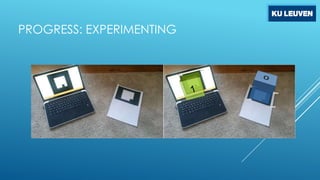
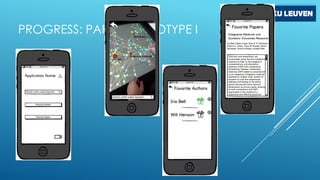
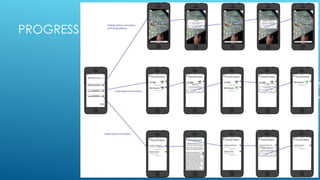
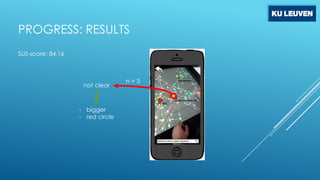
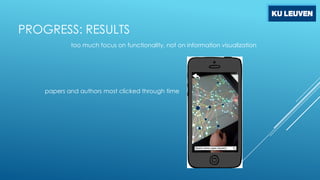
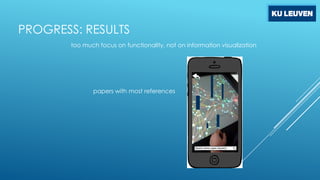
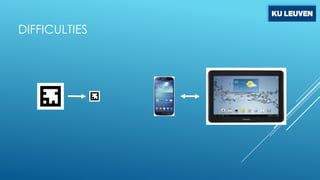
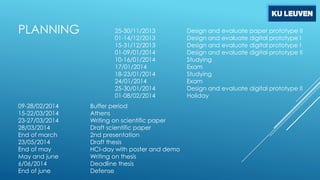
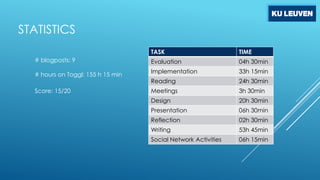
DATA VISUALIZATION WITH
TABLETOPS AND
AUGMENTED REALITY
Thomas De Moor
@Thomas_DeMoor &

thomasdemoor.wordpress.com

Advisor: Sven Charleer
Supervisor: Prof. Dr. Ir. Erik Duval
CONTENTS
•
•
•
•
•
•
•

Situation
Goal
Related work
Progress
Difficulties
Planning
Statistics
CONTENTS
•
•
•
•
•
•
•

Situation
Goal
Related work
Progress
Difficulties
Planning
Statistics
SITUATION

Interactive Tabletops
Information Visualization

Augmented Reality
SITUATION

Interactive sensemaking in Authorship networks
B. Vandeputte, E. Duval, J. Klerckx
CONTENTS
•
•
•
•
•
•
•

Situation
Goal
Related work
Progress
Difficulties
Planning
Statistics
GOAL
Does the combination of
augmented reality and tabletops
creates a useful and powerful
environment for data visualization?
CONTENTS
•
•
•
•
•
•
•

Situation
Goal
Related work
Progress
Difficulties
Planning
Statistics
http://augmentedev.com

http://conference4me.psnc.pl

RELATED WORK

maeve – An Interactive Tabletop Installation for Exploring Background Information in Exhibitions
T. Nagel, L. Pschetz, M. Stefaner, M. Halkia, B. Mueller

TMAR: extension of a tabletop interface using mobile augmented reality
S. Na, M. Billinghurst, W. Woo
CONTENTS
•
•
•
•
•
•
•

Situation
Goal
Related work
Progress
Difficulties
Planning
Statistics
PROGRESS: EXPERIMENTING
PROGRESS: PAPER PROTOTYPE I
PROGRESS
PROGRESS: RESULTS
SUS-score: 84,16

not clear

- bigger
- red circle

n=3
PROGRESS: RESULTS
too much focus on functionality, not on information visualization

papers and authors most clicked through time
PROGRESS: RESULTS
too much focus on functionality, not on information visualization

papers with most references
PROGRESS: RESULTS
too much focus on functionality, not on information visualization

authors with contact details
PROGRESS: DIGITAL PROTOTYPE I
CONTENTS
•
•
•
•
•
•
•

Situation
Goal
Related work
Progress
Difficulties
Planning
Statistics
DIFFICULTIES
CONTENTS
•
•
•
•
•
•
•

Situation
Goal
Related work
Progress
Difficulties
Planning
Statistics
PLANNING

09-28/02/2014
15-22/03/2014
23-27/03/2014
28/03/2014
End of march
23/05/2014
End of may
May and june
6/06/2014
End of june

25-30/11/2013
01-14/12/2013
15-31/12/2013
01-09/01/2014
10-16/01/2014
17/01/2014
18-23/01/2014
24/01/2014
25-30/01/2014
01-08/02/2014
Buffer period
Athens
Writing on scientific paper
Draft scientific paper
2nd presentation
Draft thesis
HCI-day with poster and demo
Writing on thesis
Deadline thesis
Defense

Design and evaluate paper prototype II
Design and evaluate digital prototype I
Design and evaluate digital prototype II
Studying
Exam
Studying
Exam
Design and evaluate digital prototype II
Holiday
CONTENTS
•
•
•
•
•
•

Situation
Goal
Related work
Progress
Planning
Statistics
STATISTICS
TASK
# blogposts: 9
# hours on Toggl: 155 h 15 min
Score: 15/20

TIME

Evaluation

04h 30min

Implementation

33h 15min

Reading

24h 30min

Meetings

3h 30min

Design

20h 30min

Presentation

06h 30min

Reflection

02h 30min

Writing

53h 45min

Social Network Activities

06h 15min
QUESTIONS?

Thesis Presentation 26/11/2013