This document is a project report submitted as part of an internship at JM Financial in their Derivatives division. It includes an overview of JM Financial, including their history, vision, values, and the services they provide. It also provides a high-level overview of the financial markets, including the primary market, secondary market, and derivatives segment. The report focuses on derivatives, including the origins and development of derivatives in India, as well as definitions and explanations of different derivative products like forwards, futures, and options contracts.
![5
TABLE OF CONTENTS
CHAPTER – I
JM FINANCIAL OVERVIEW--------------------------------------- [9]
COMPANY PROFILE
HISTORY
BACKGROUND
FUNCTIONS
CHAPTER– II
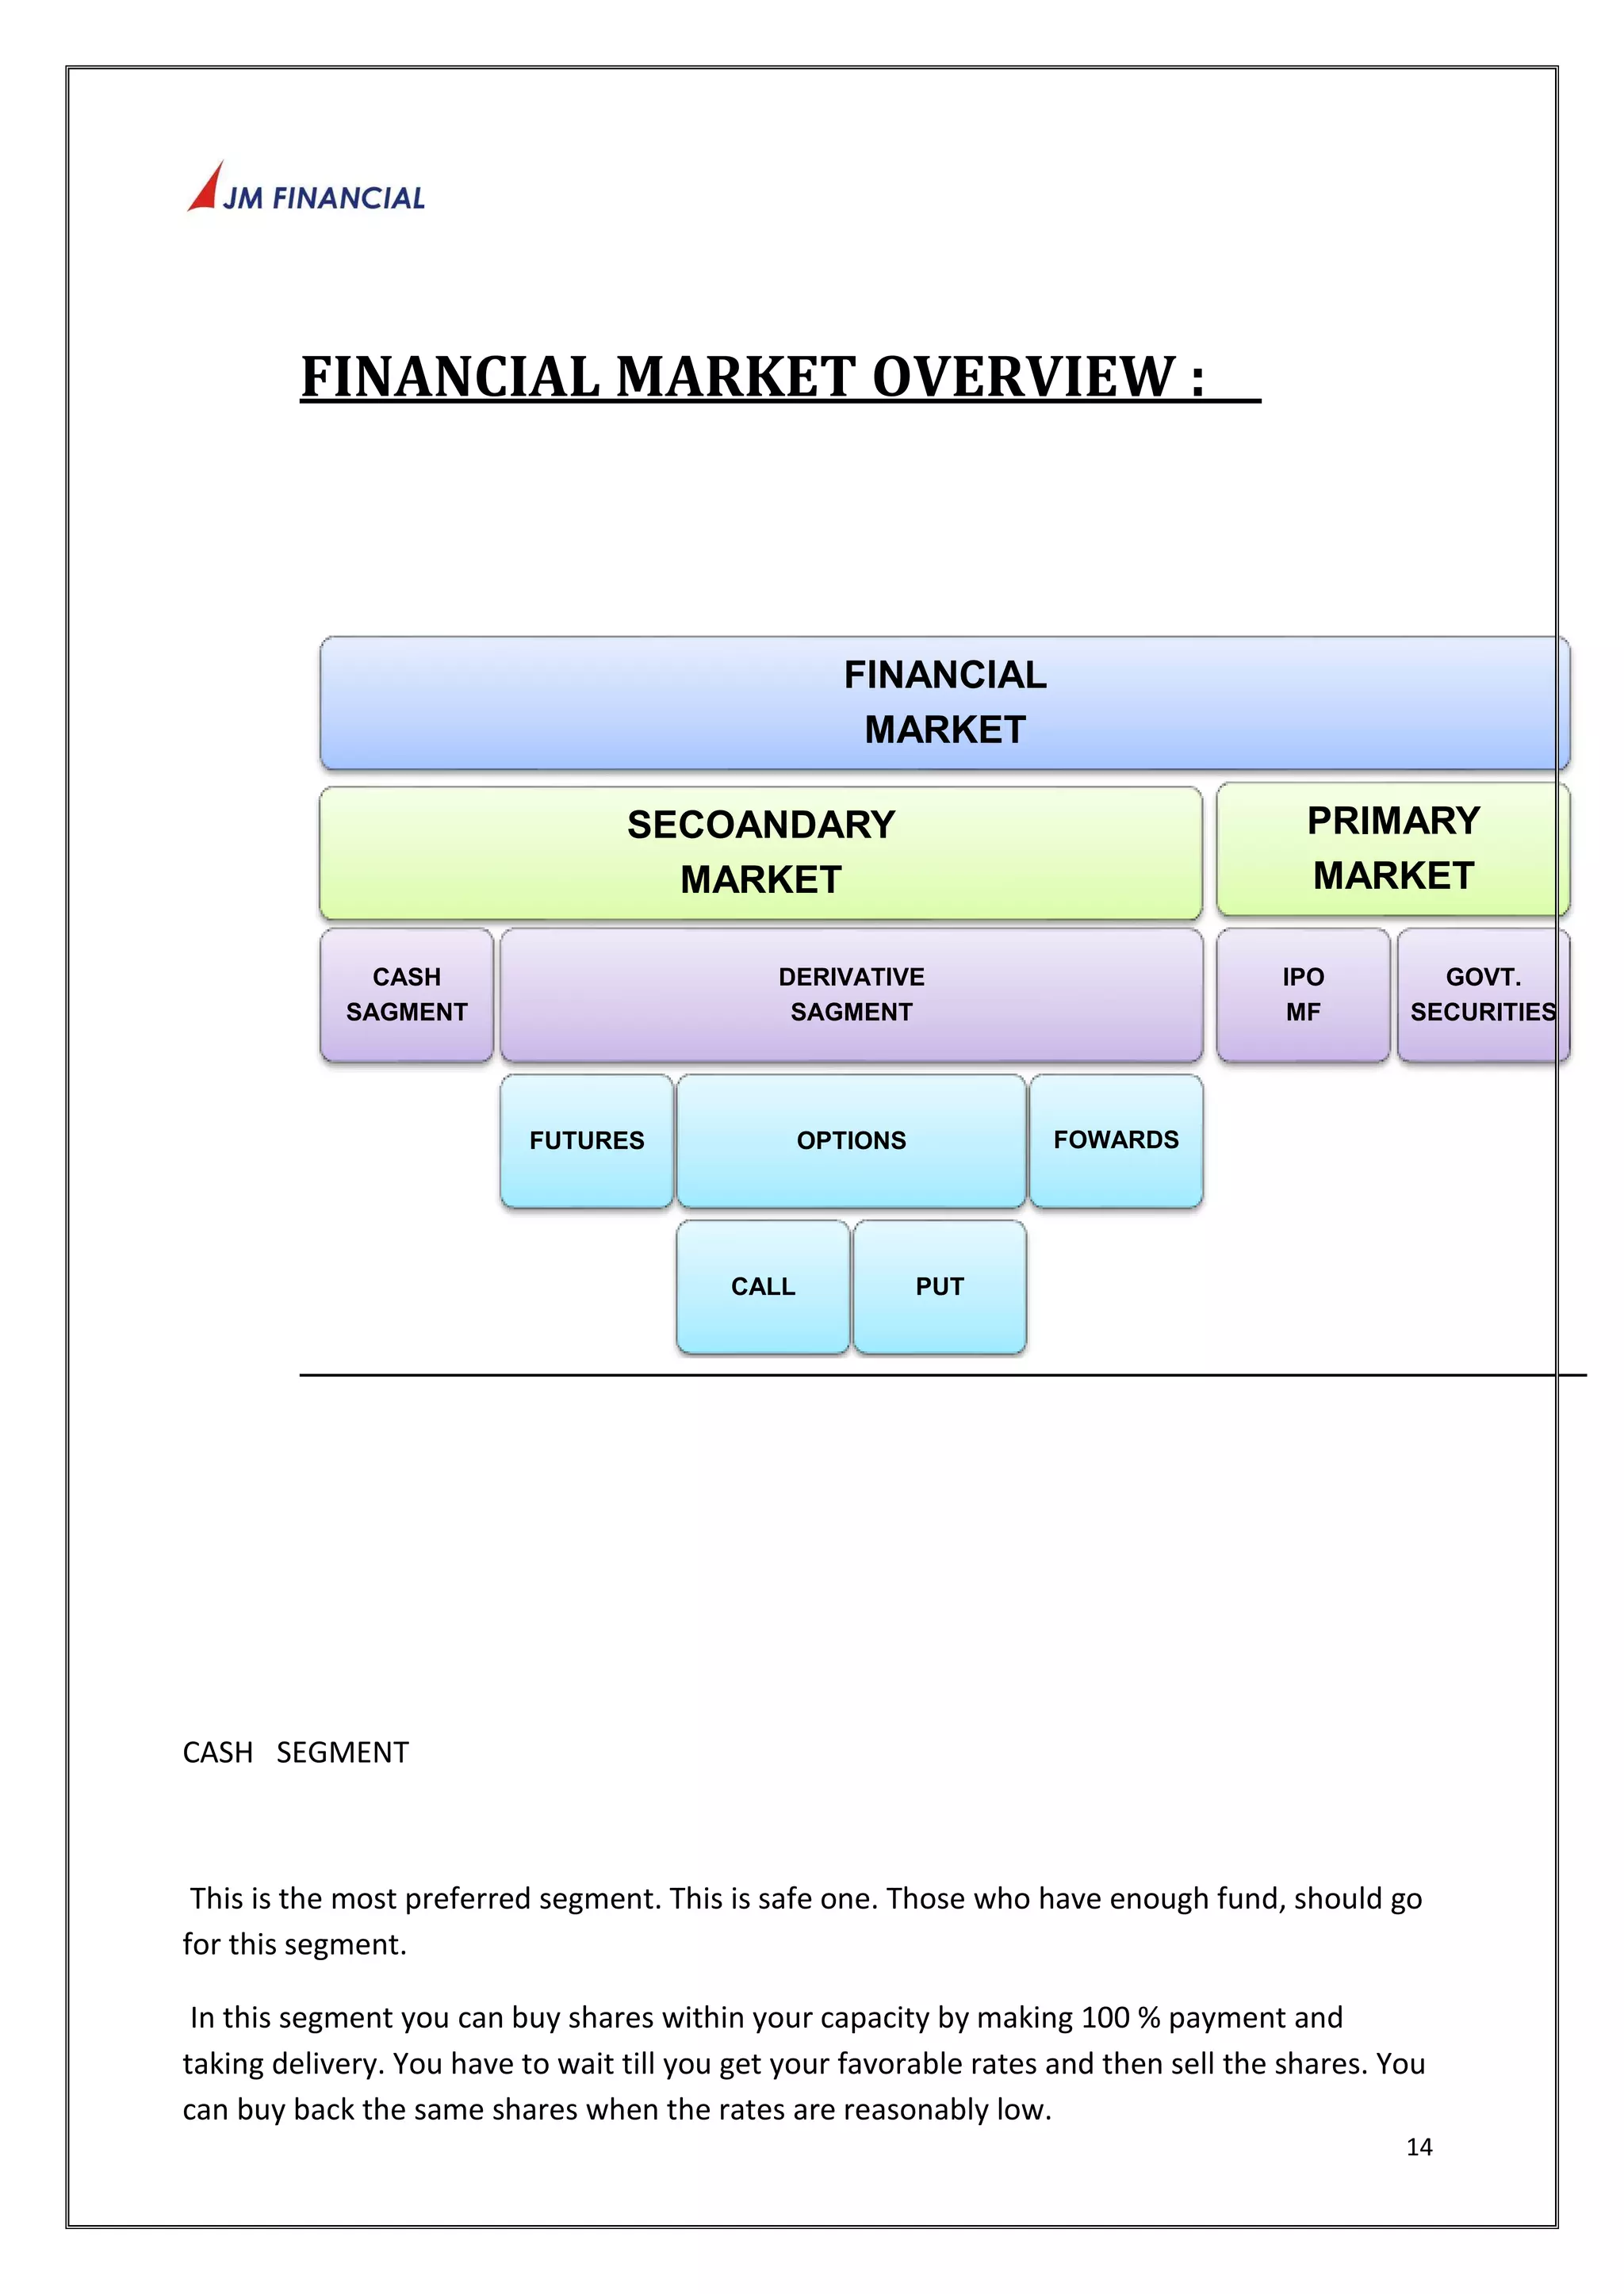
FINANCIAL SEGMENT OVERVIEW------------------- ----------------------------- [16]
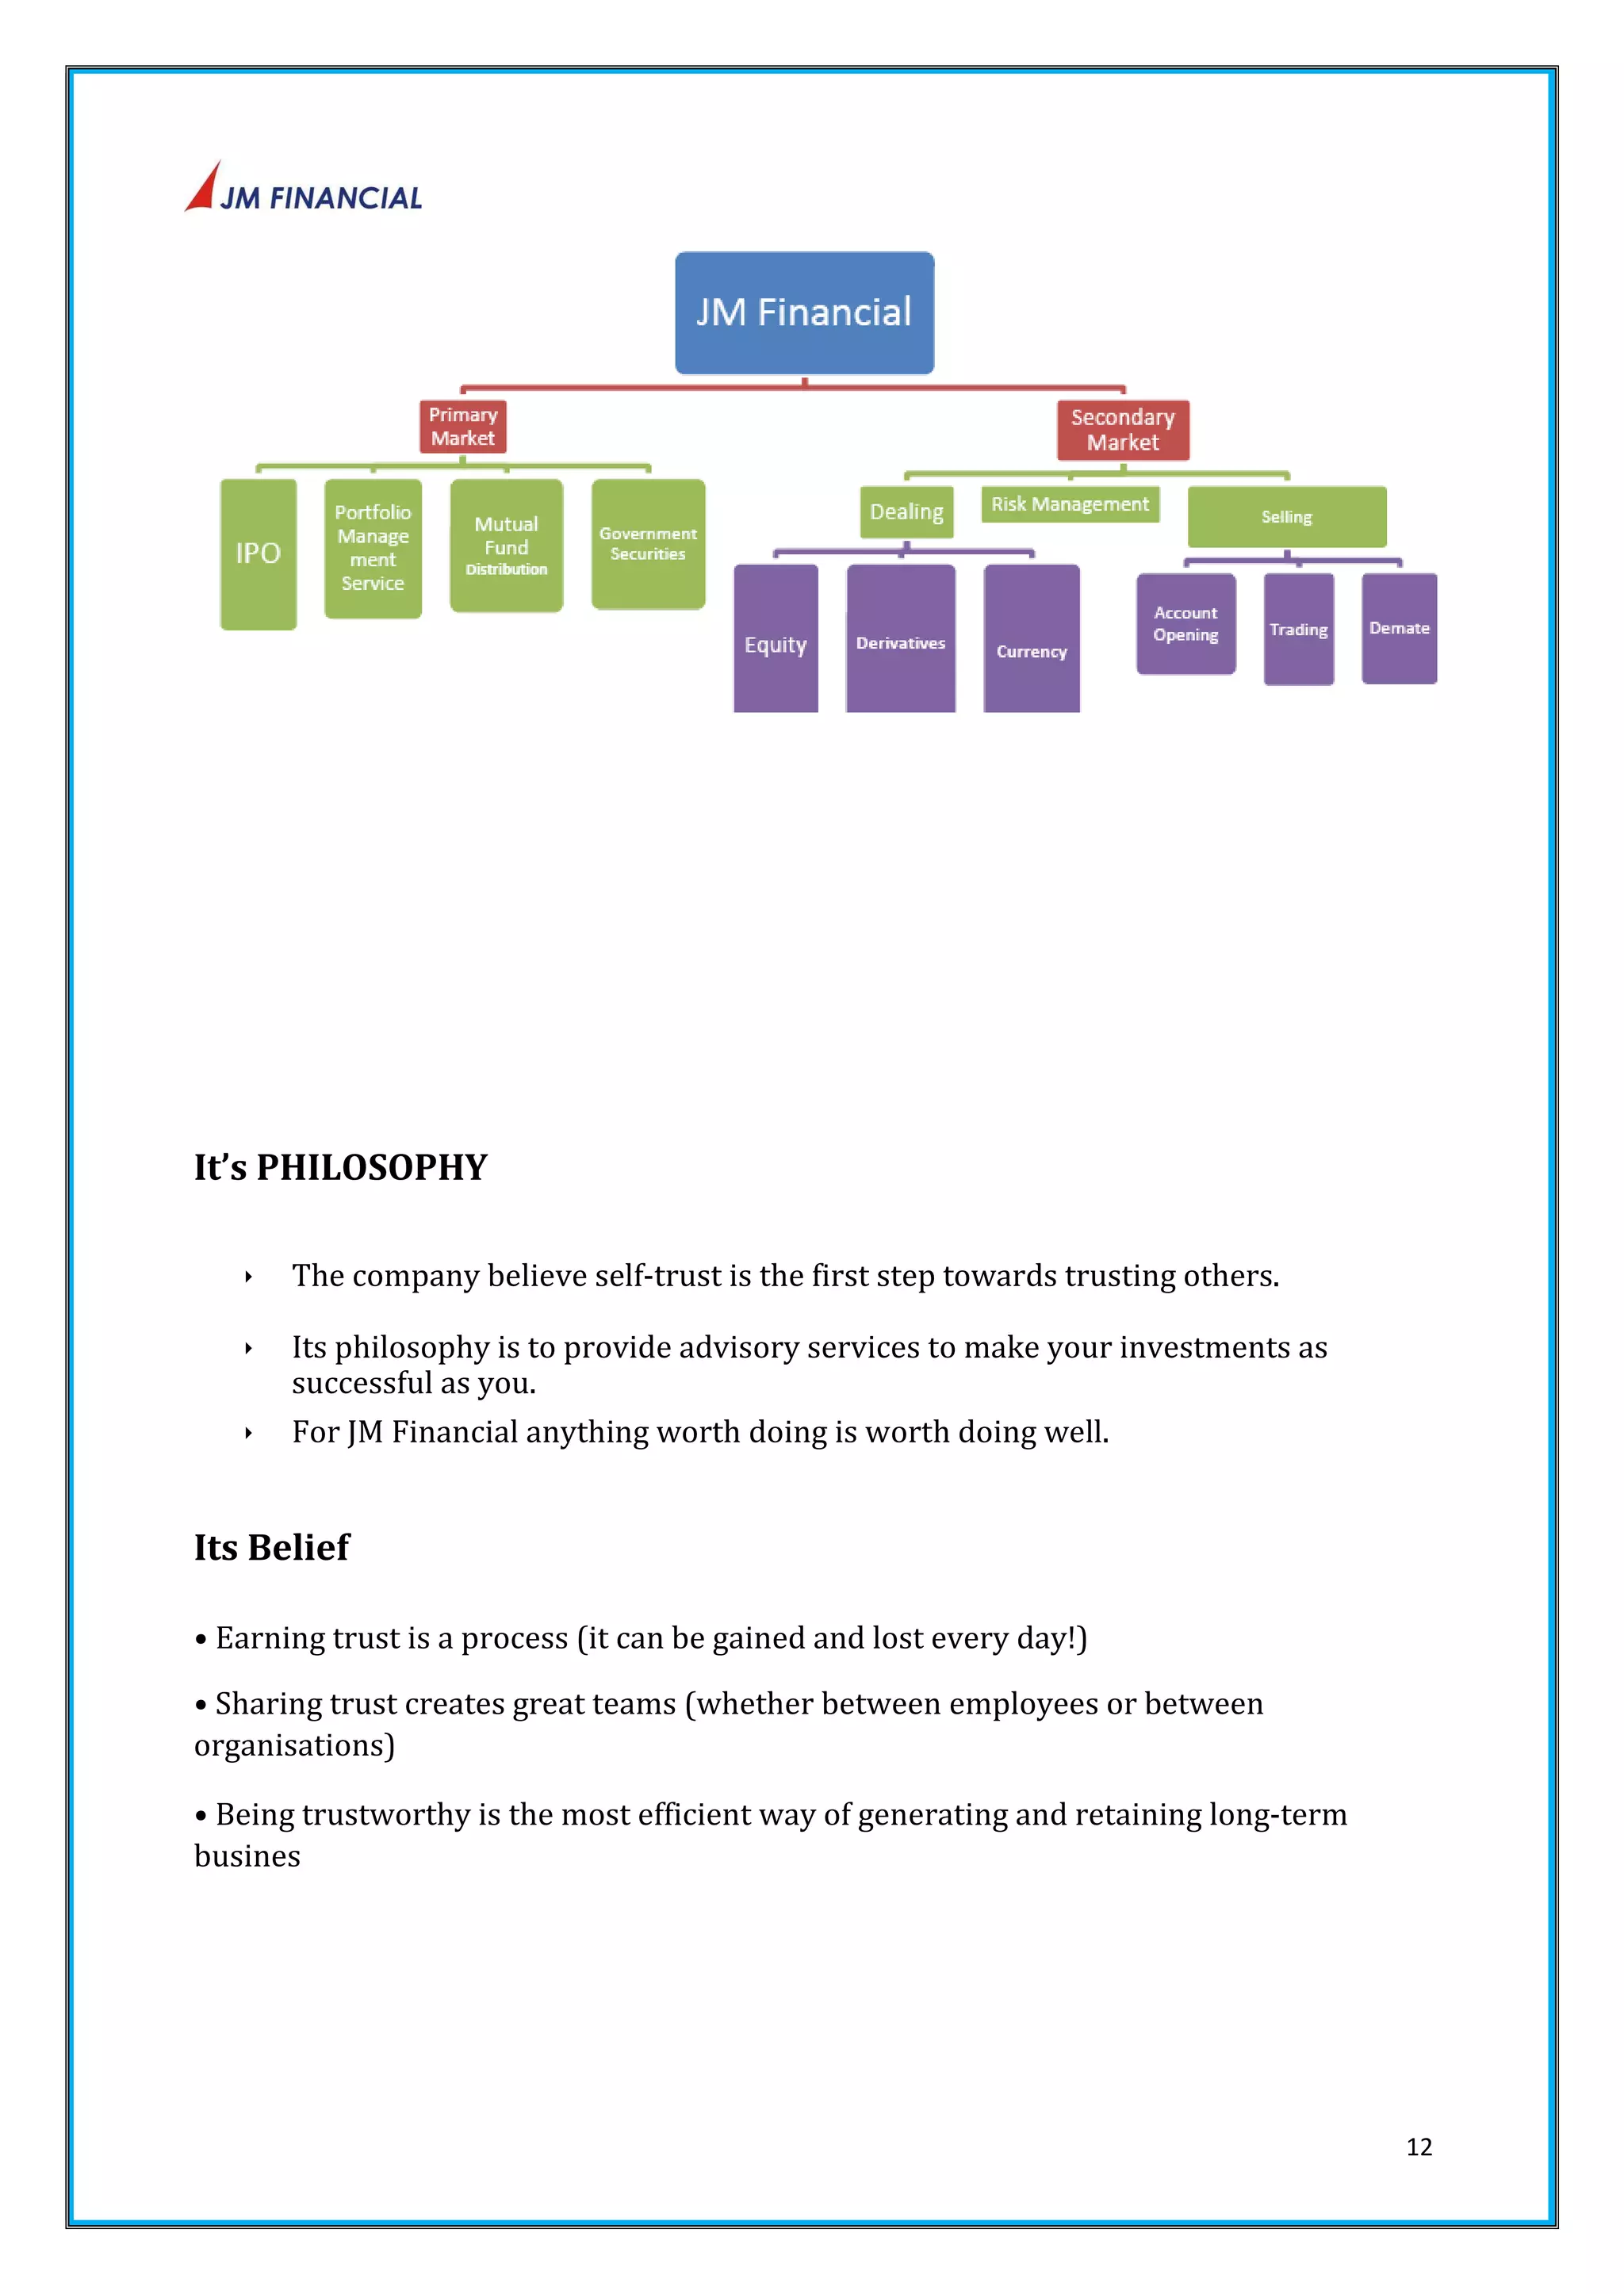
PRIMARY MARKET
SECONDARY MARKET
CHAPTER-III
DERIVATIVE---------------------------- [19]
ORIGINE OF DERIVATIVE
EMERGENCE OF DERIVATIVE
DEVELOPMENT OF DERIVATIVE IN INDIA
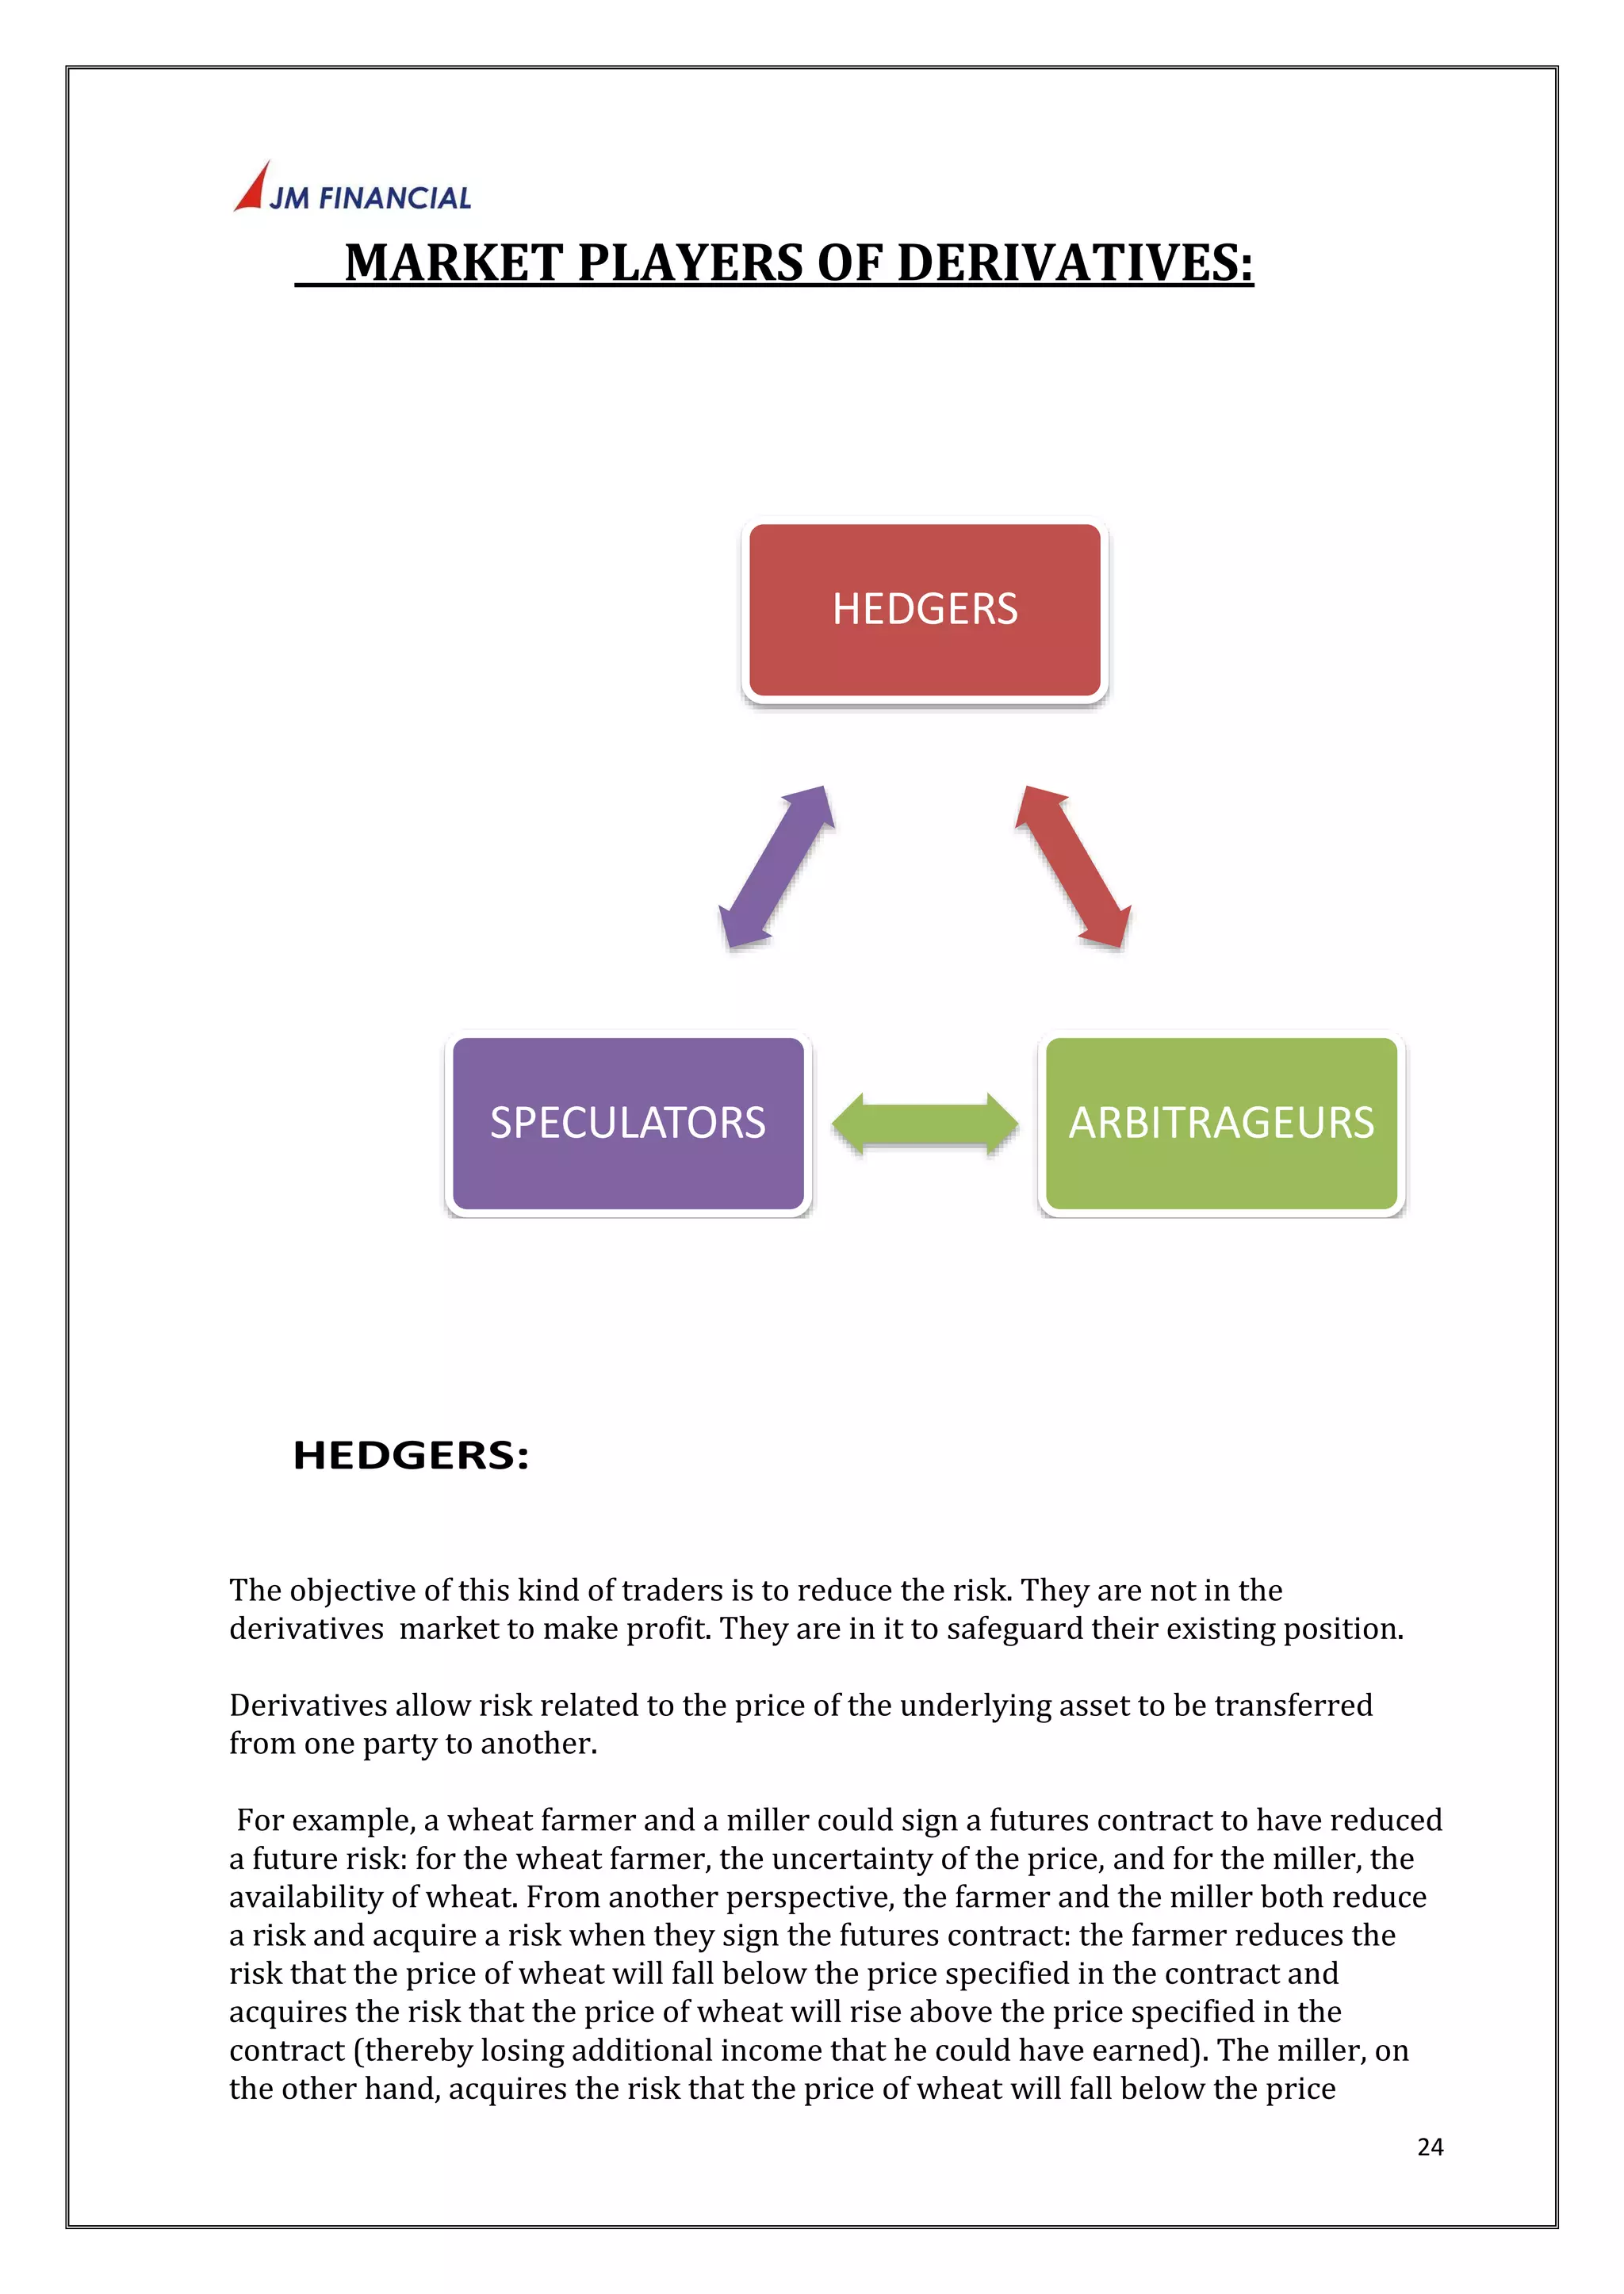
MARKET PLAYERS OF DERIVATIVE
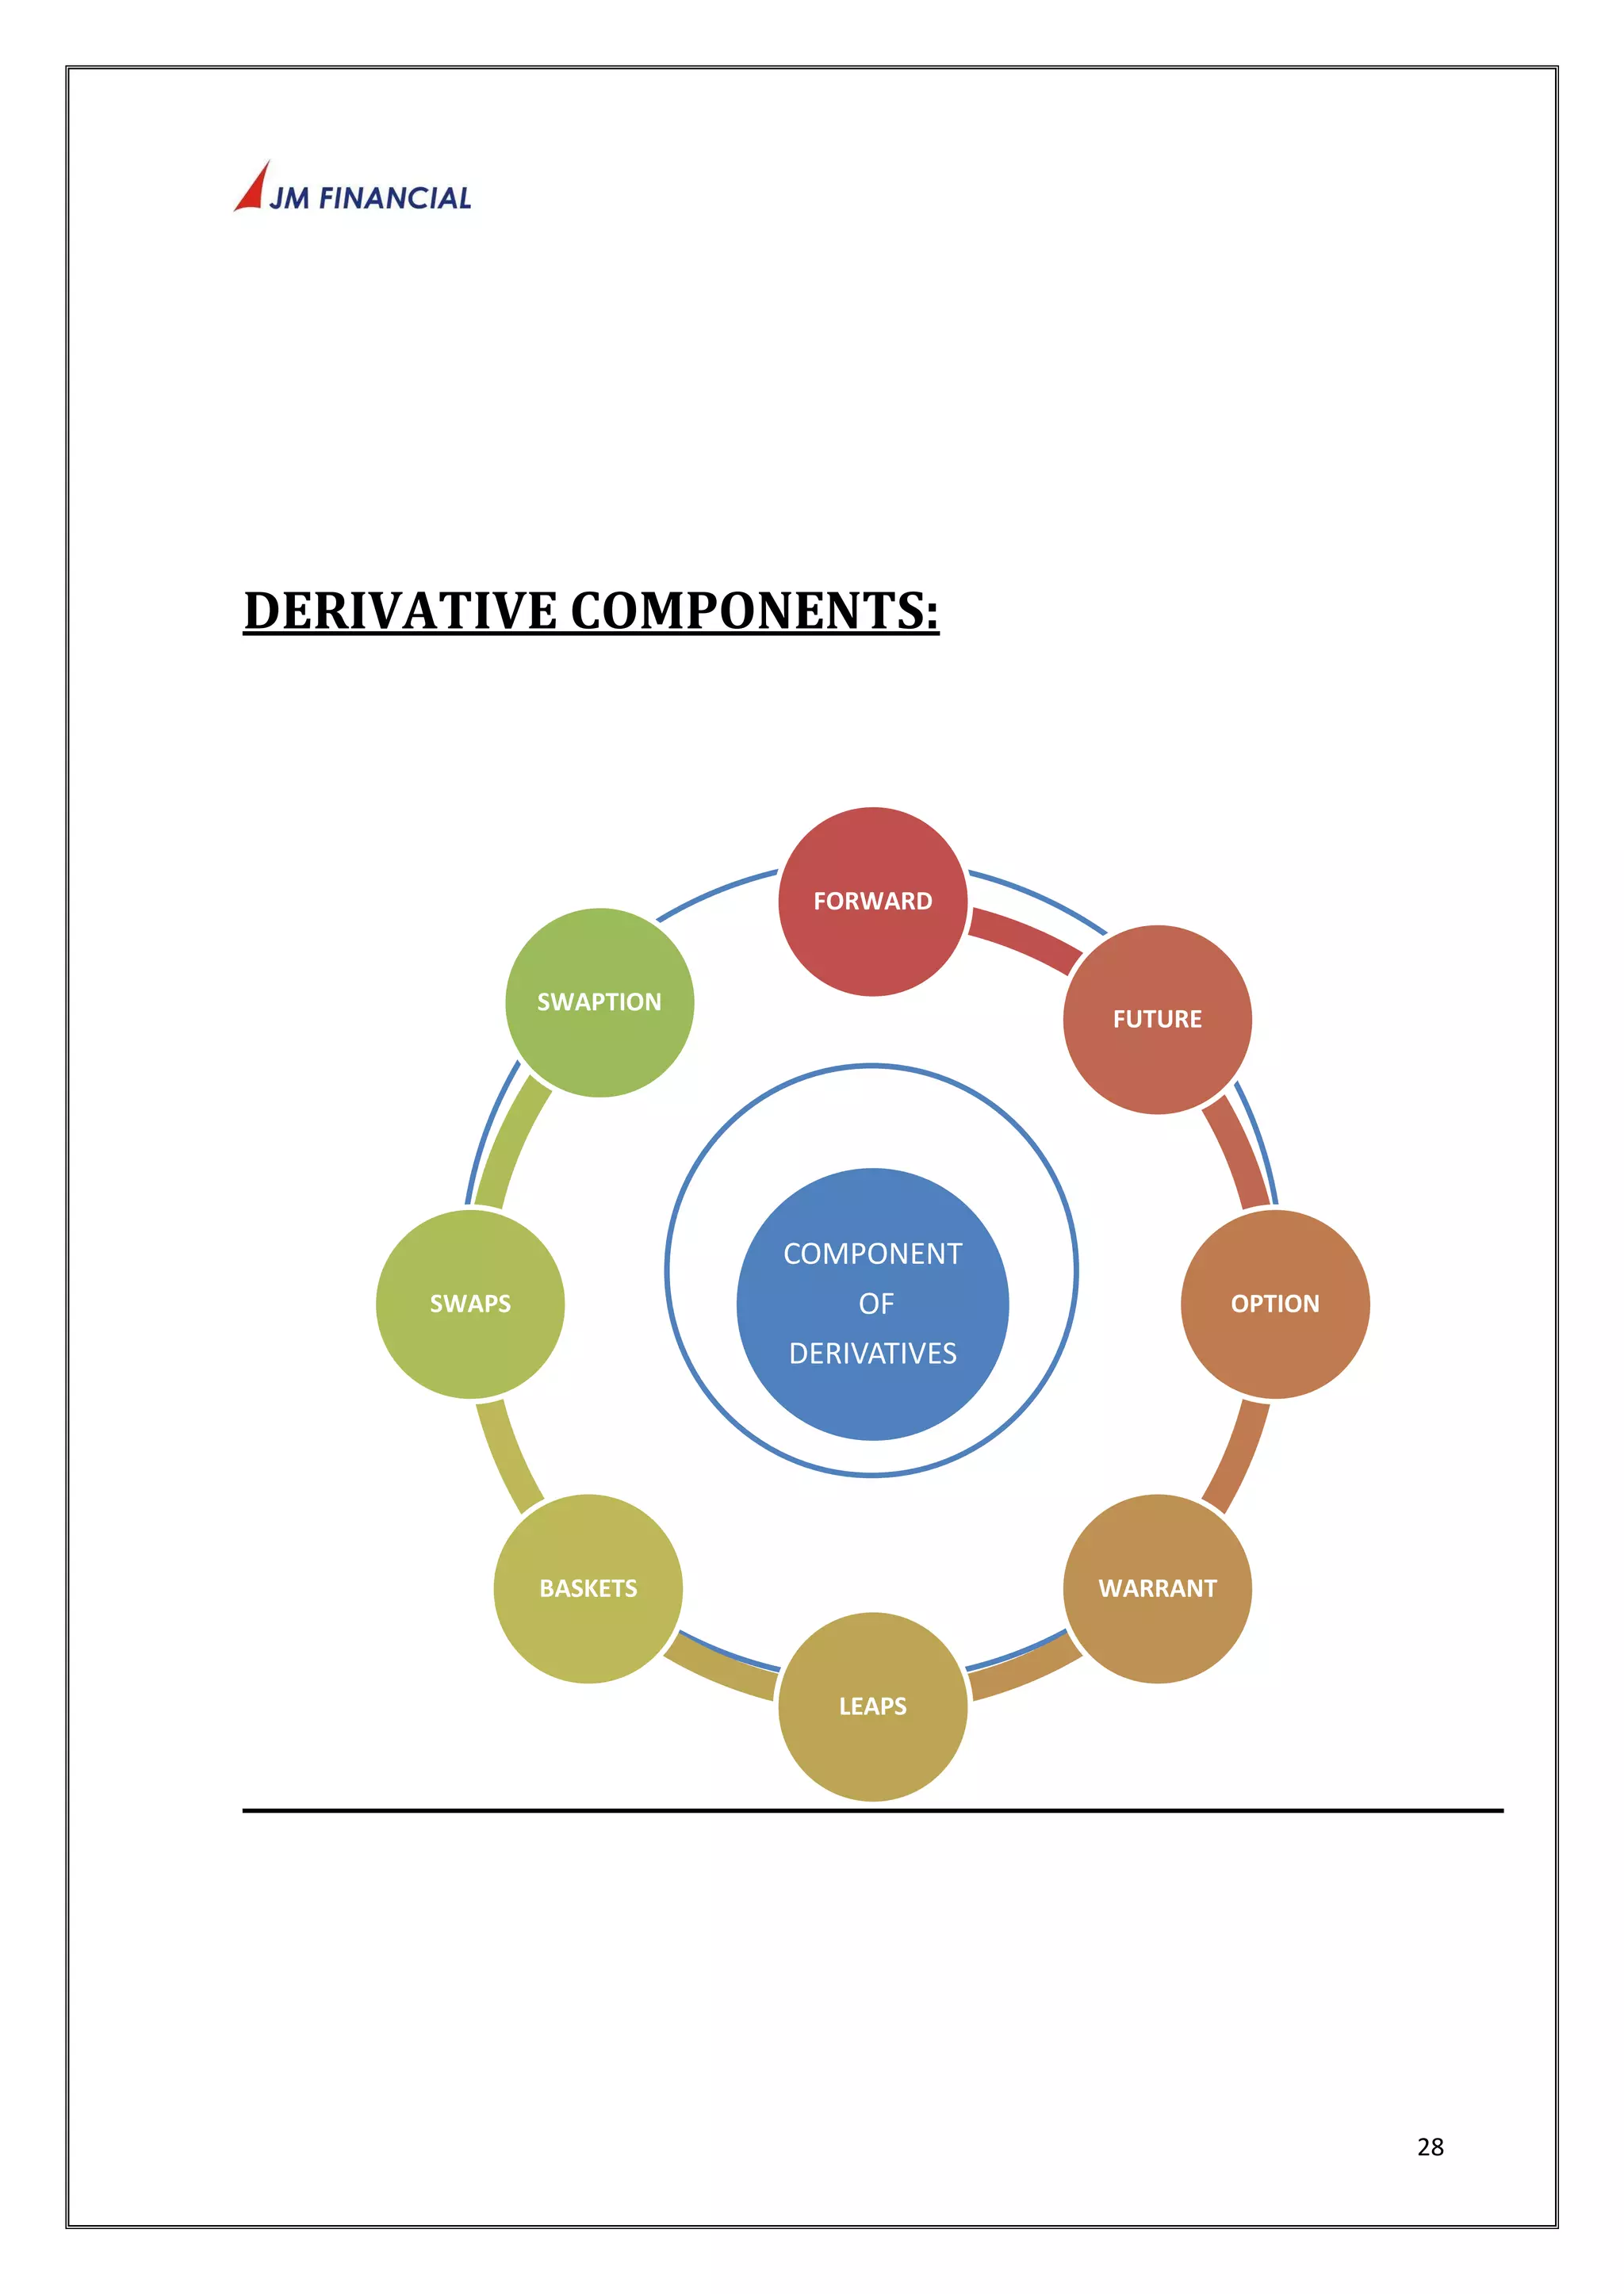
COMPONENT OF DERIVATIVE](https://image.slidesharecdn.com/prashangisip-141116233920-conversion-gate01/75/Prashangi-sip-5-2048.jpg)
![6
CHAPTER-IV
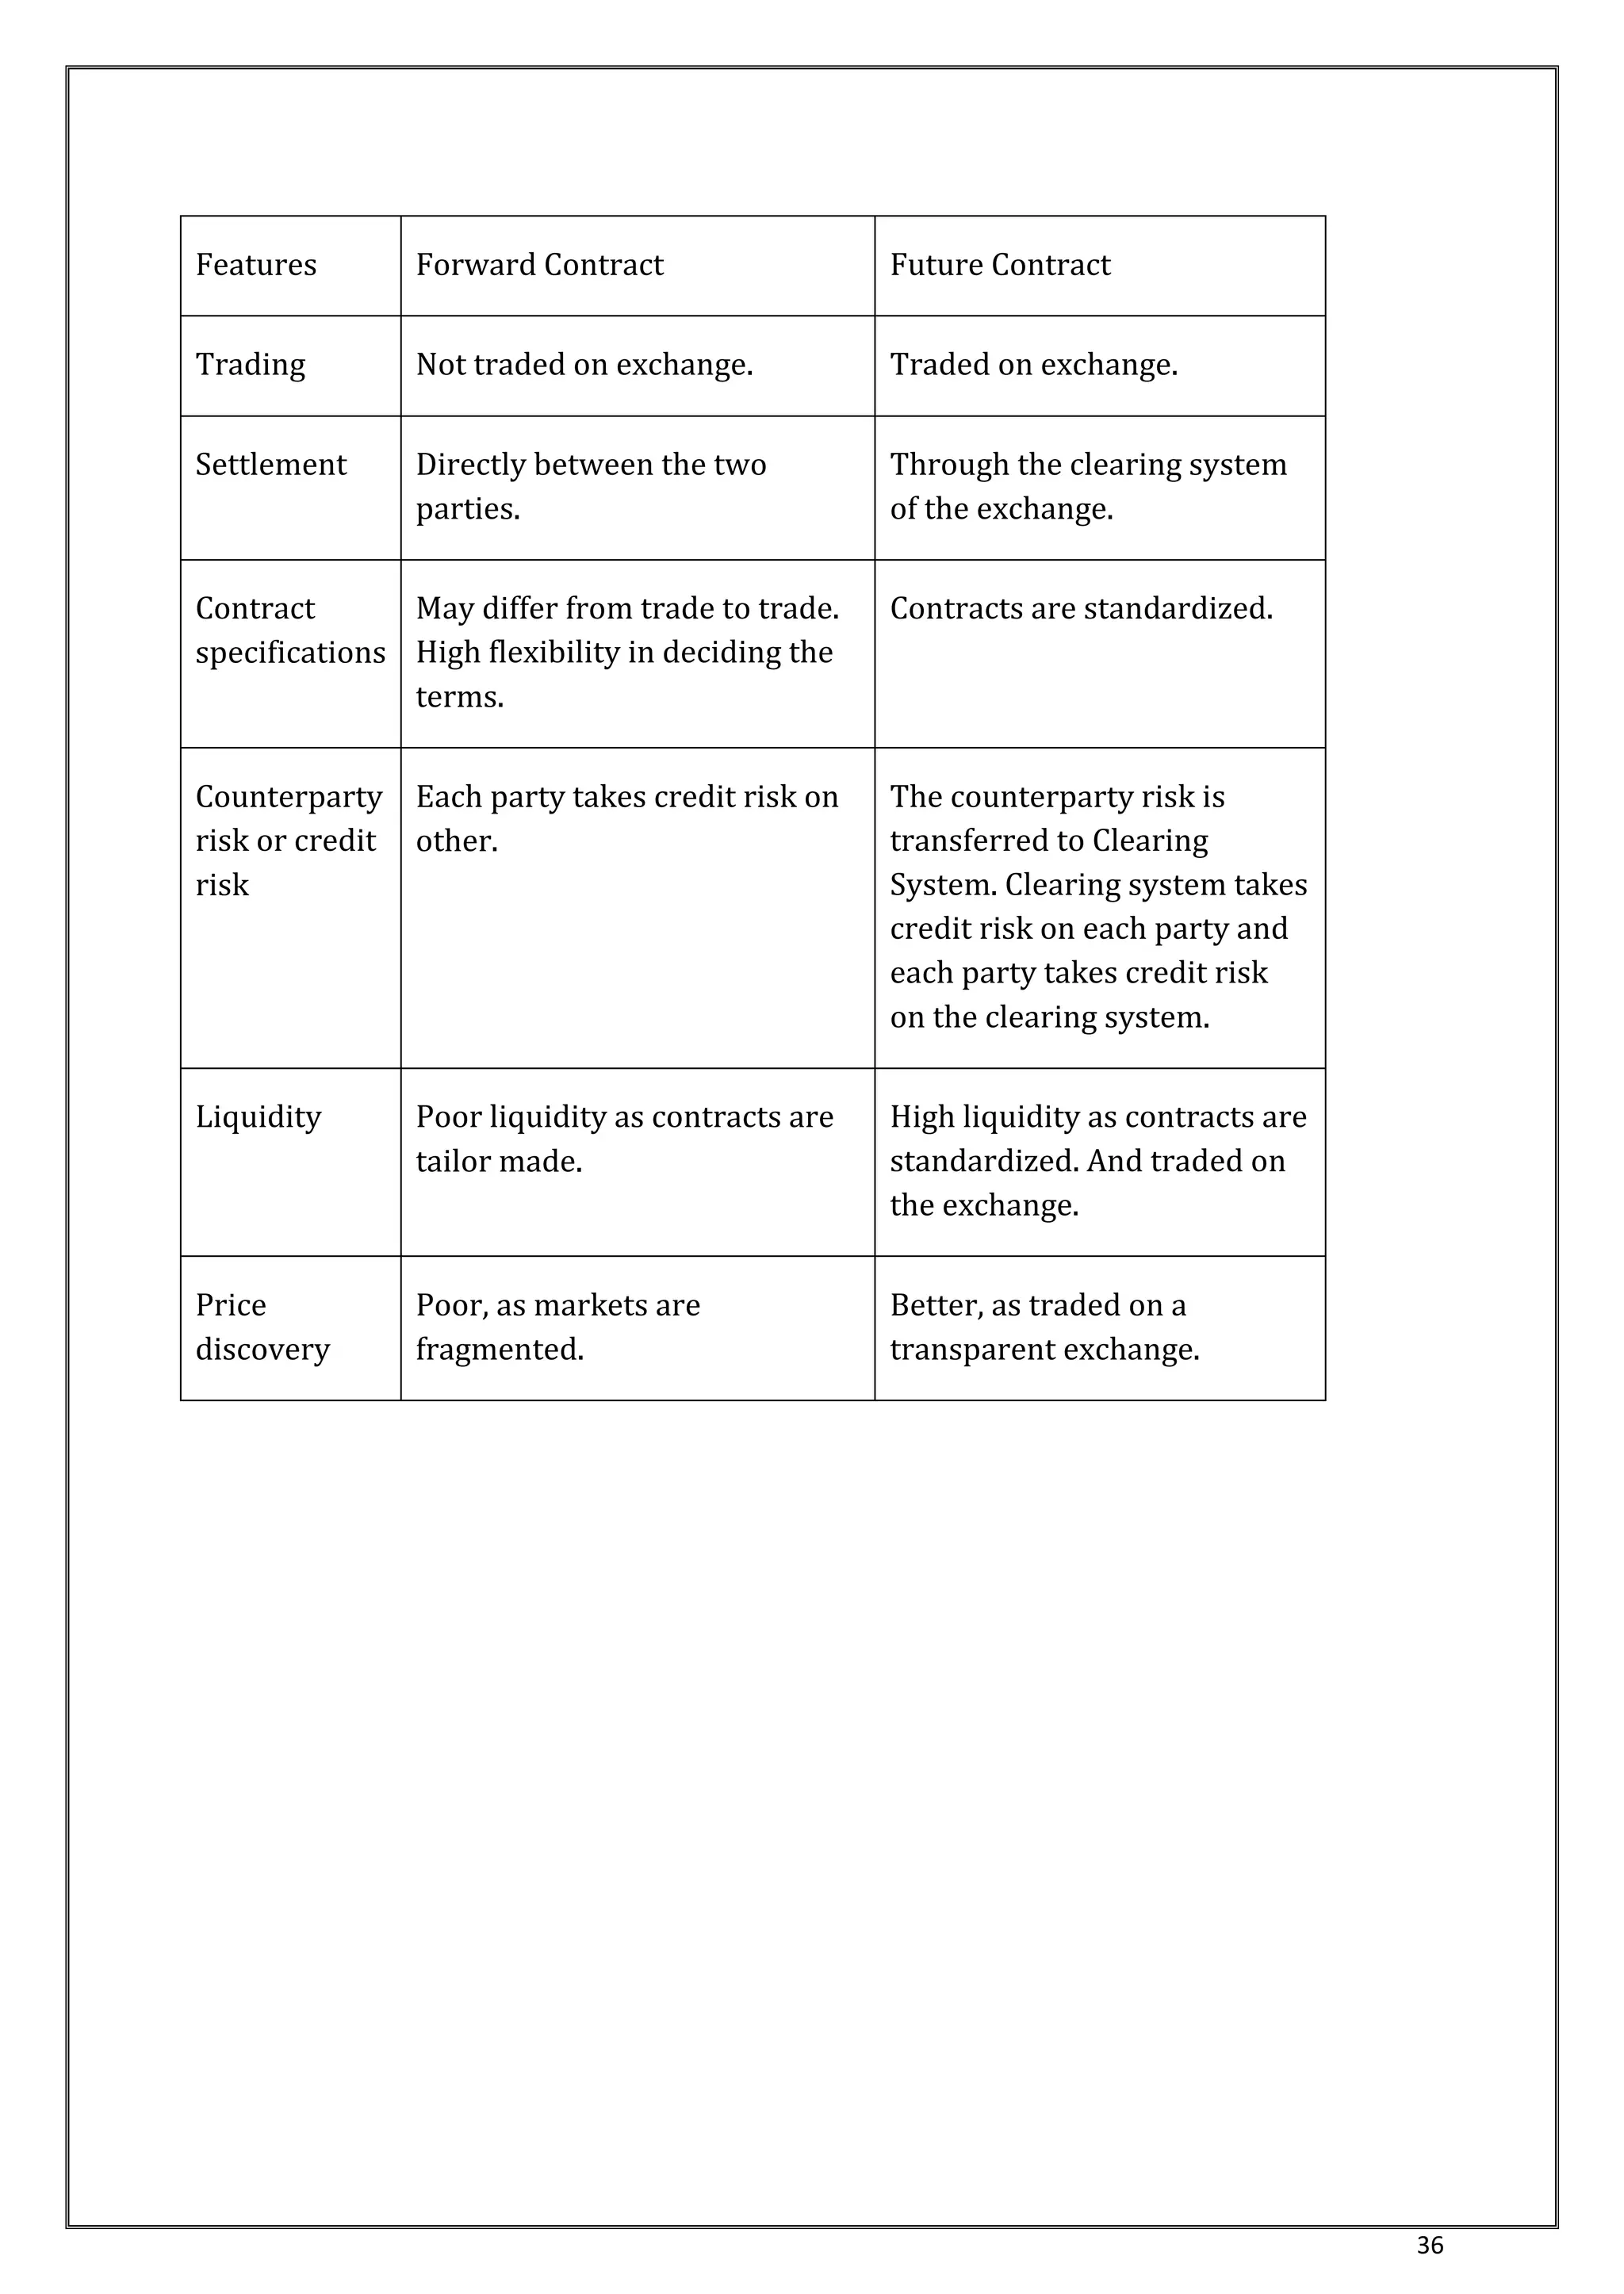
FORWARD CONTRACT-------------------------------------- [37]
DEFINATION
FEATURES
USE & LIMITATIONS
CHAPTER-V
FUTURE CONTRACT-------------------------------------- [40]
DEFINITION
FEATURES
MARGINE
CHAPTER-VI
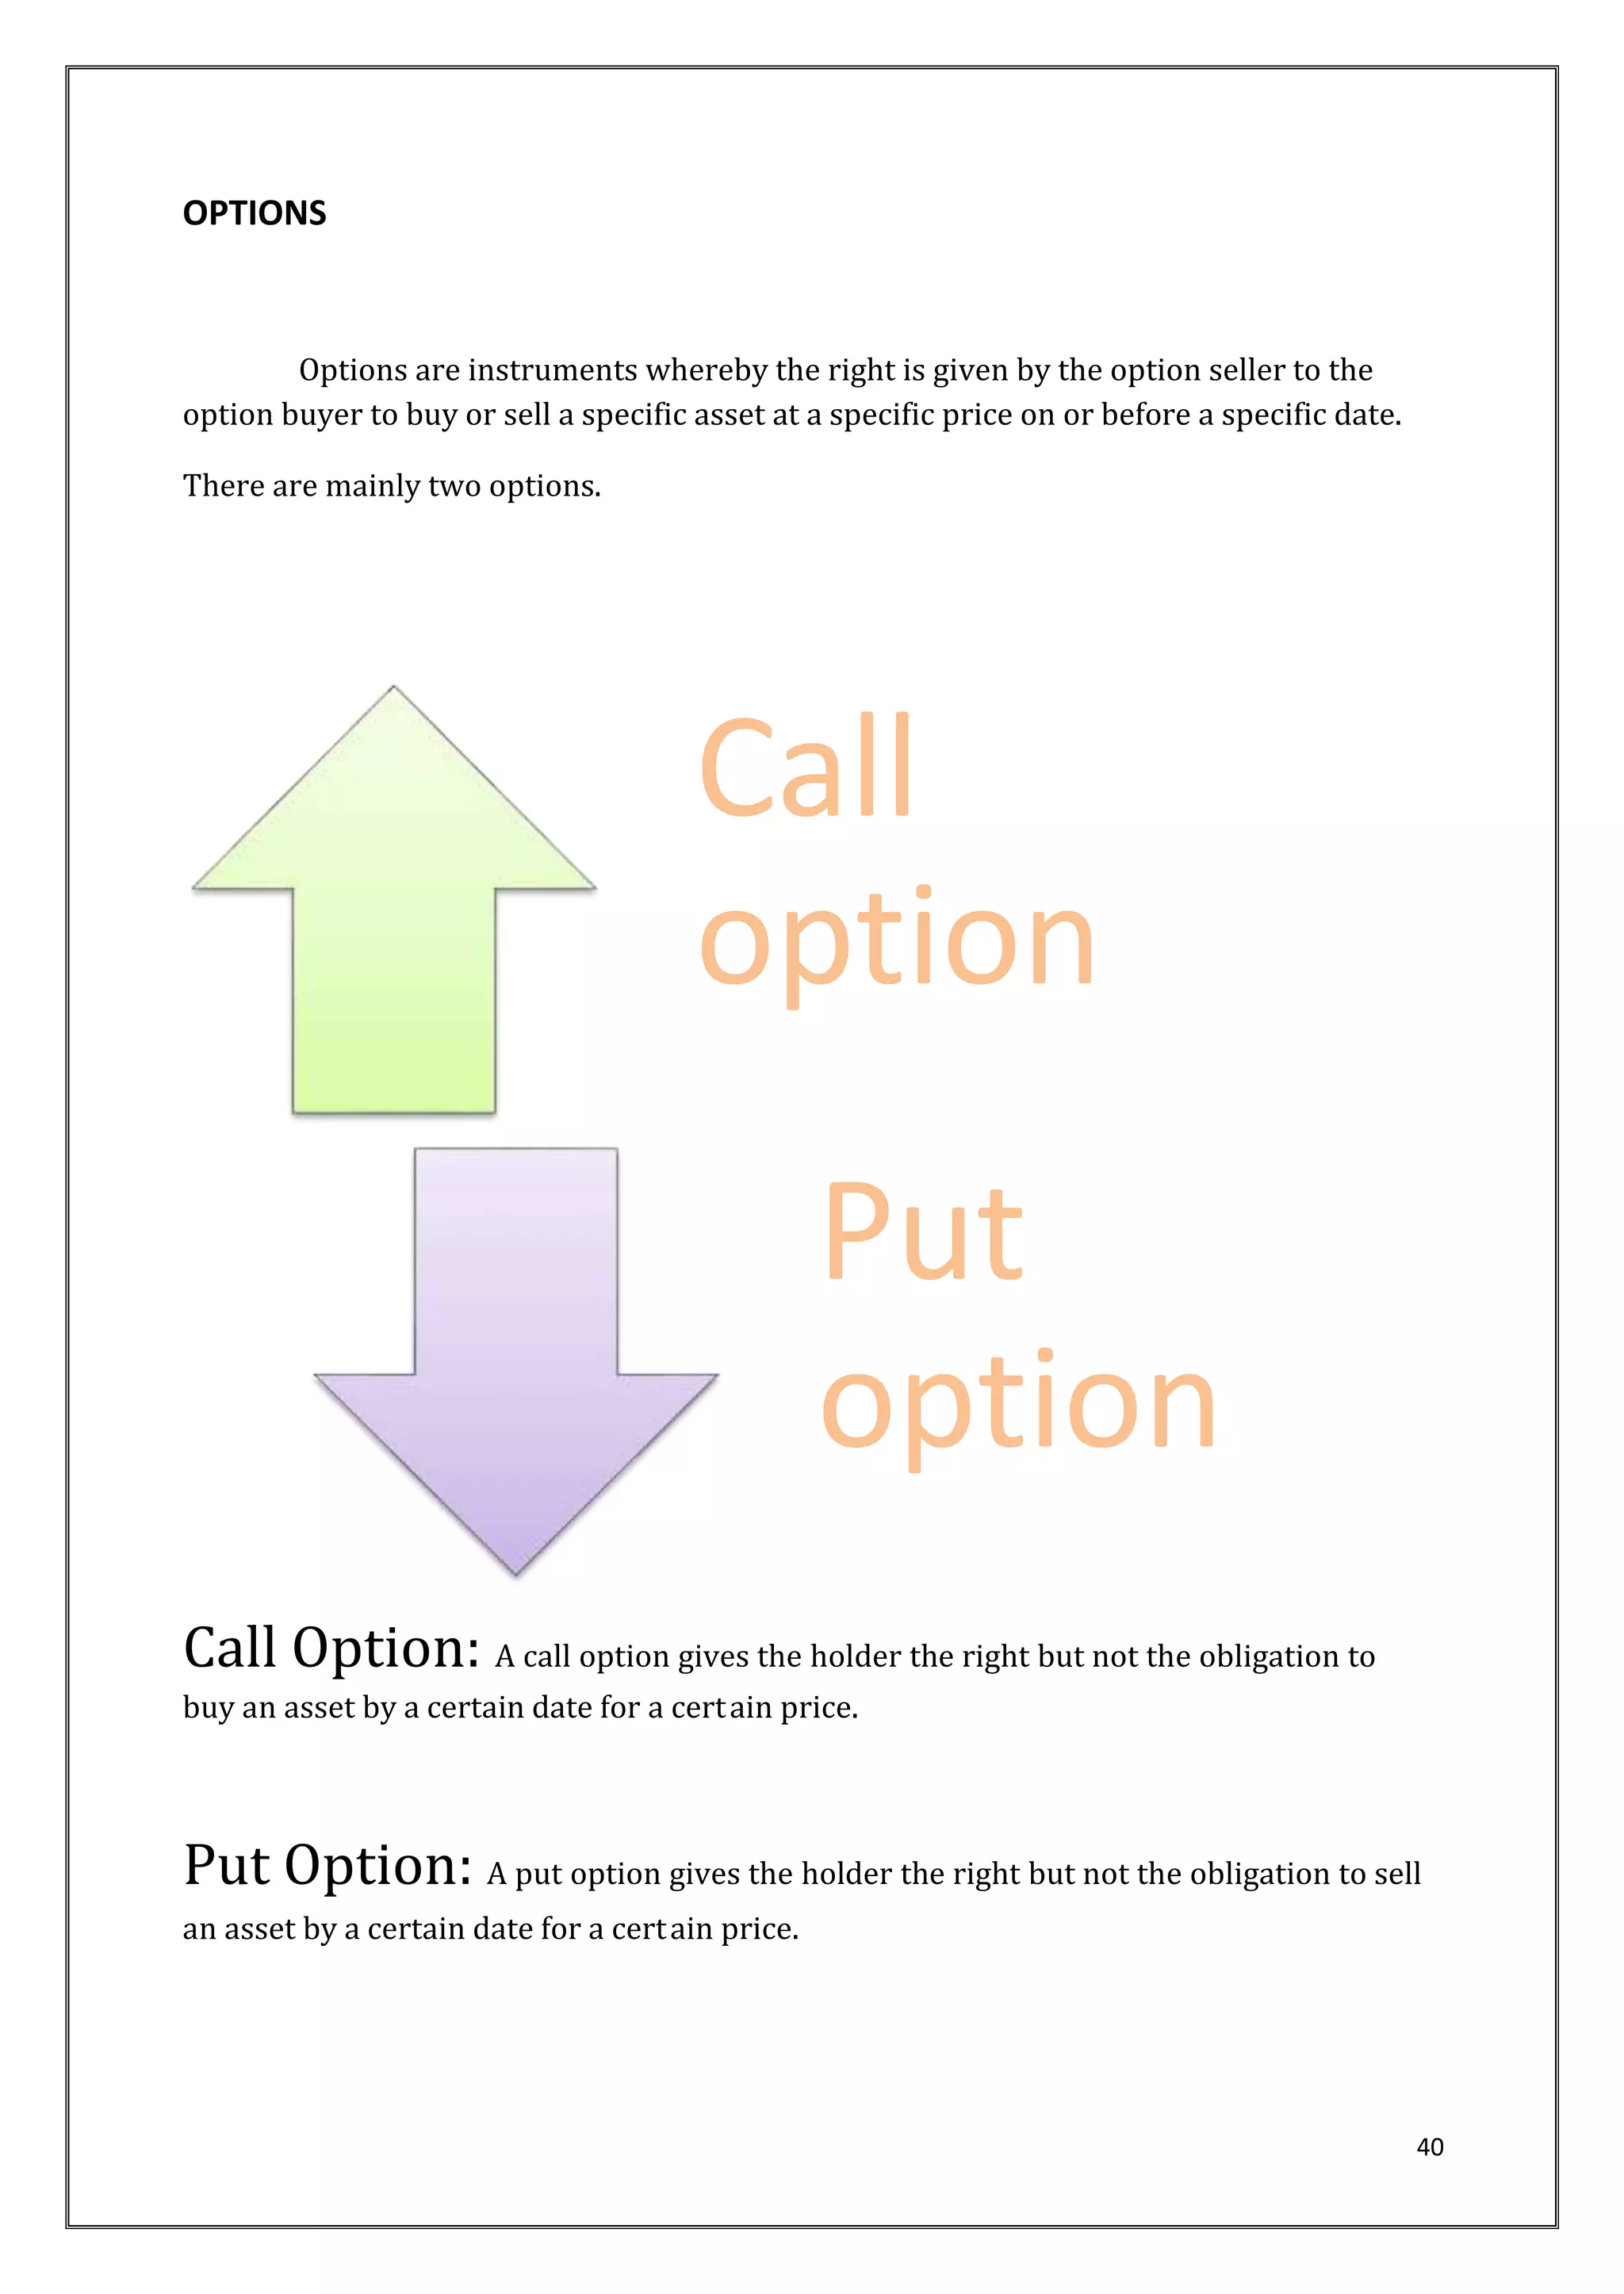
OPTIONS CONTRACT ------------------------ [47]
DEFINITION
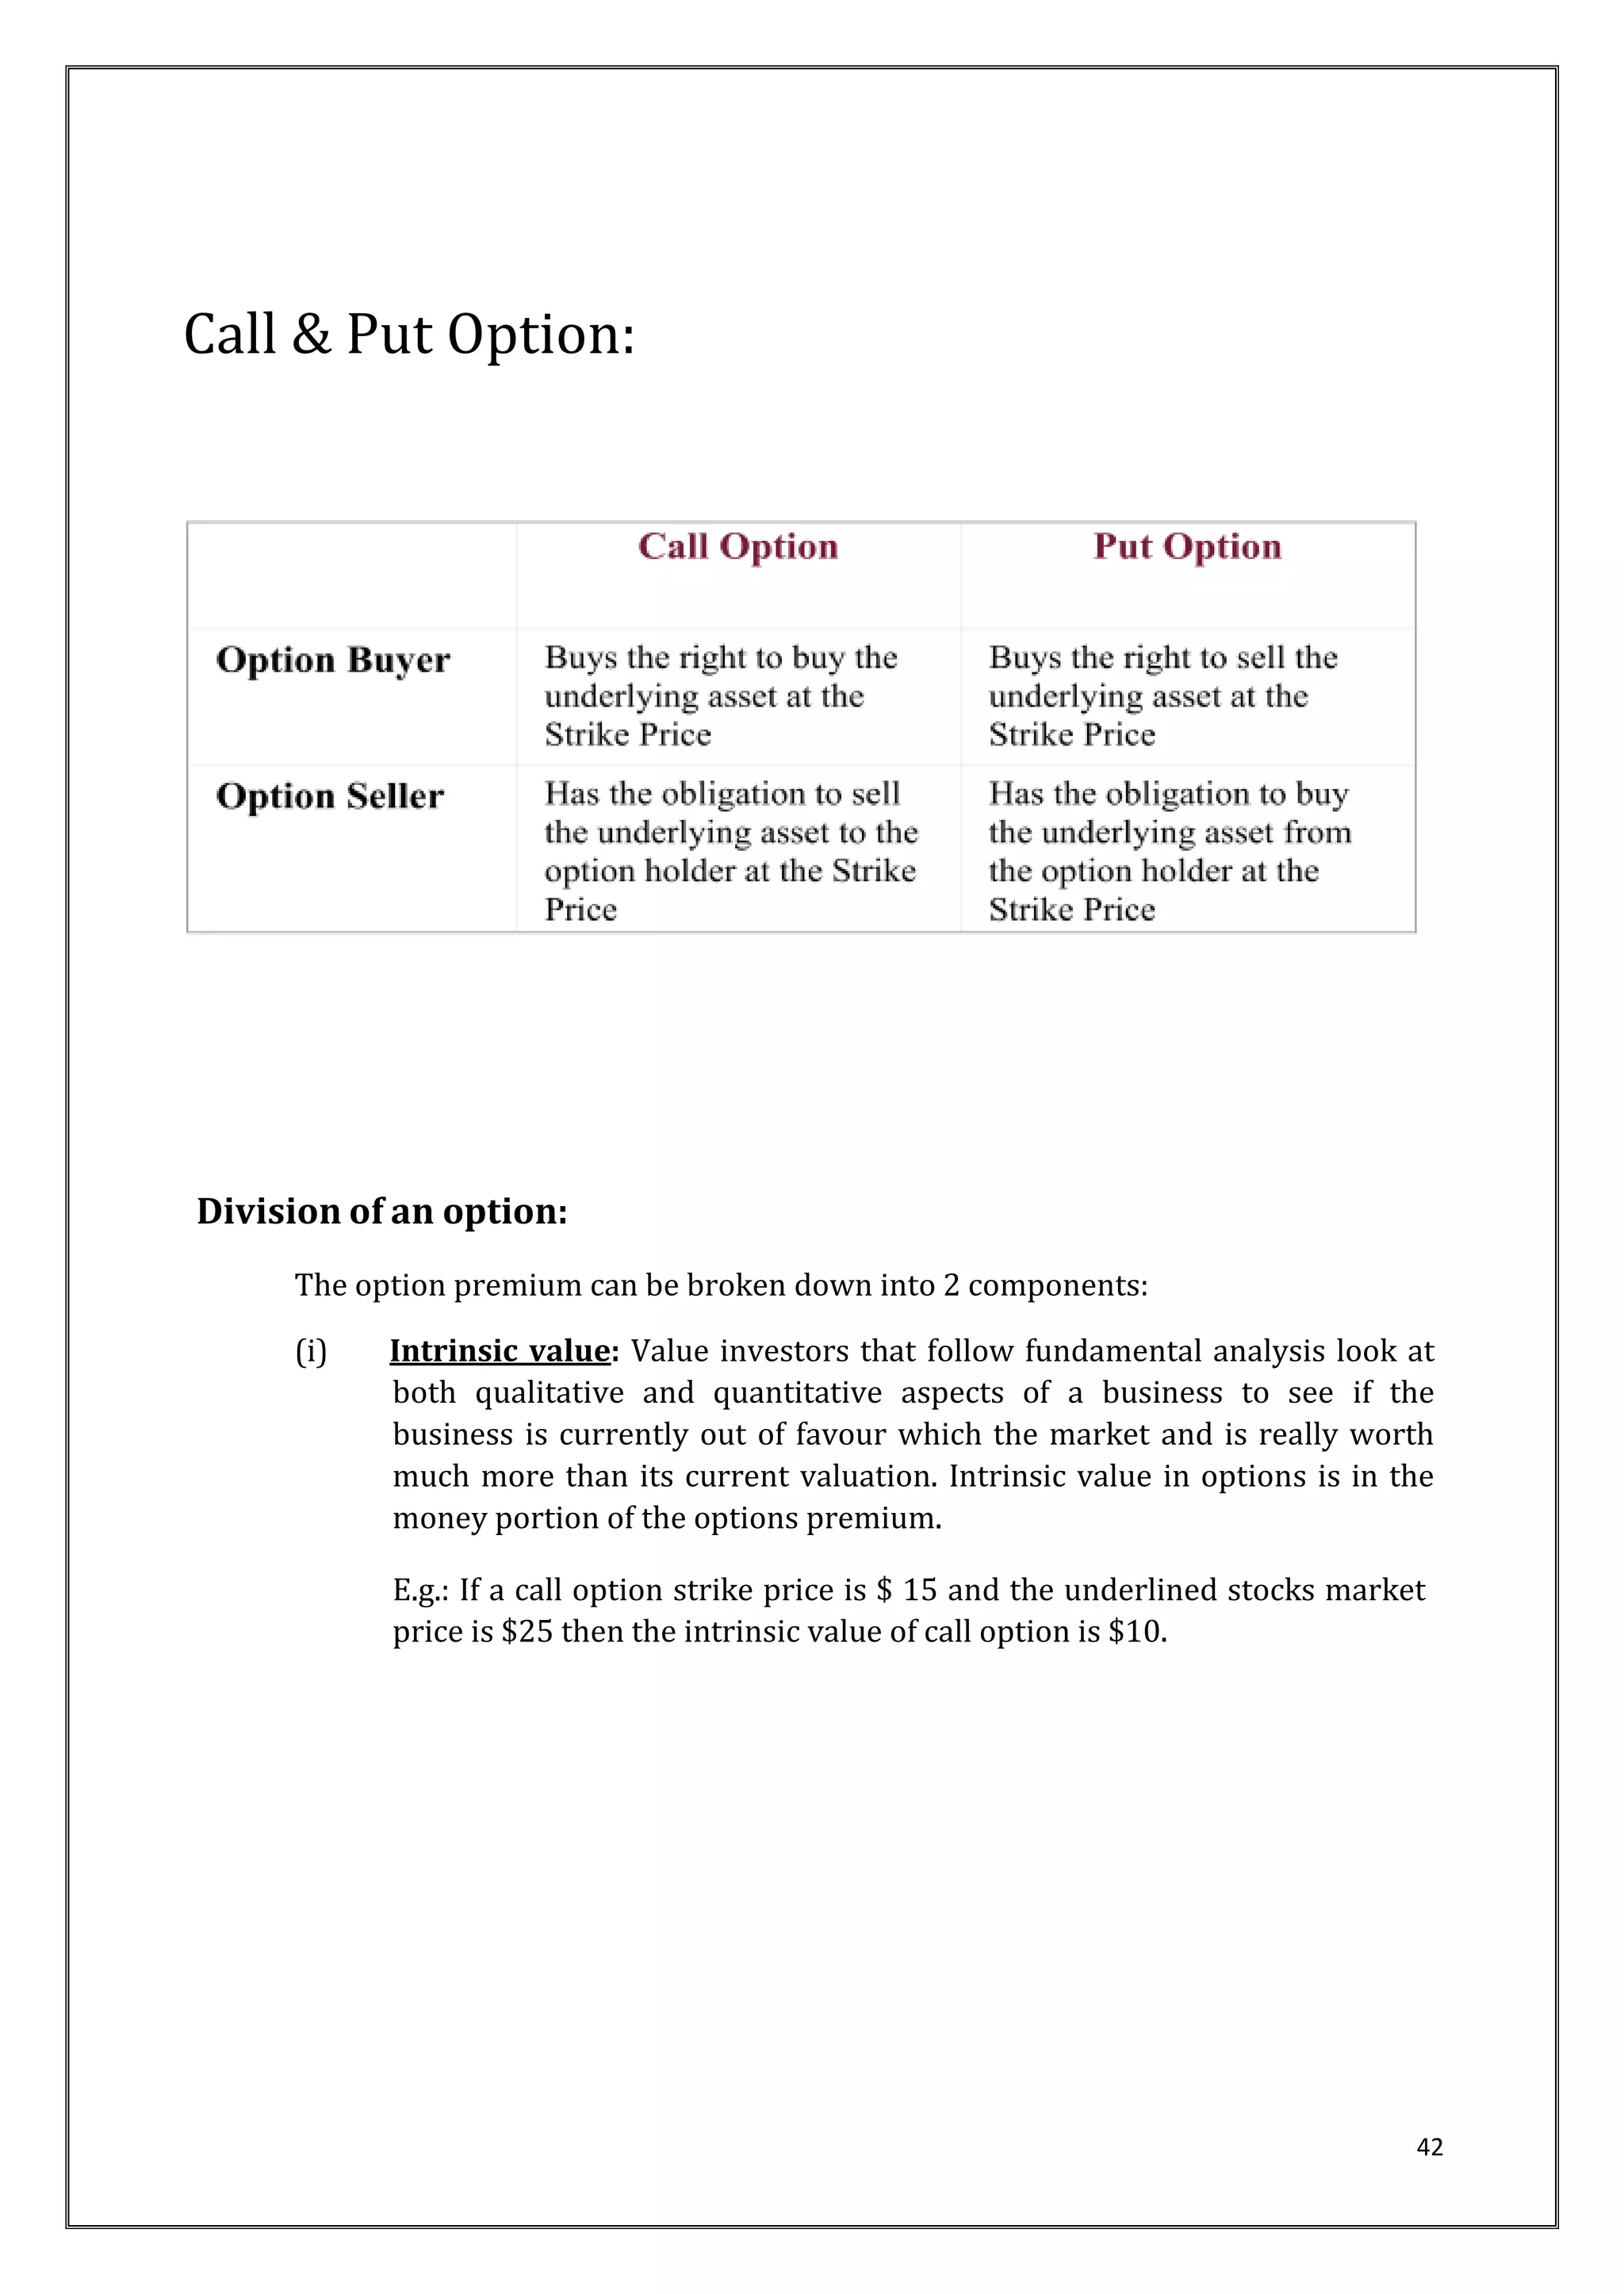
CALL OPTION
PUT OPTION
CHAPTER-VII
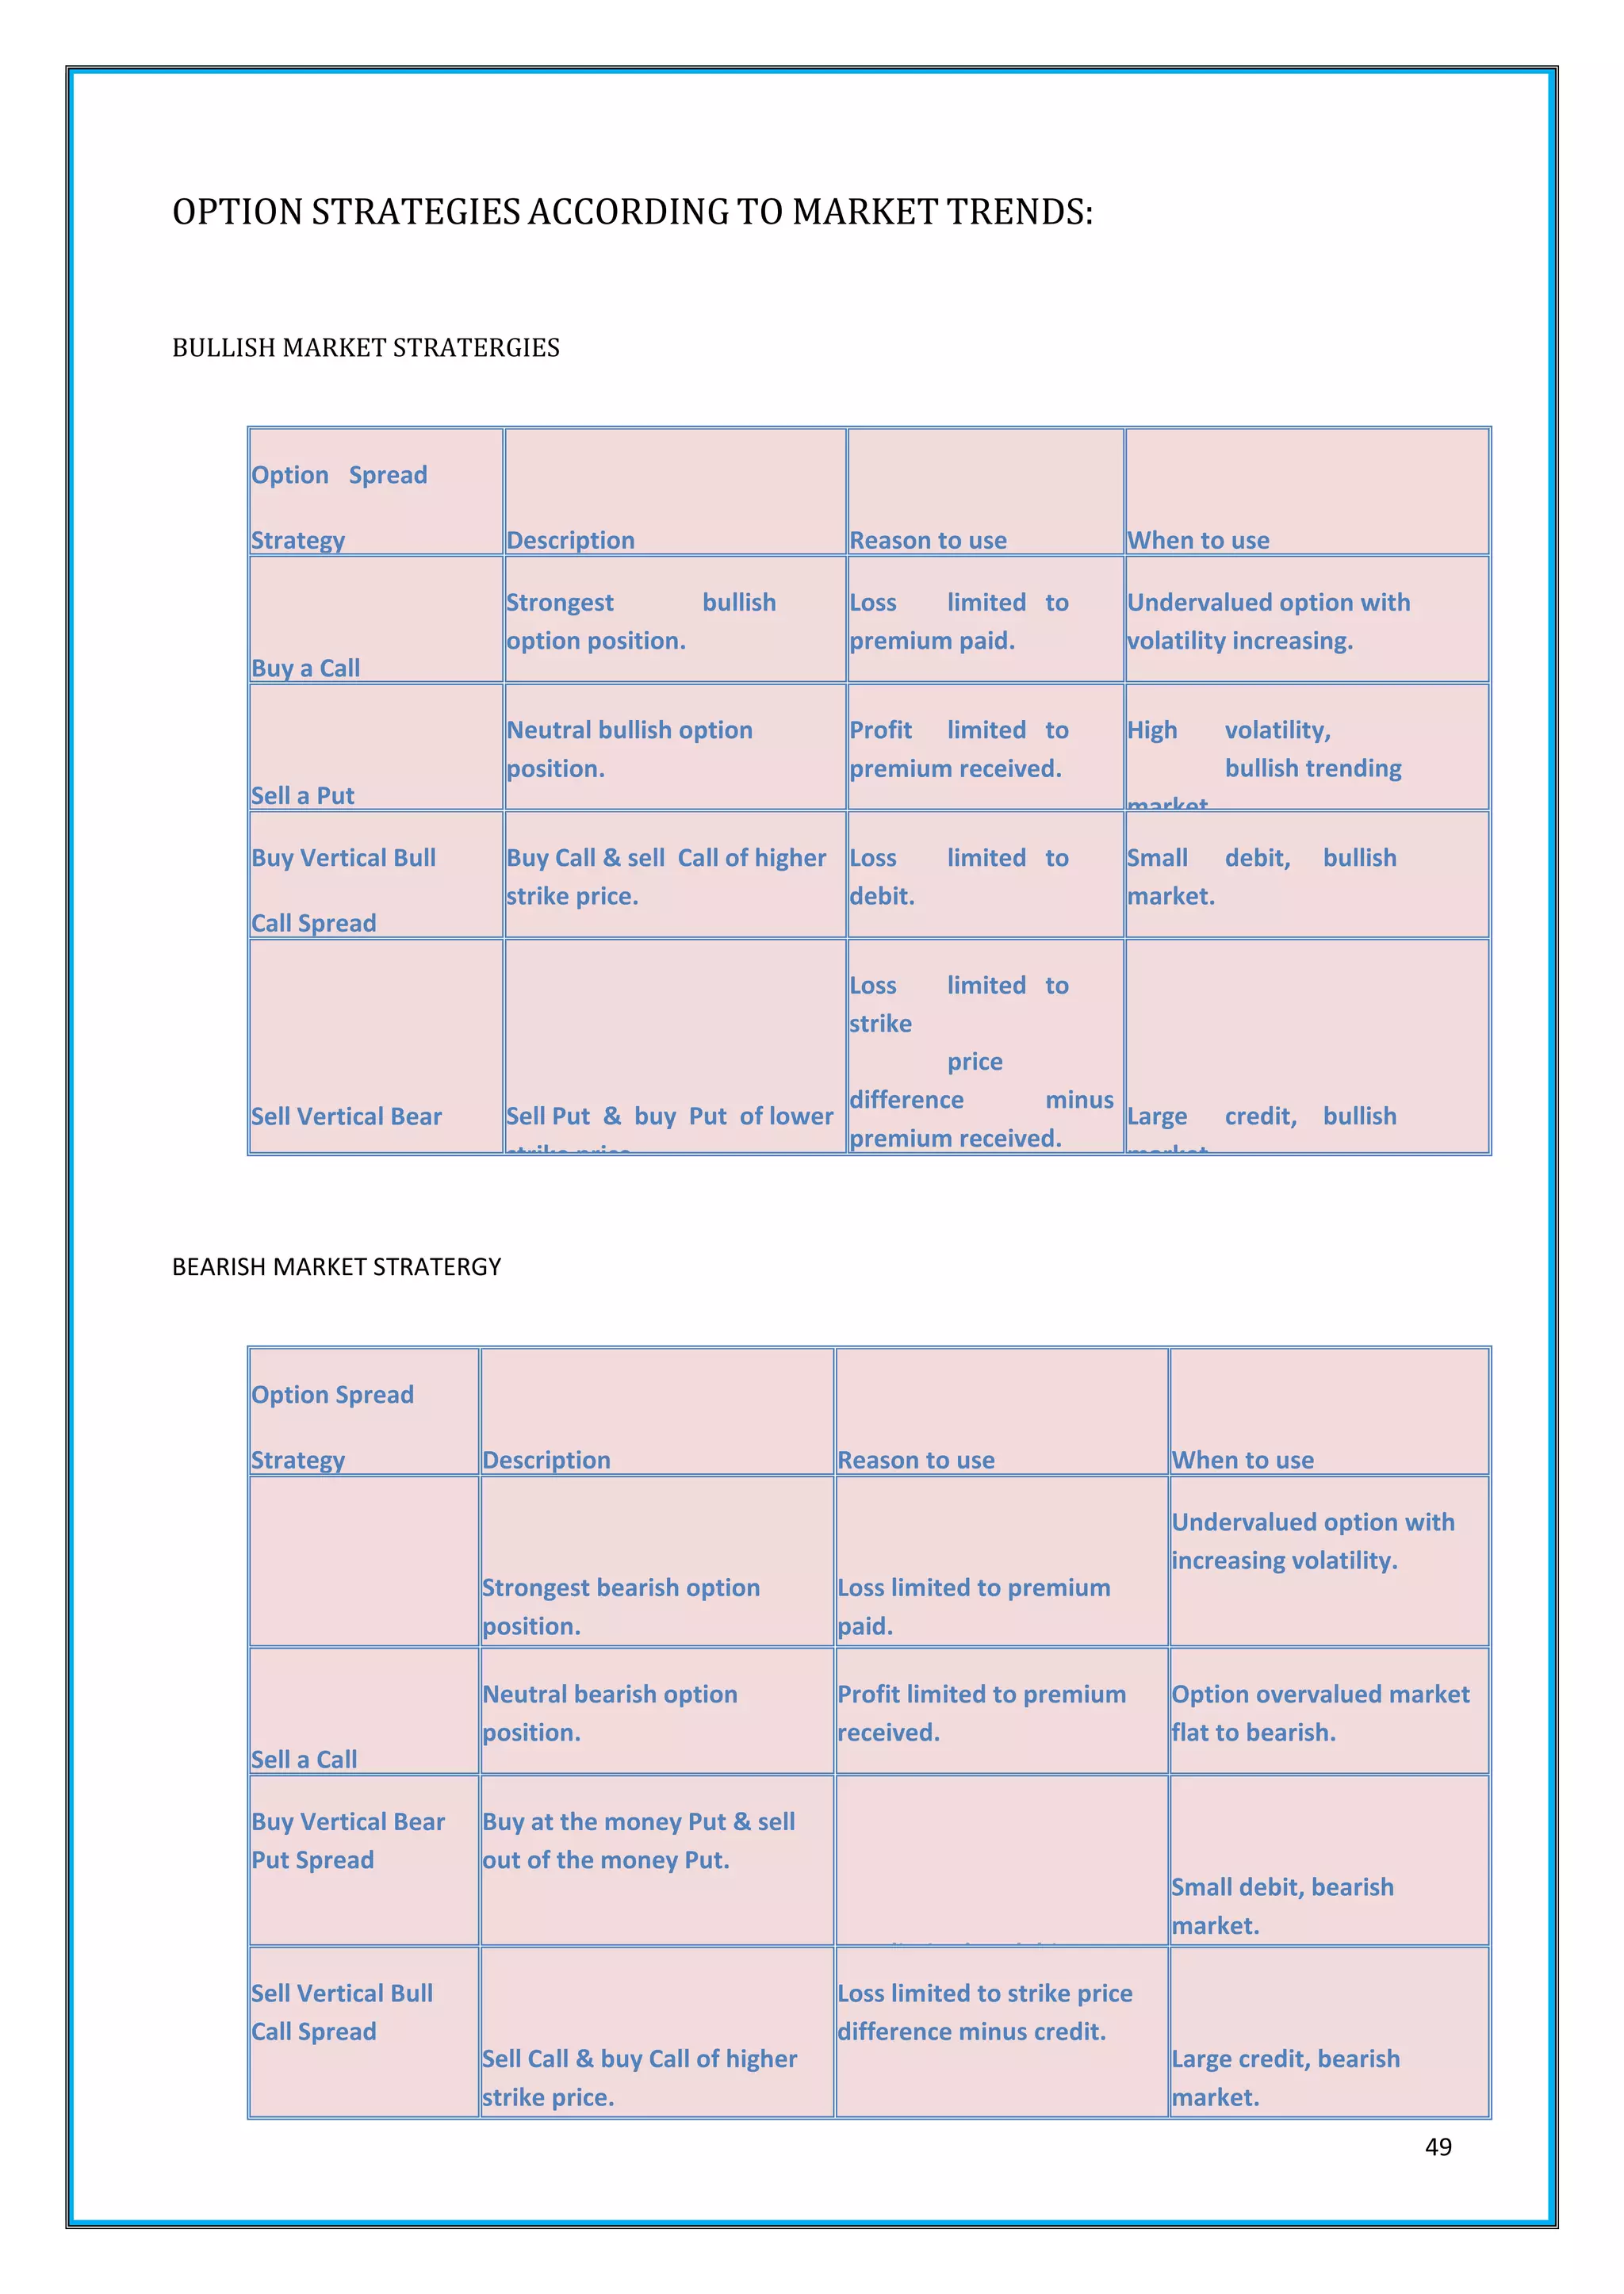
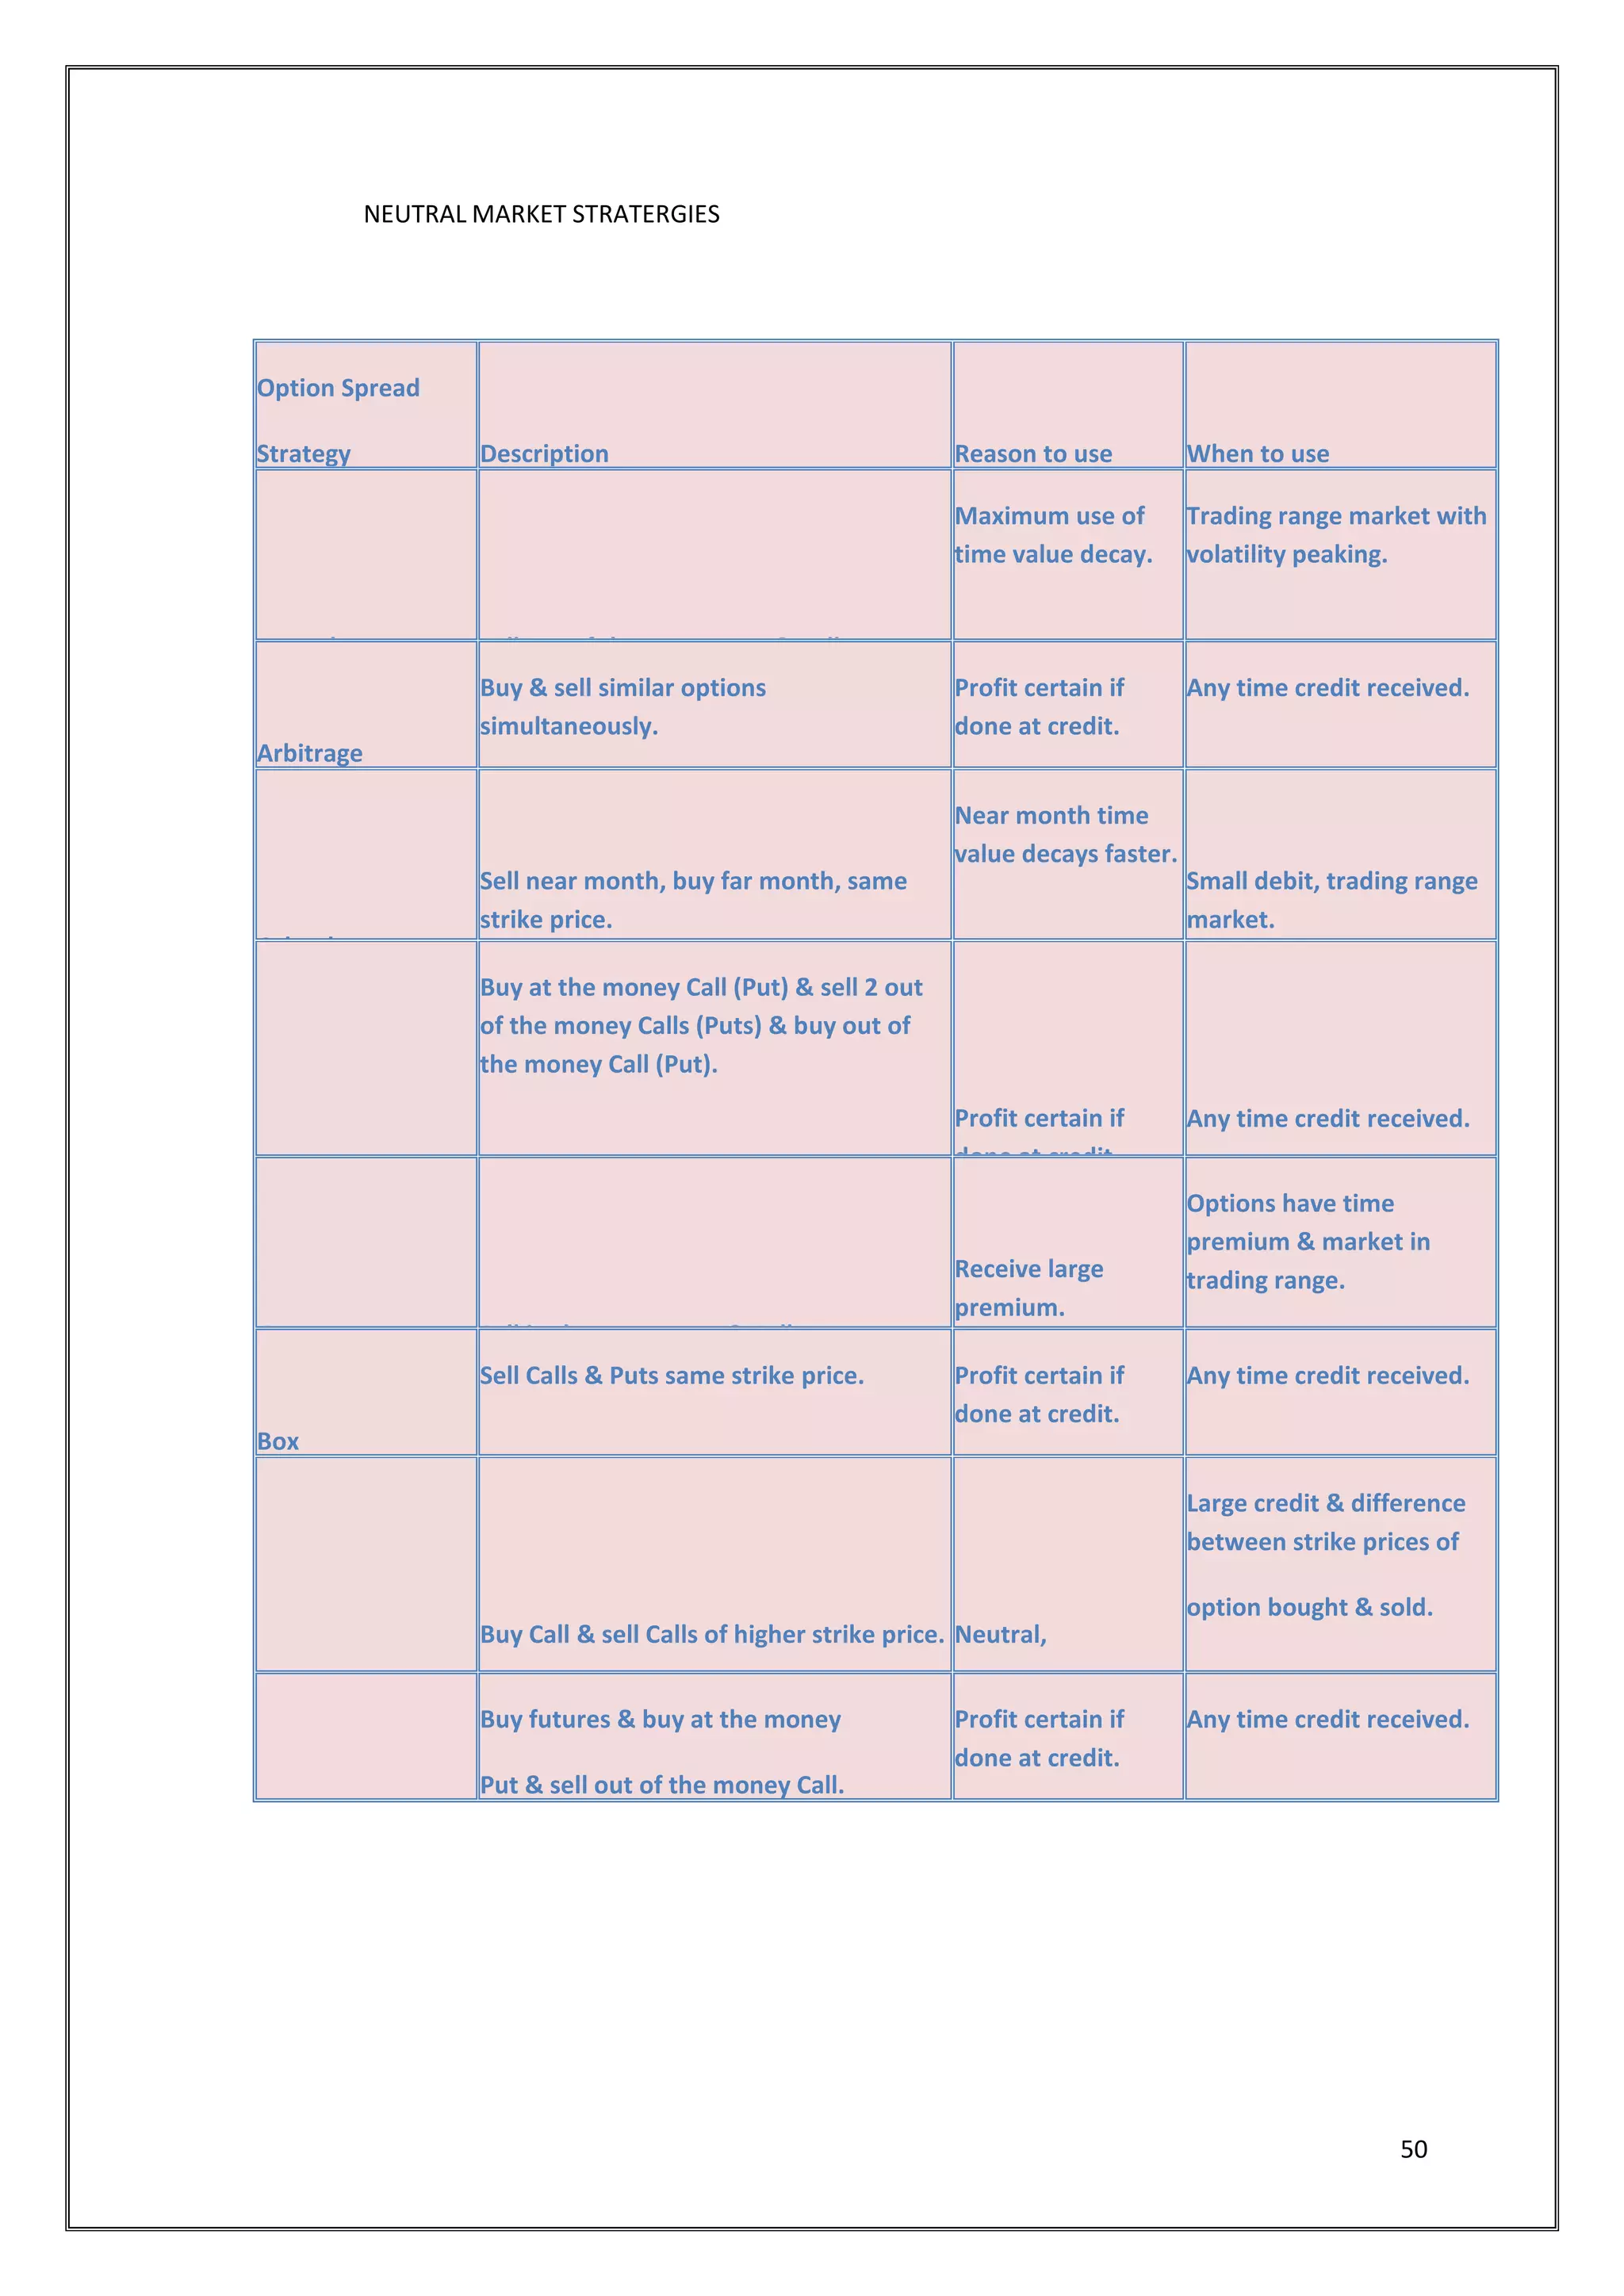
MARKET TRENDS & OPTIONS STRATEGY OVERVIEW------------------------ [50]
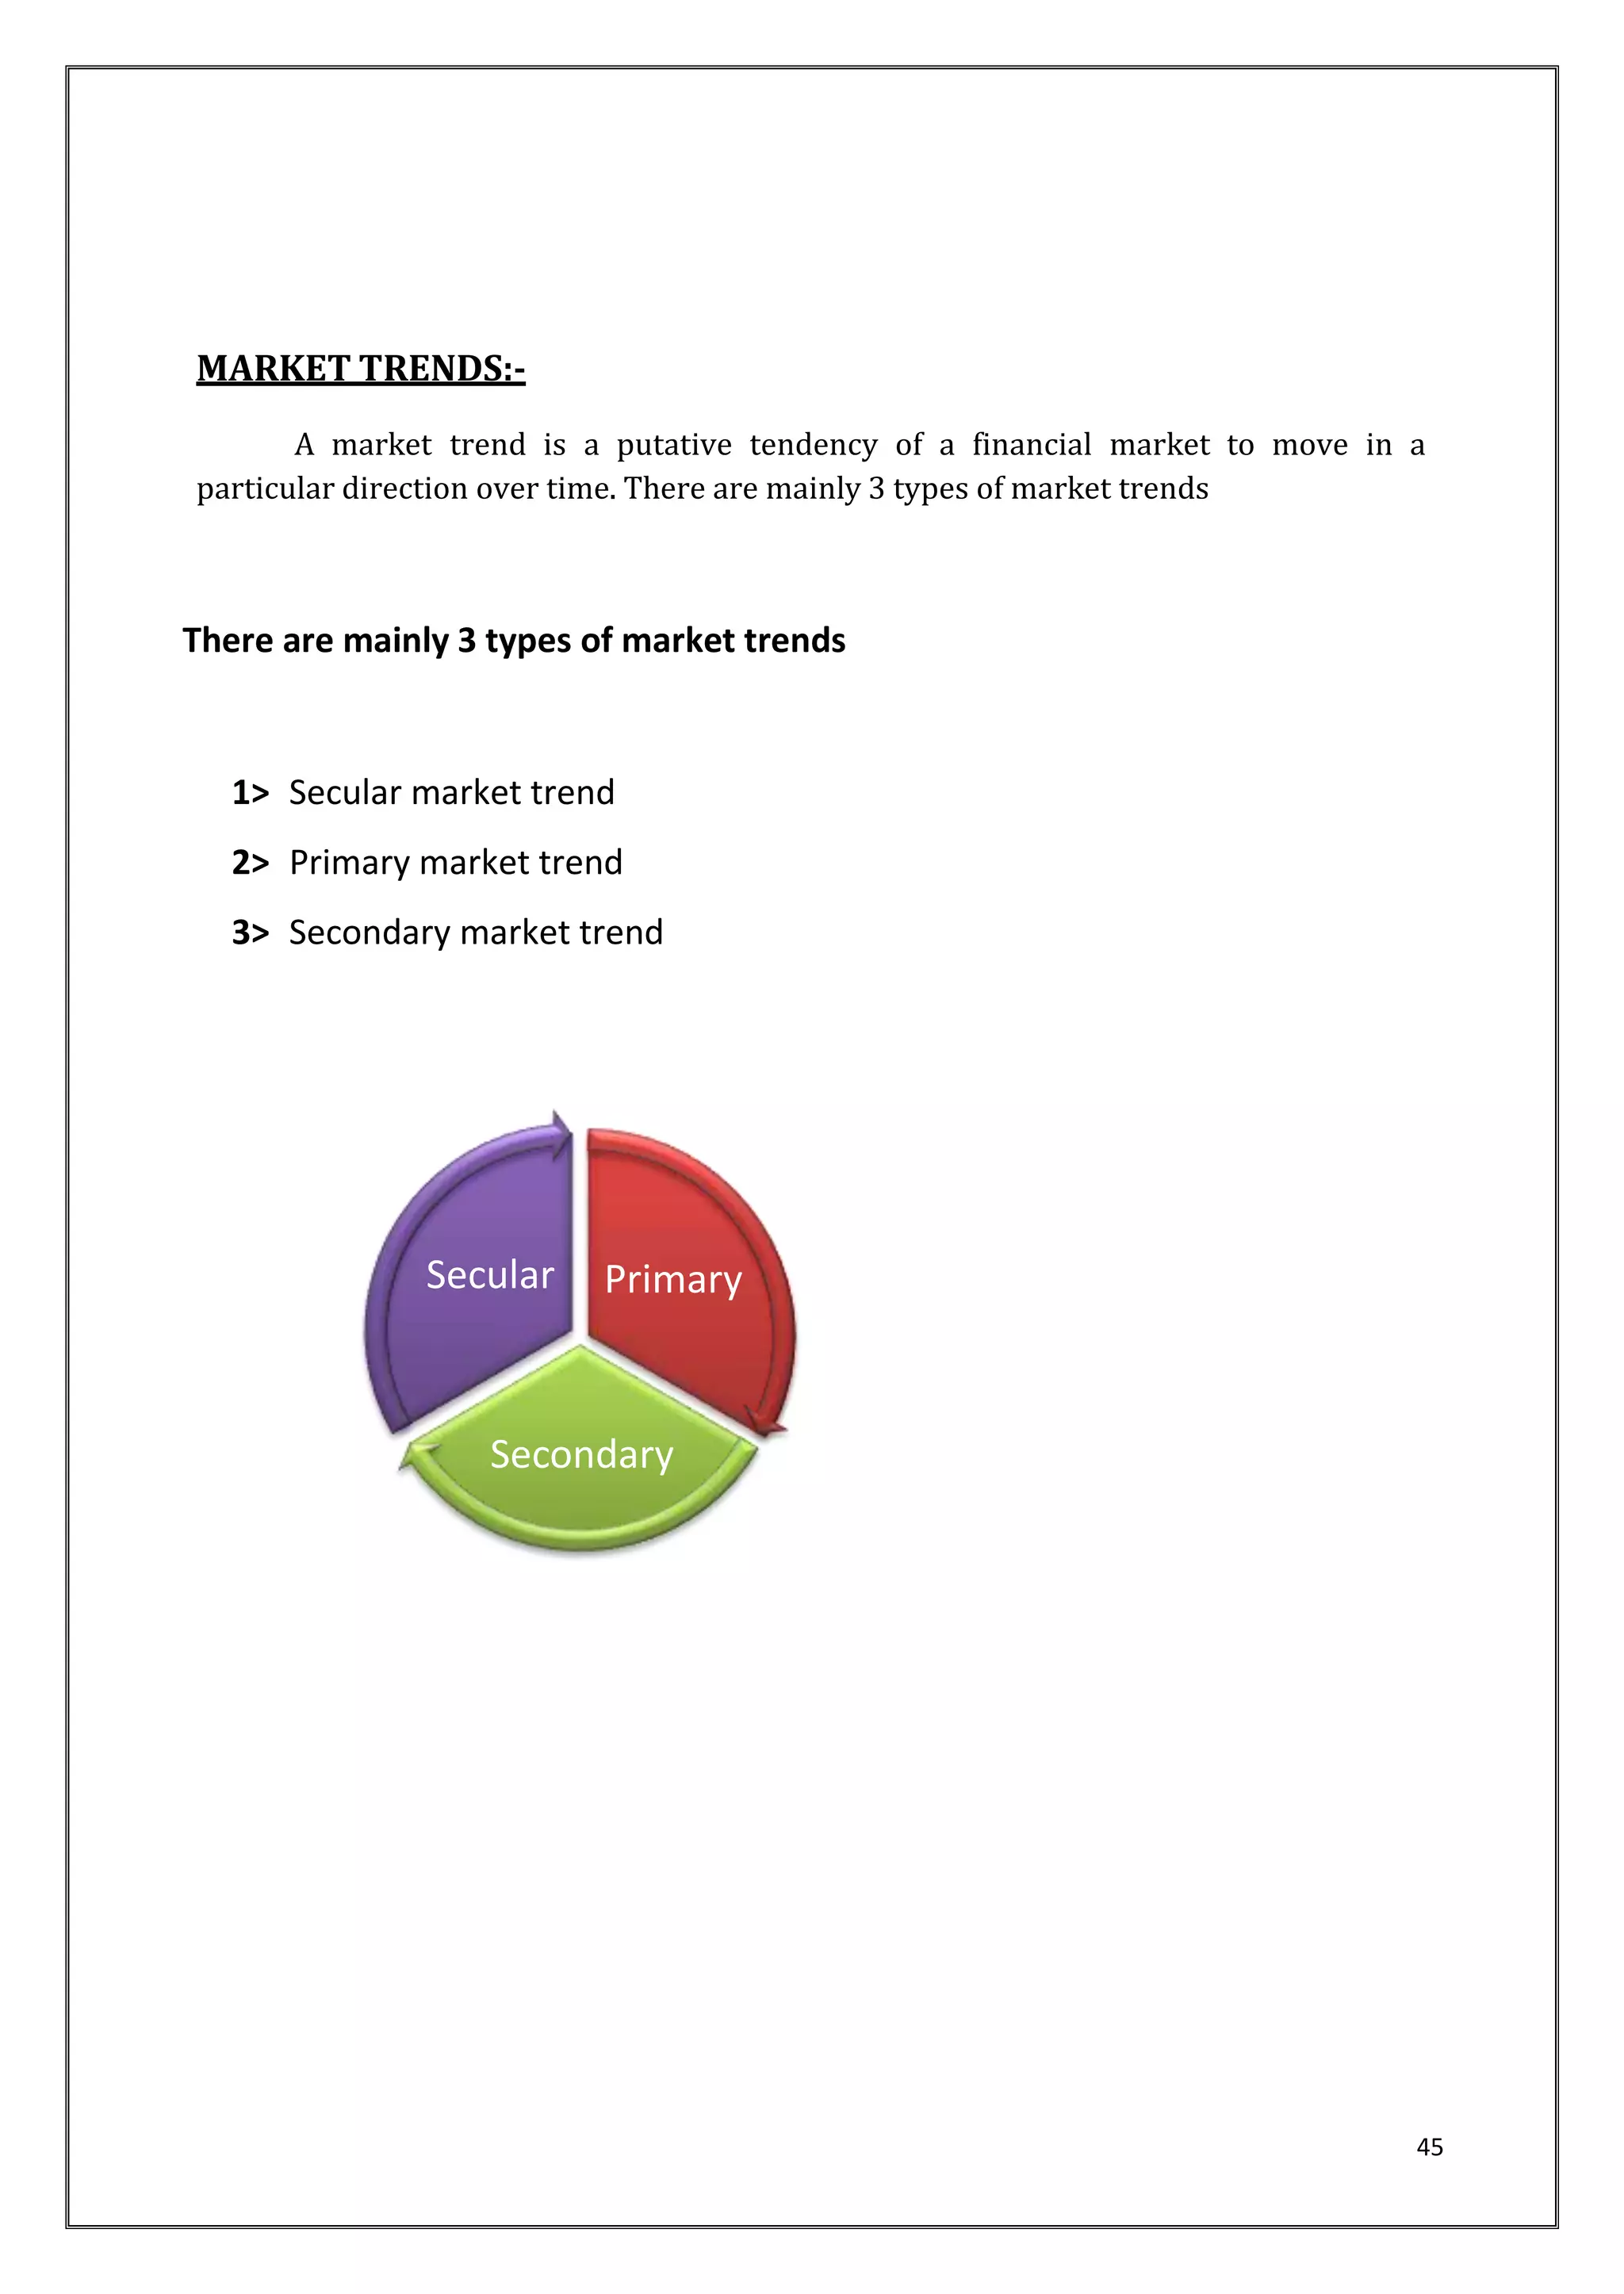
TYPES OF MARKET TREND
OPTION STRATEGY ACCORDING TO MARKET TREND](https://image.slidesharecdn.com/prashangisip-141116233920-conversion-gate01/75/Prashangi-sip-6-2048.jpg)
![7
CHAPTER-VIII
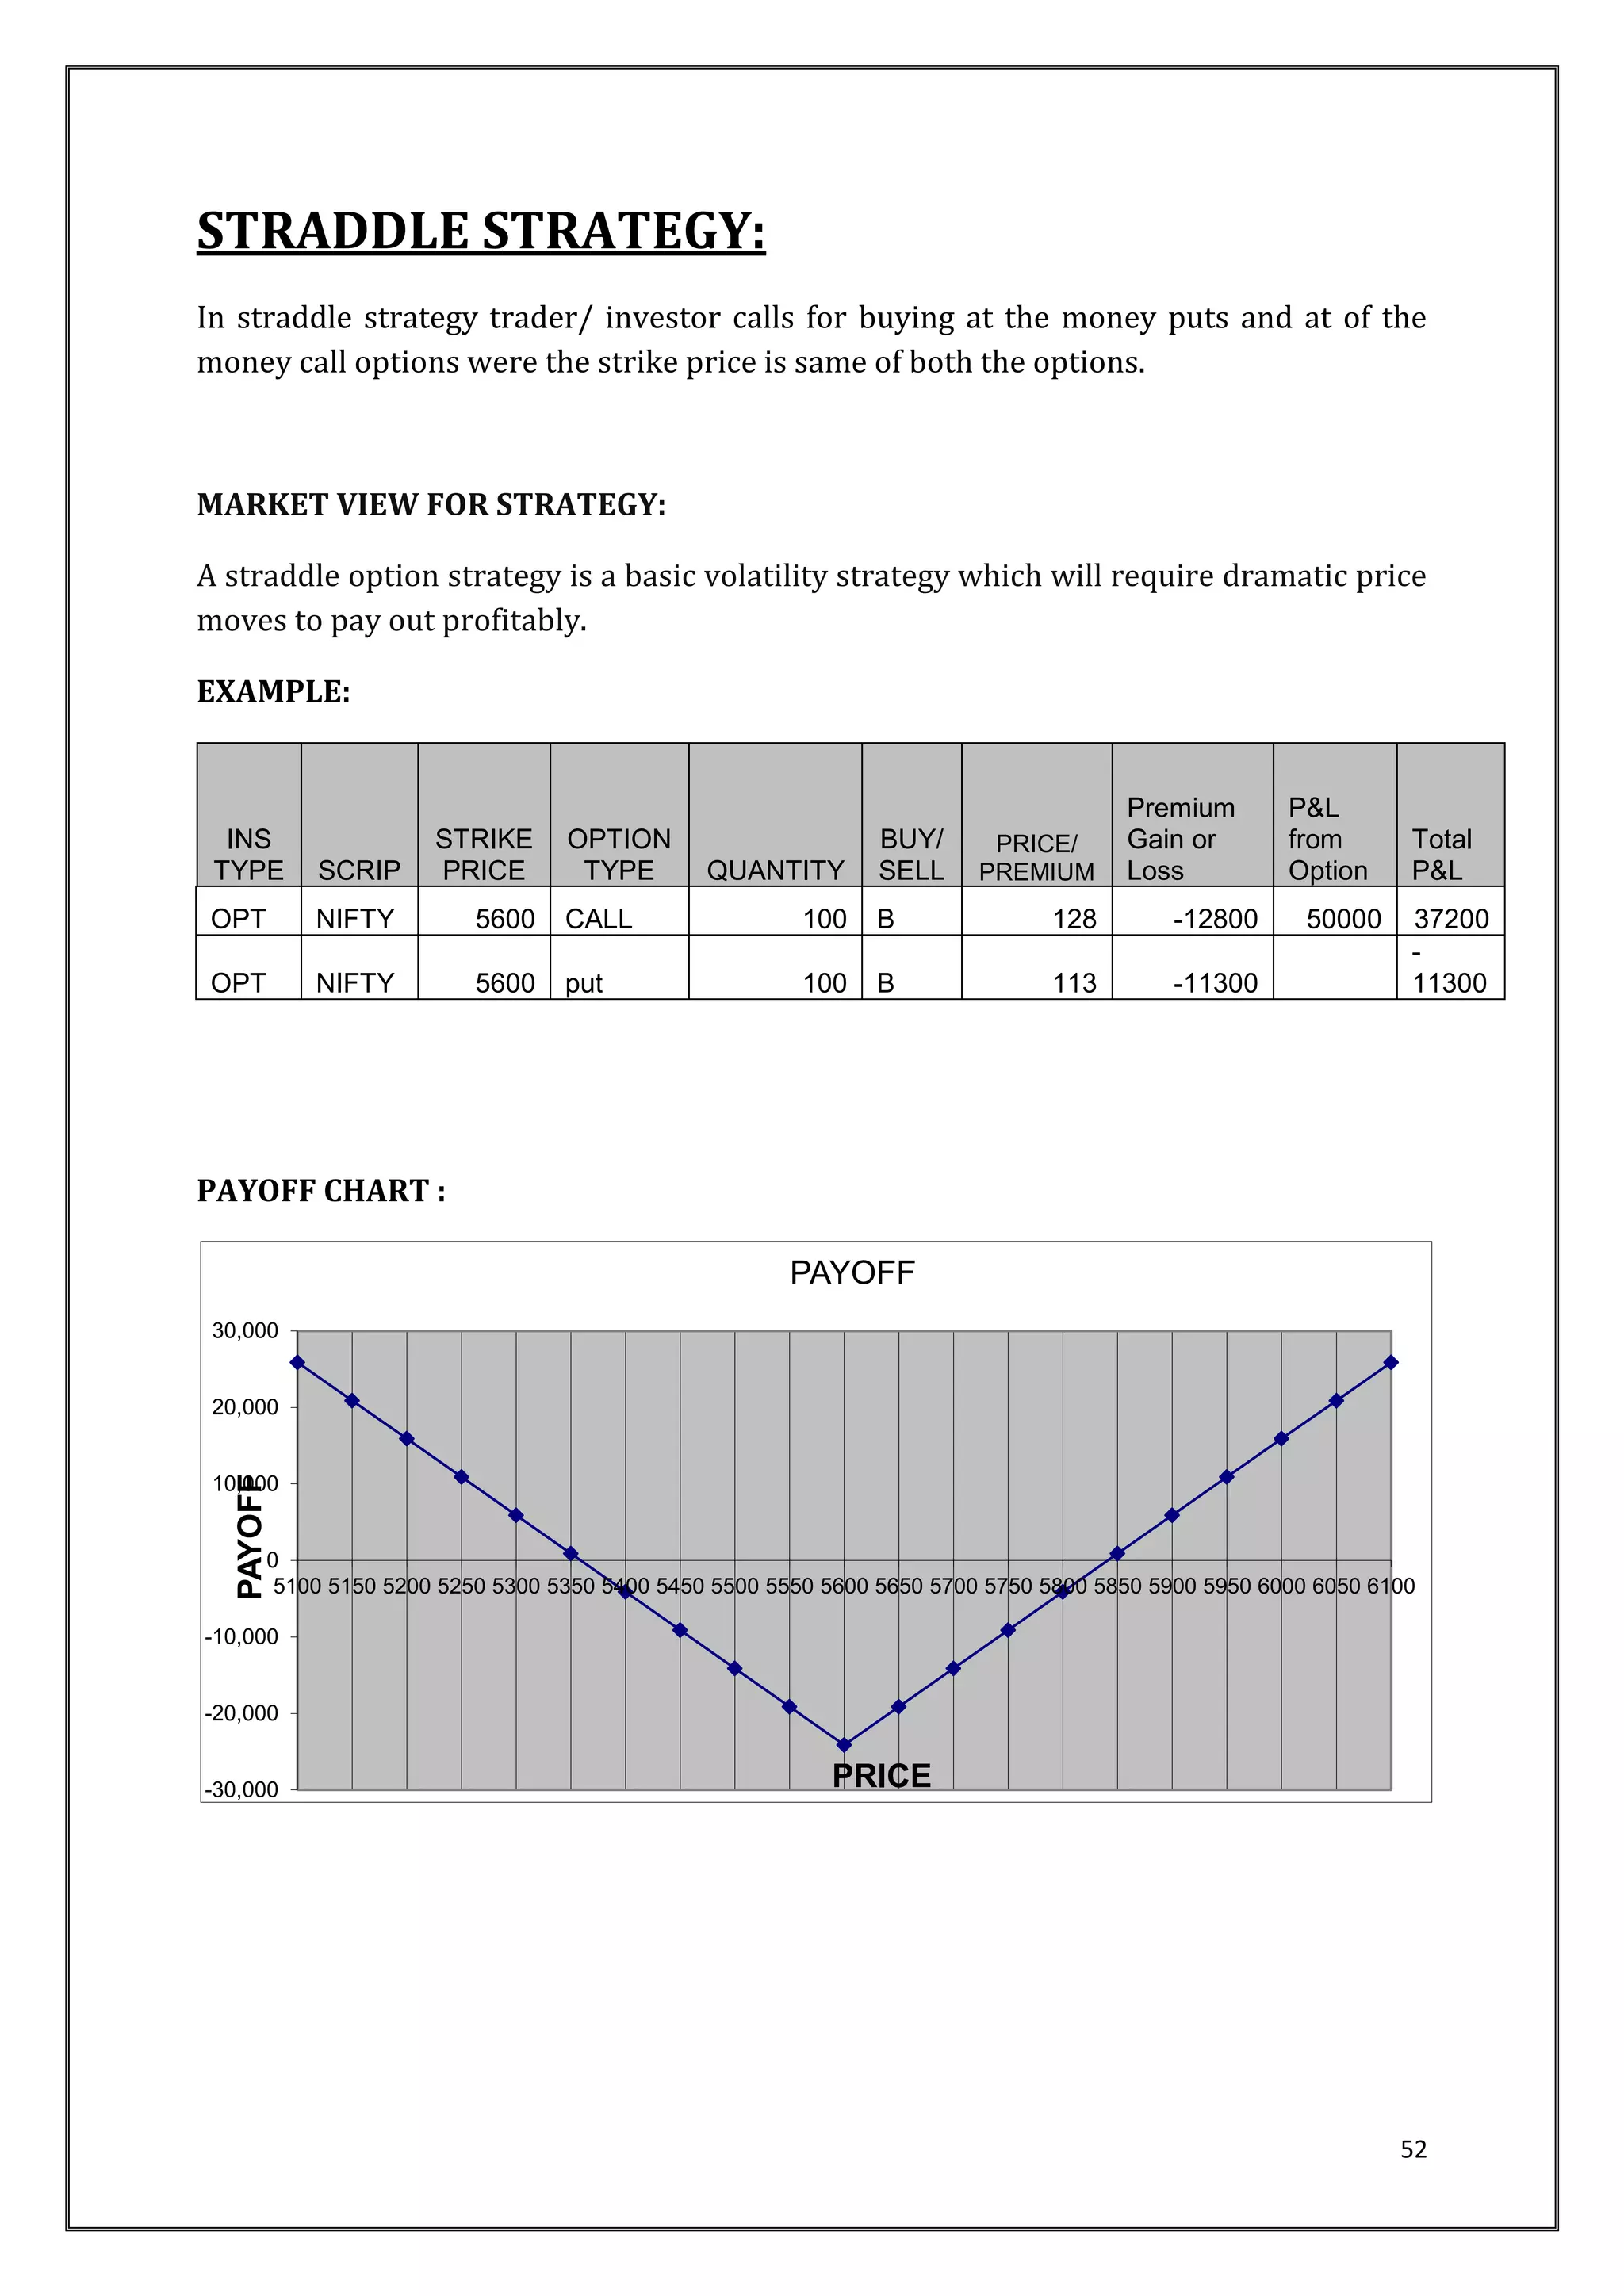
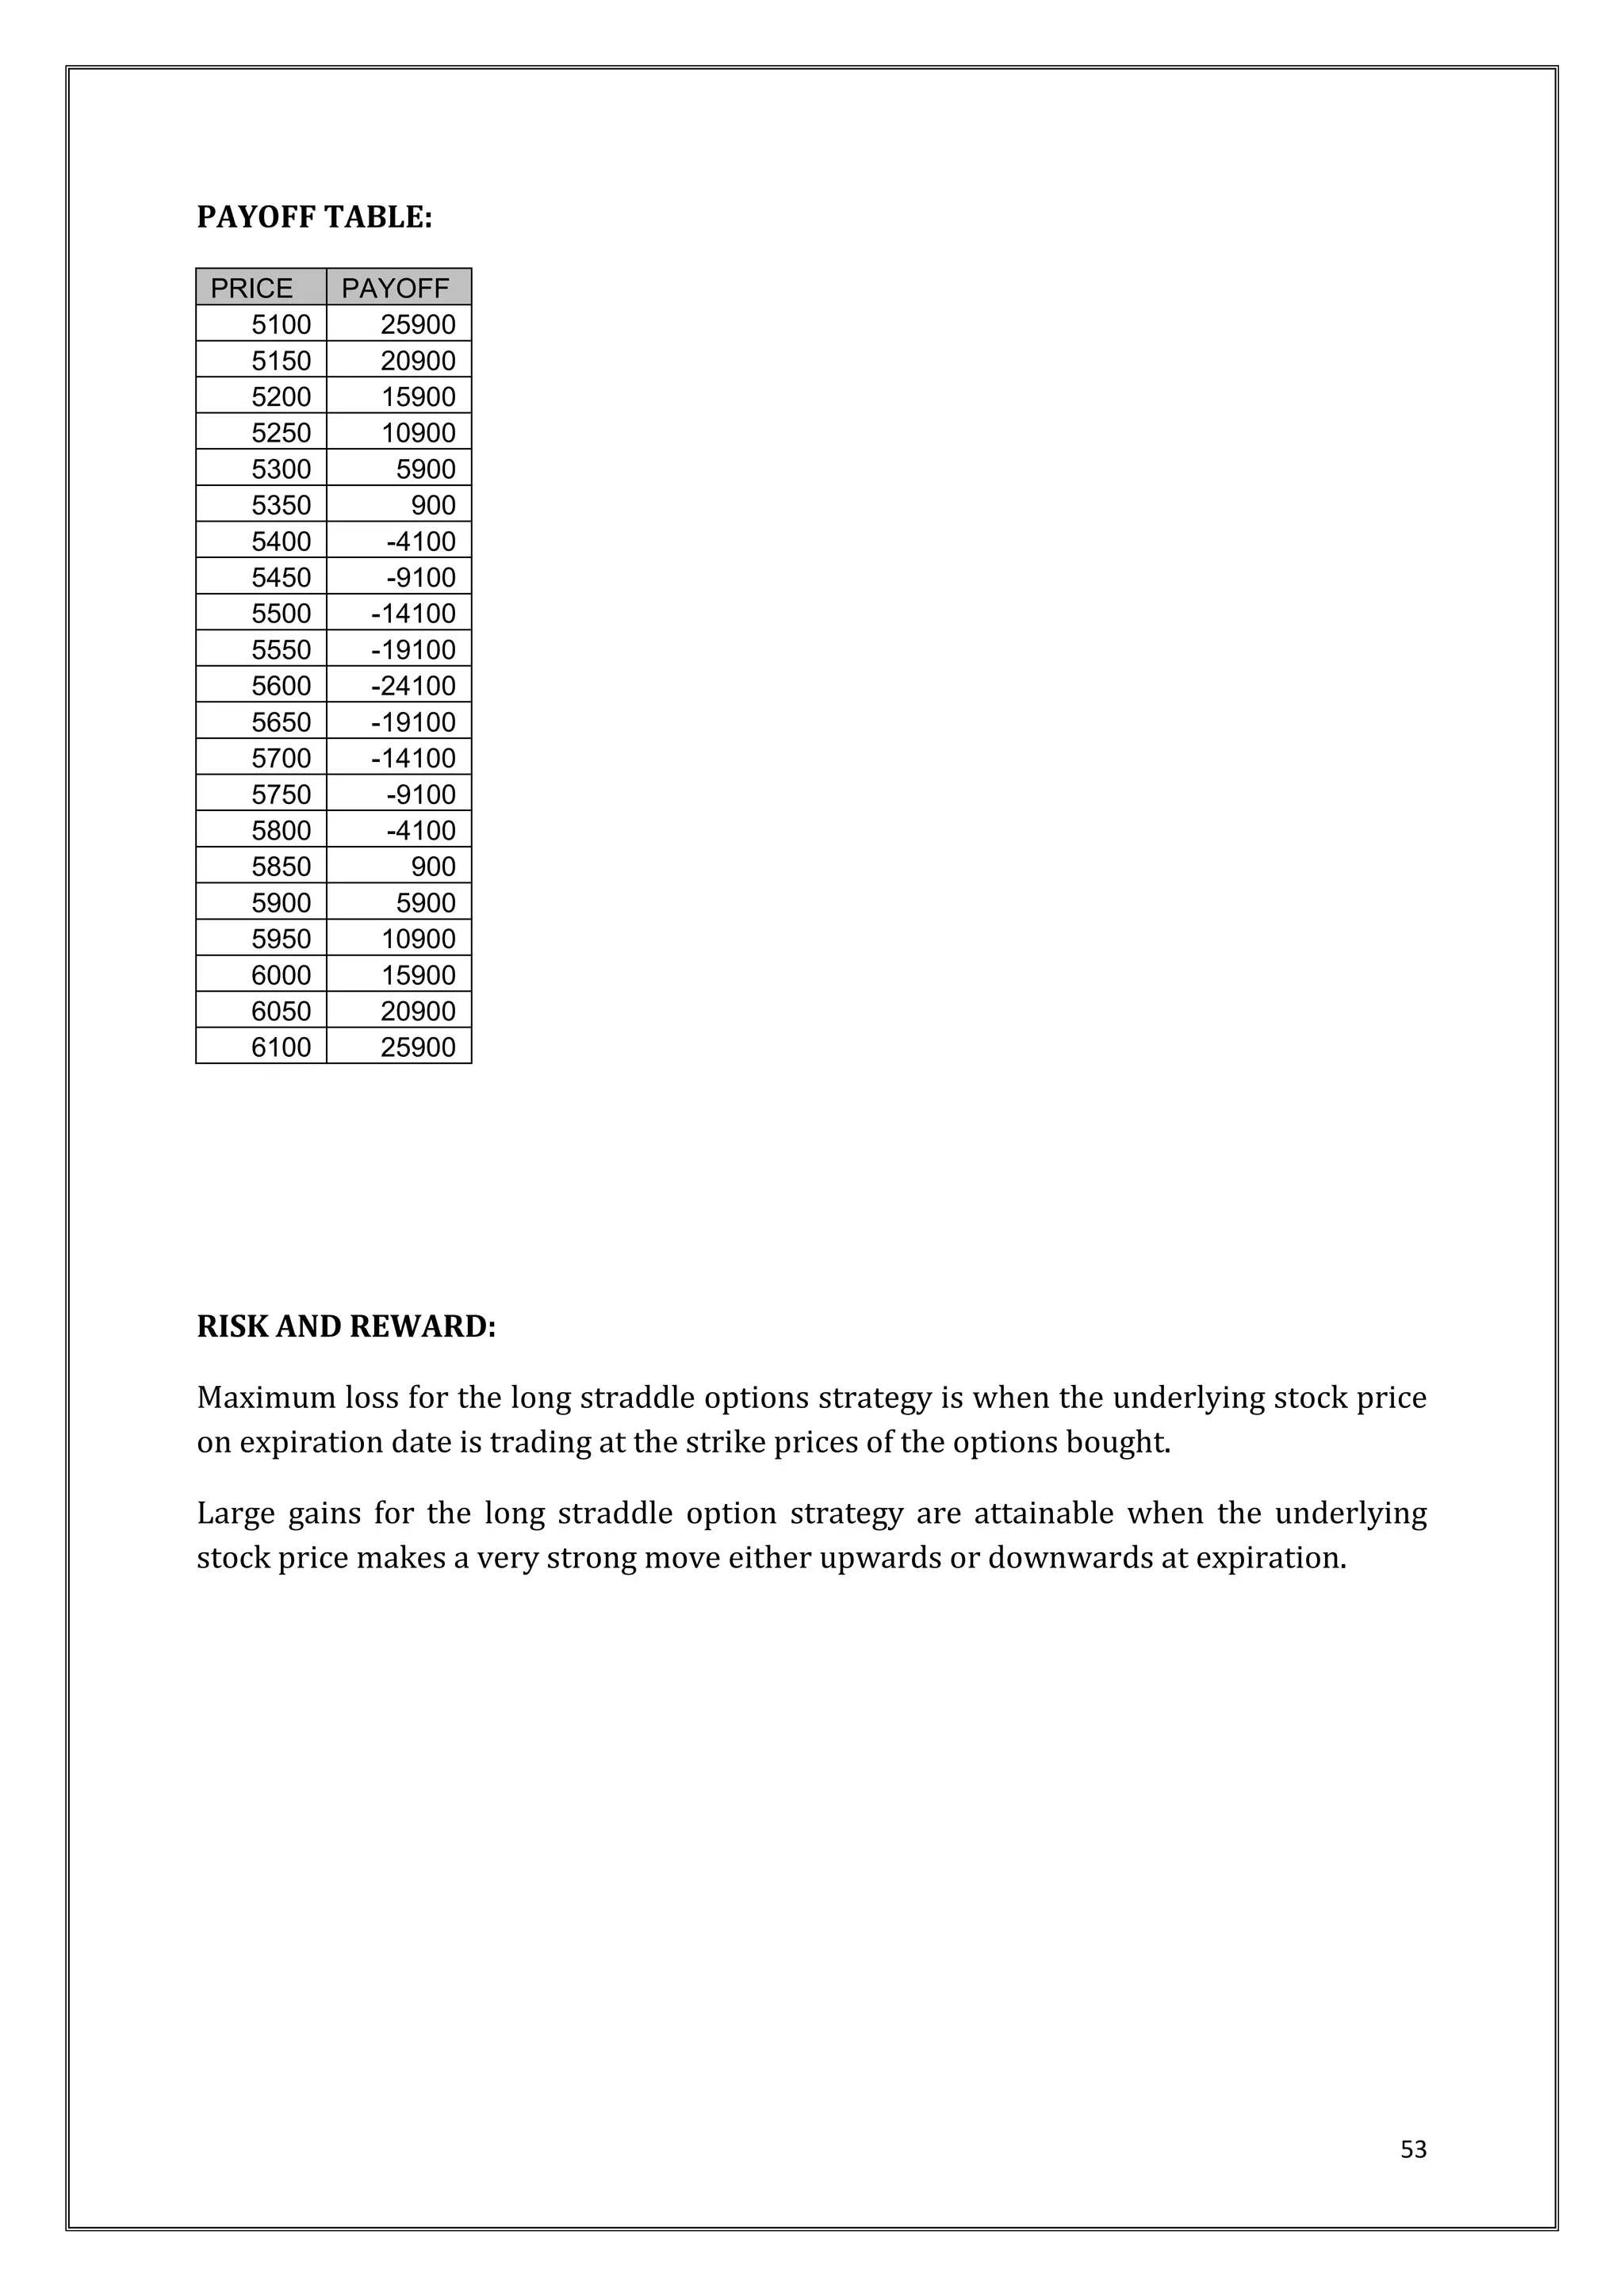
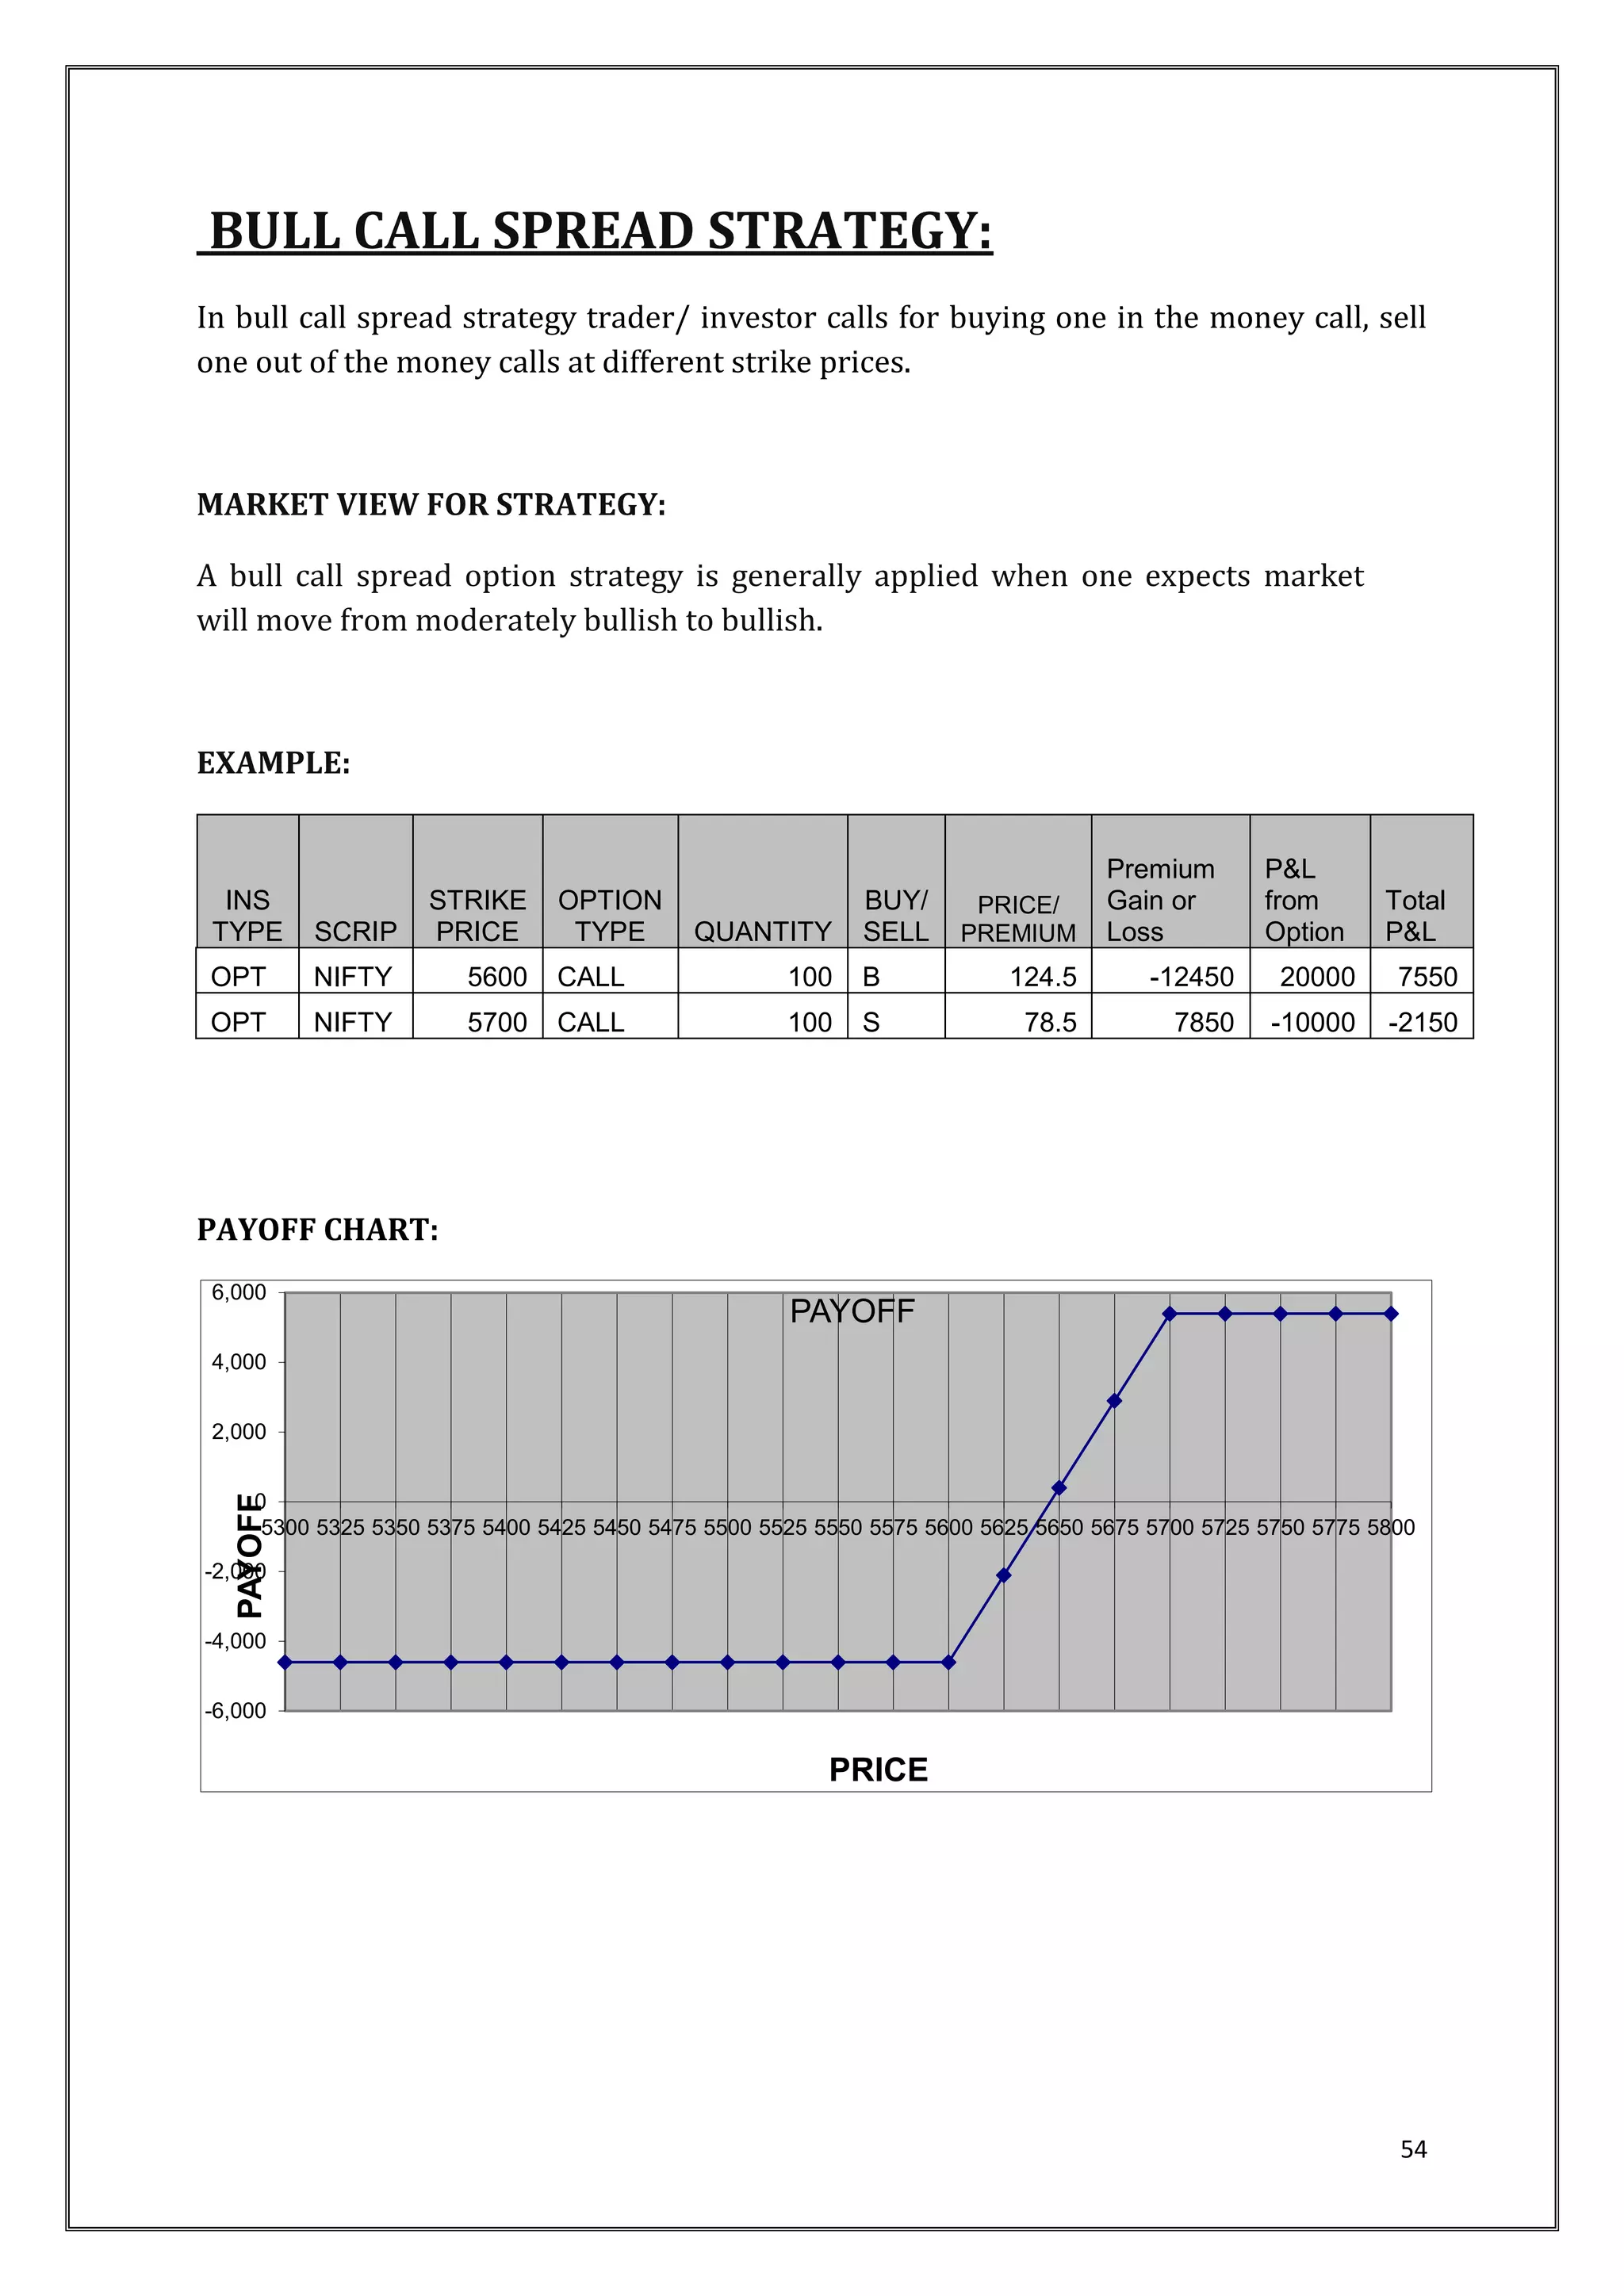
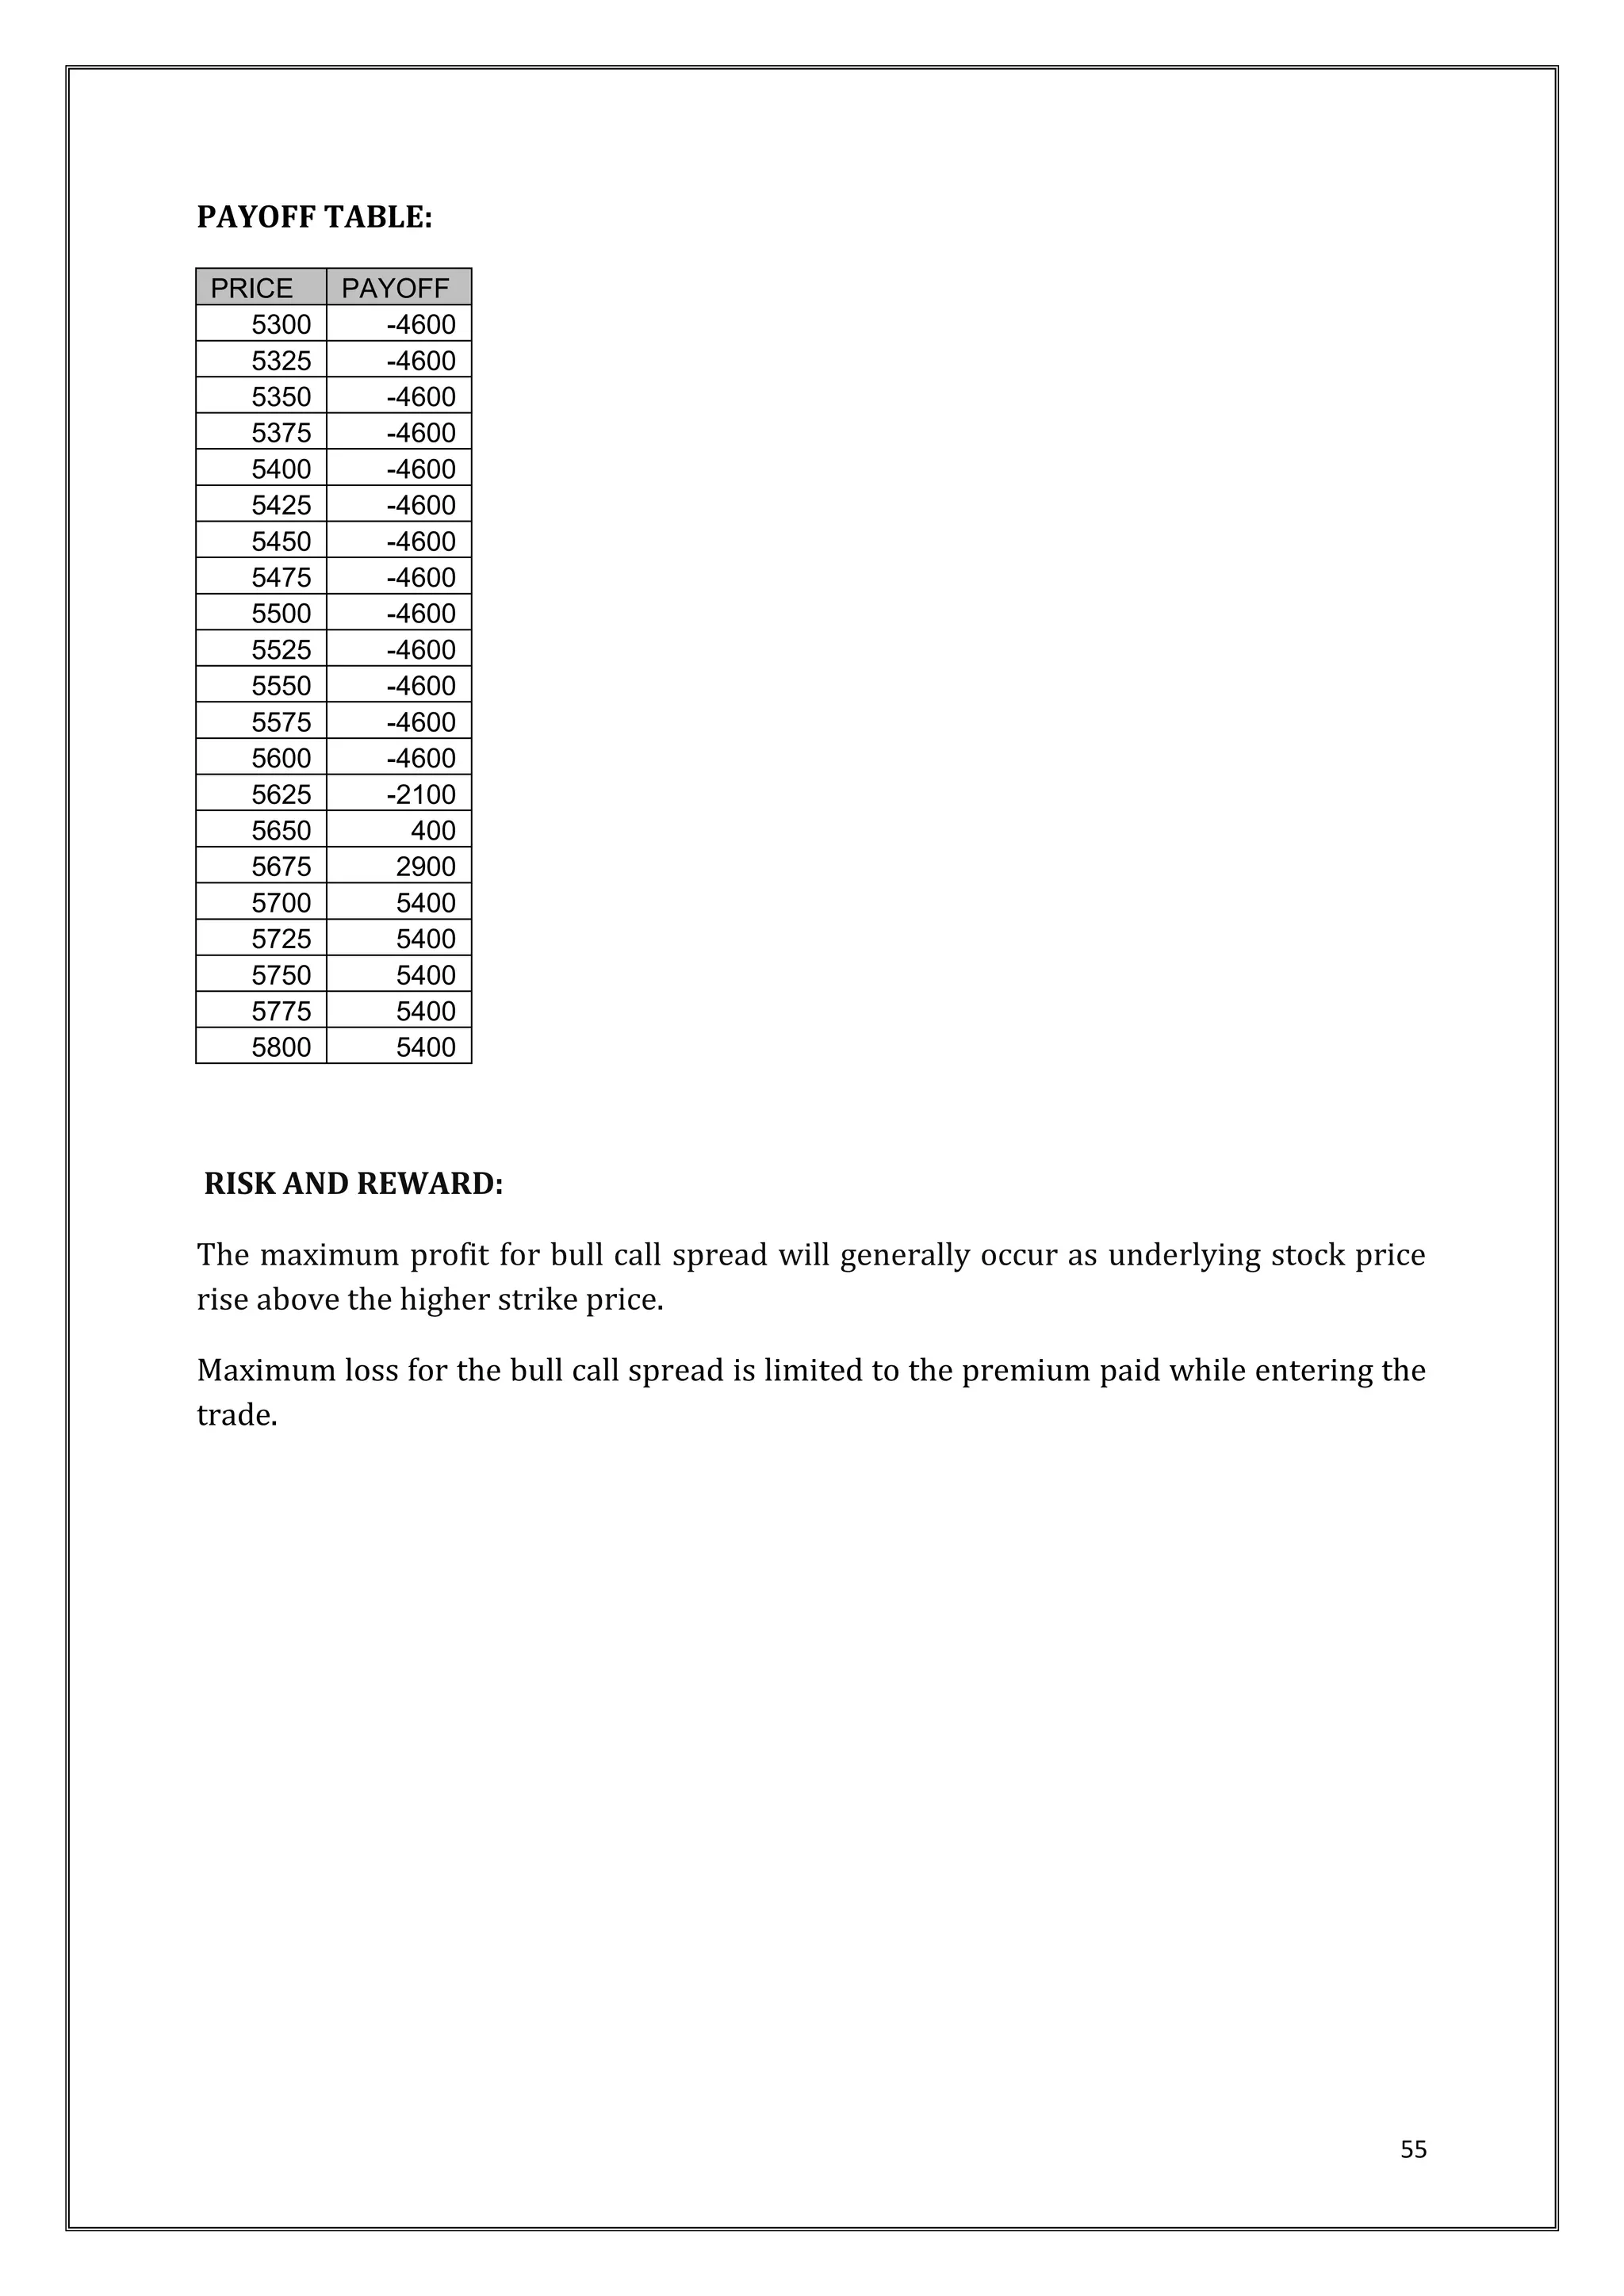
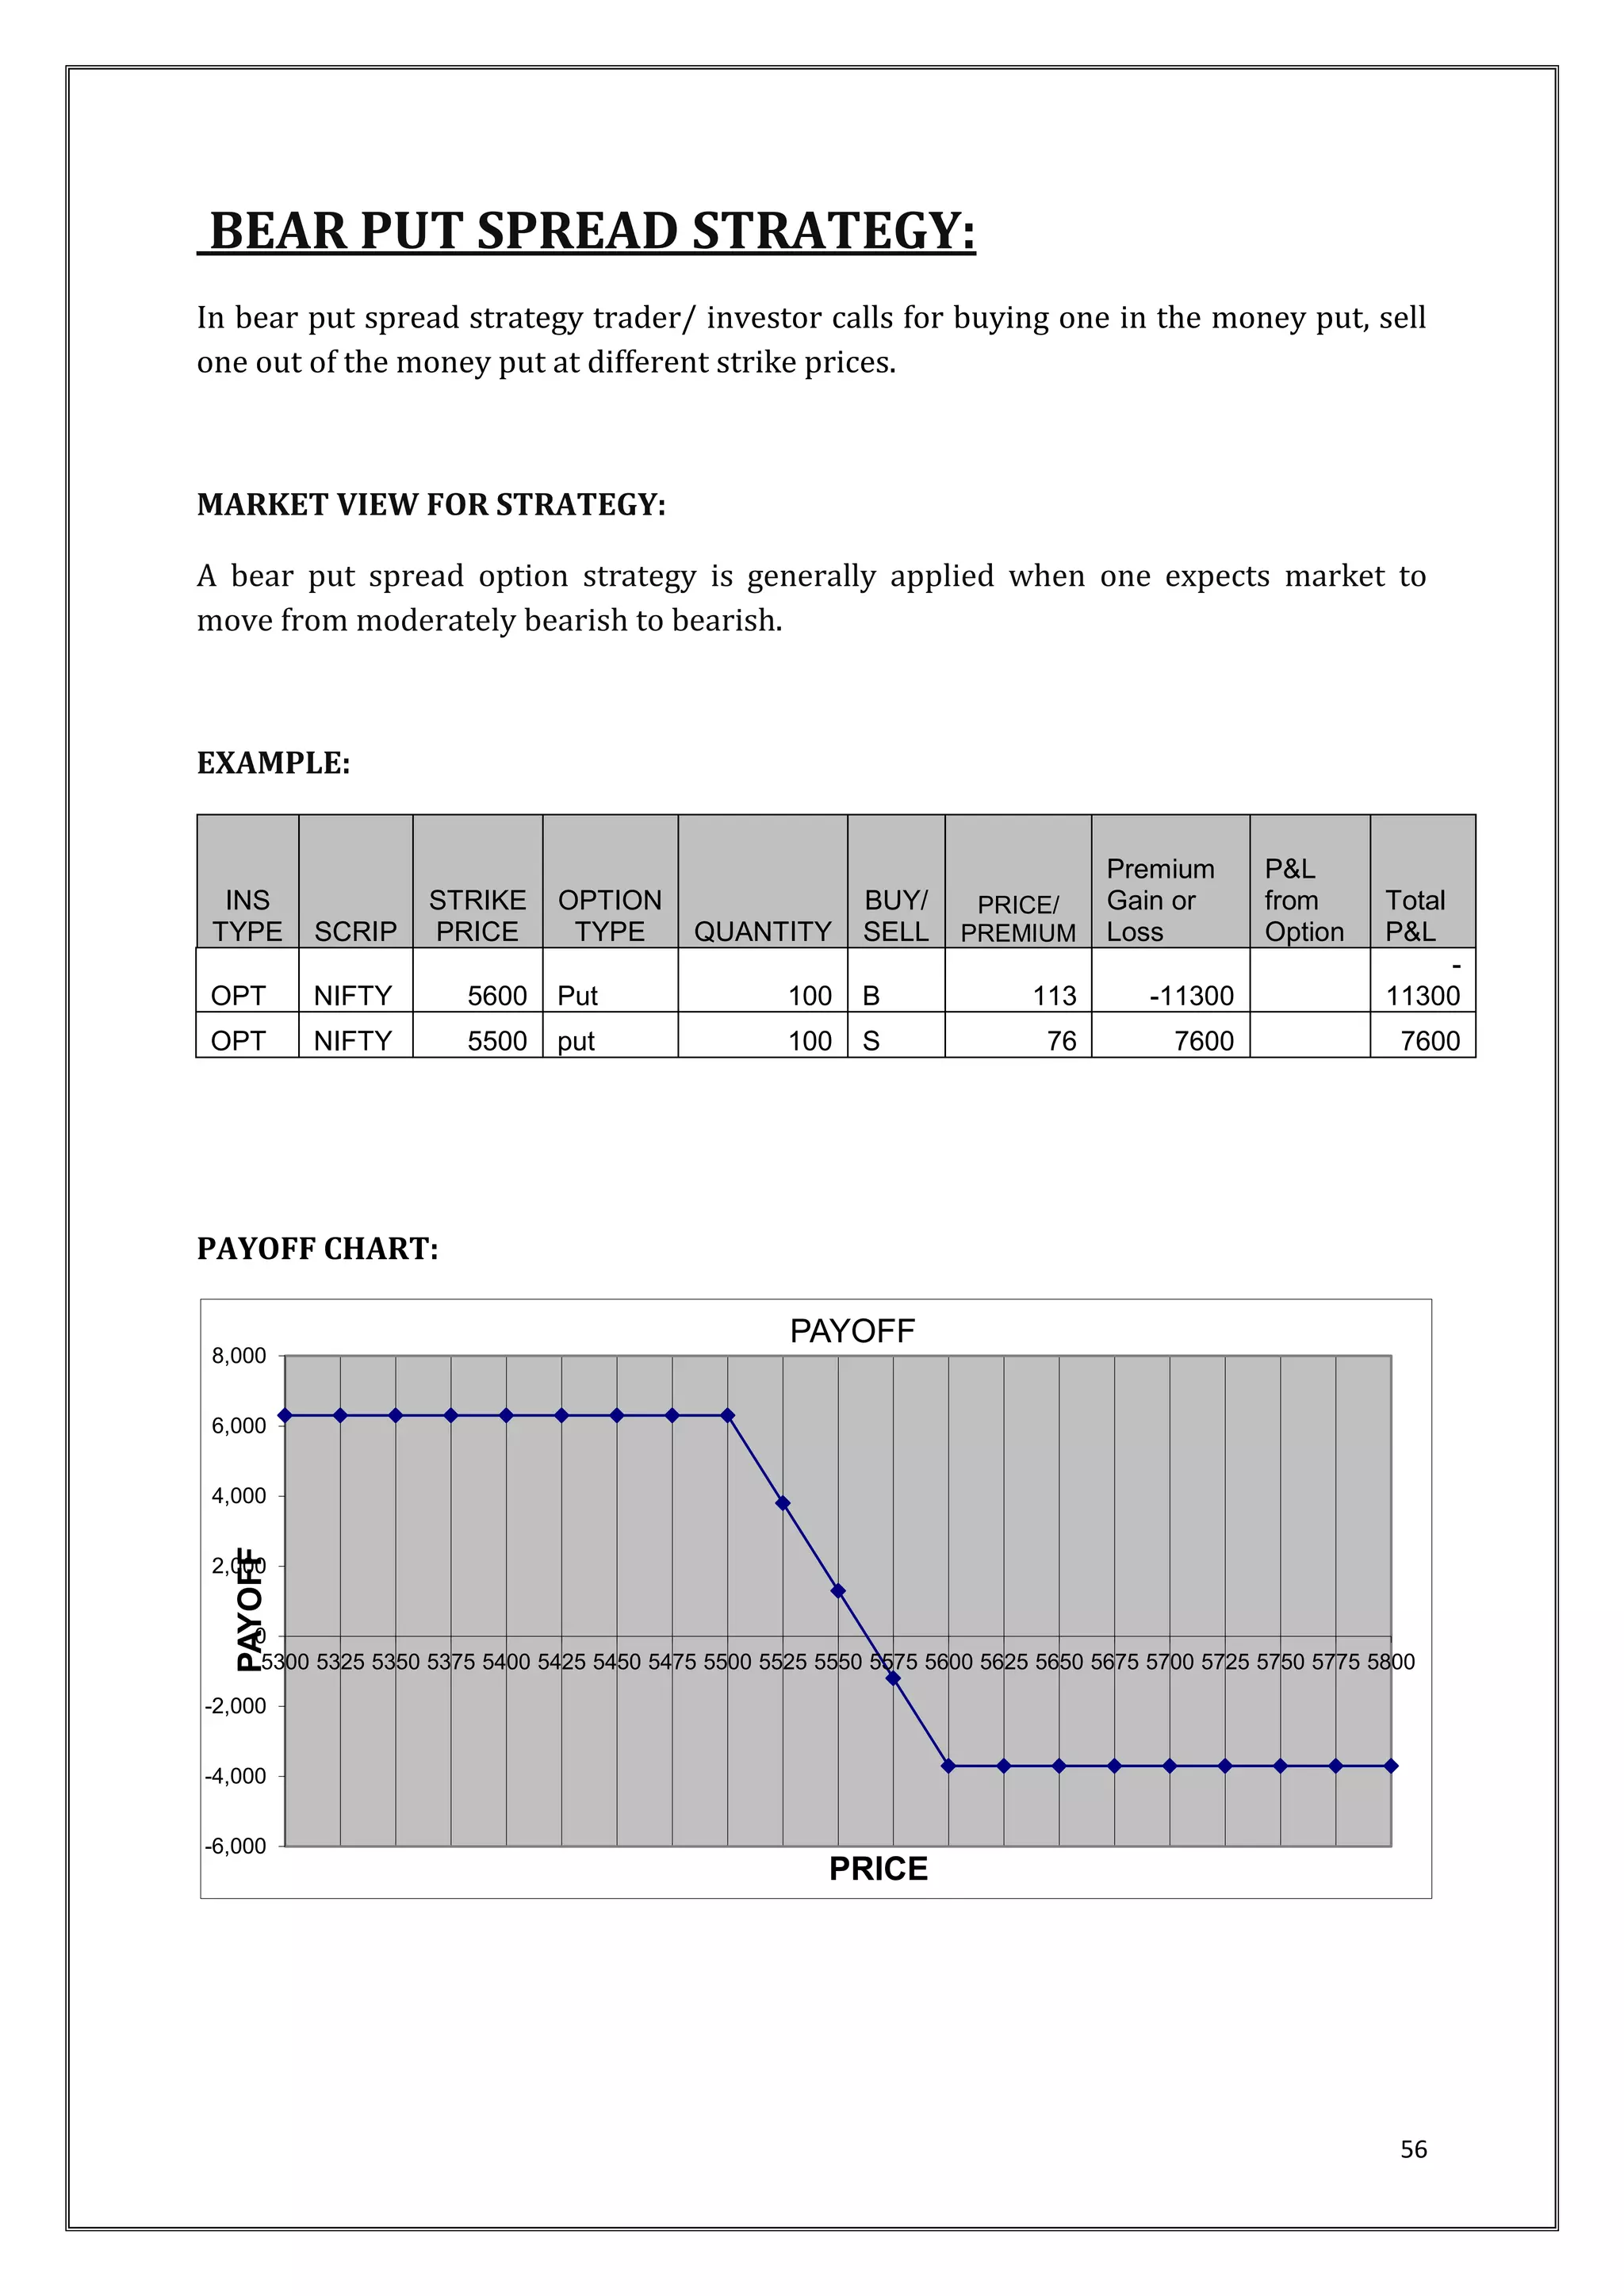
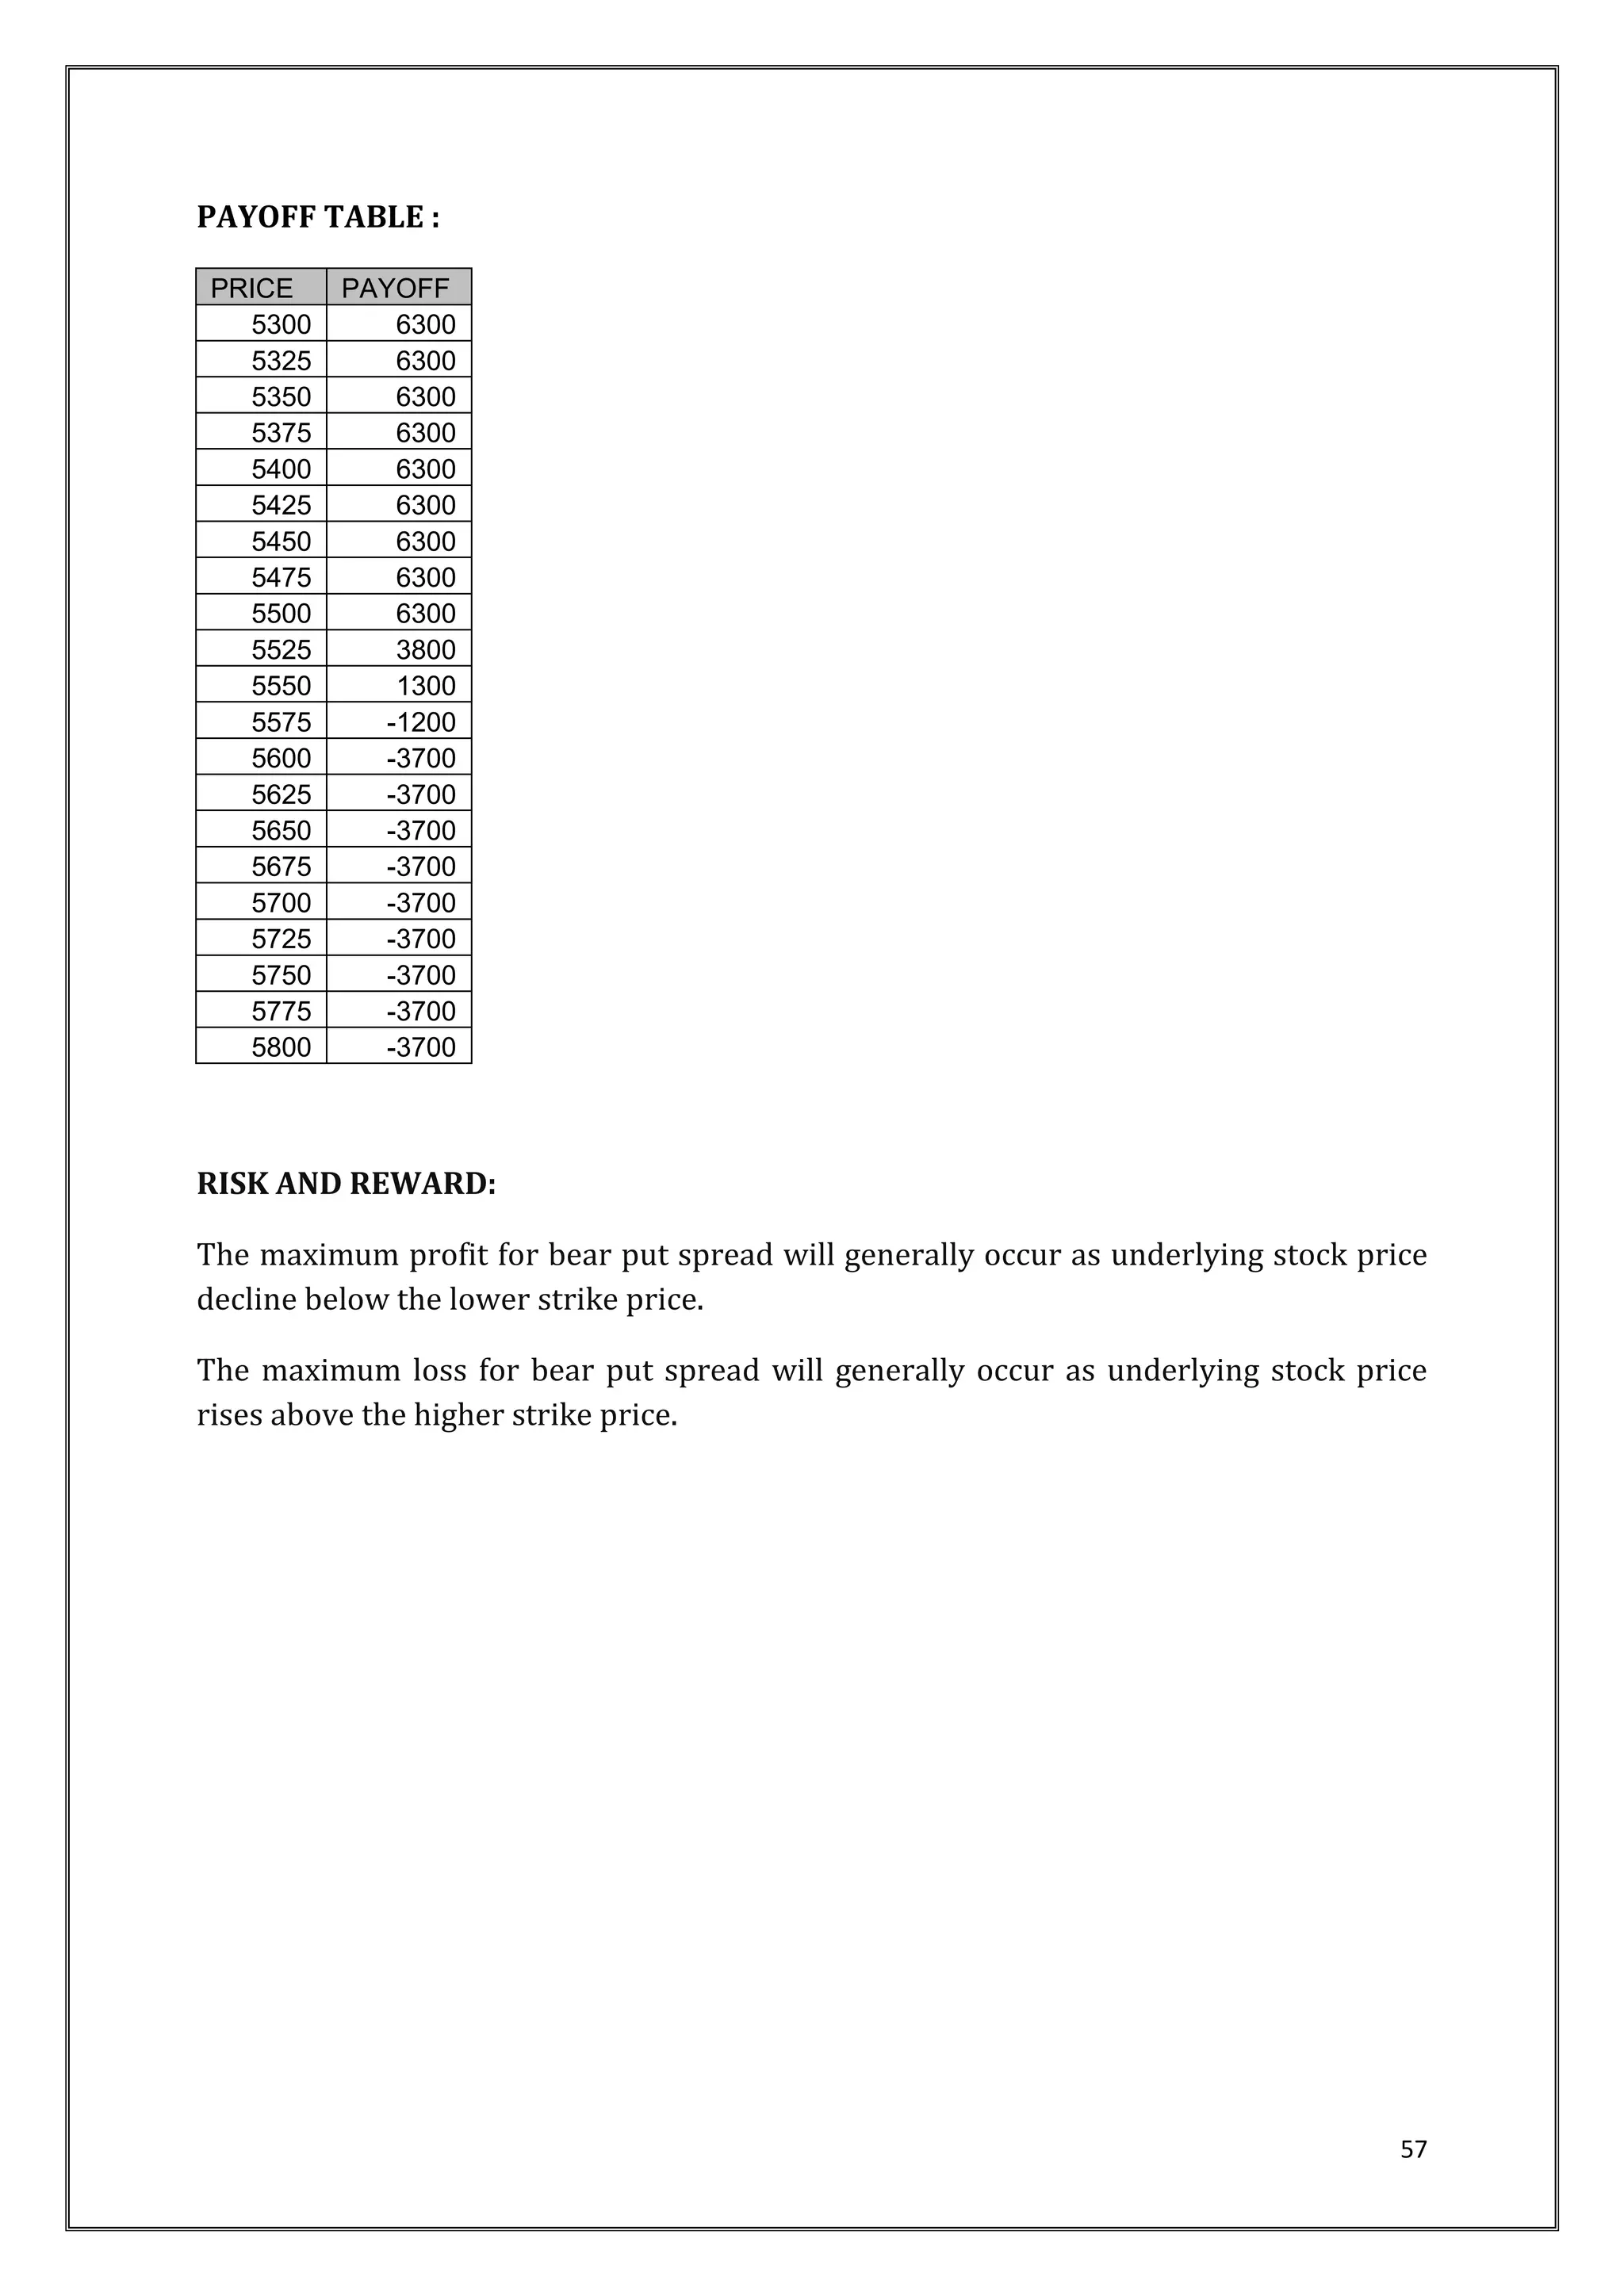
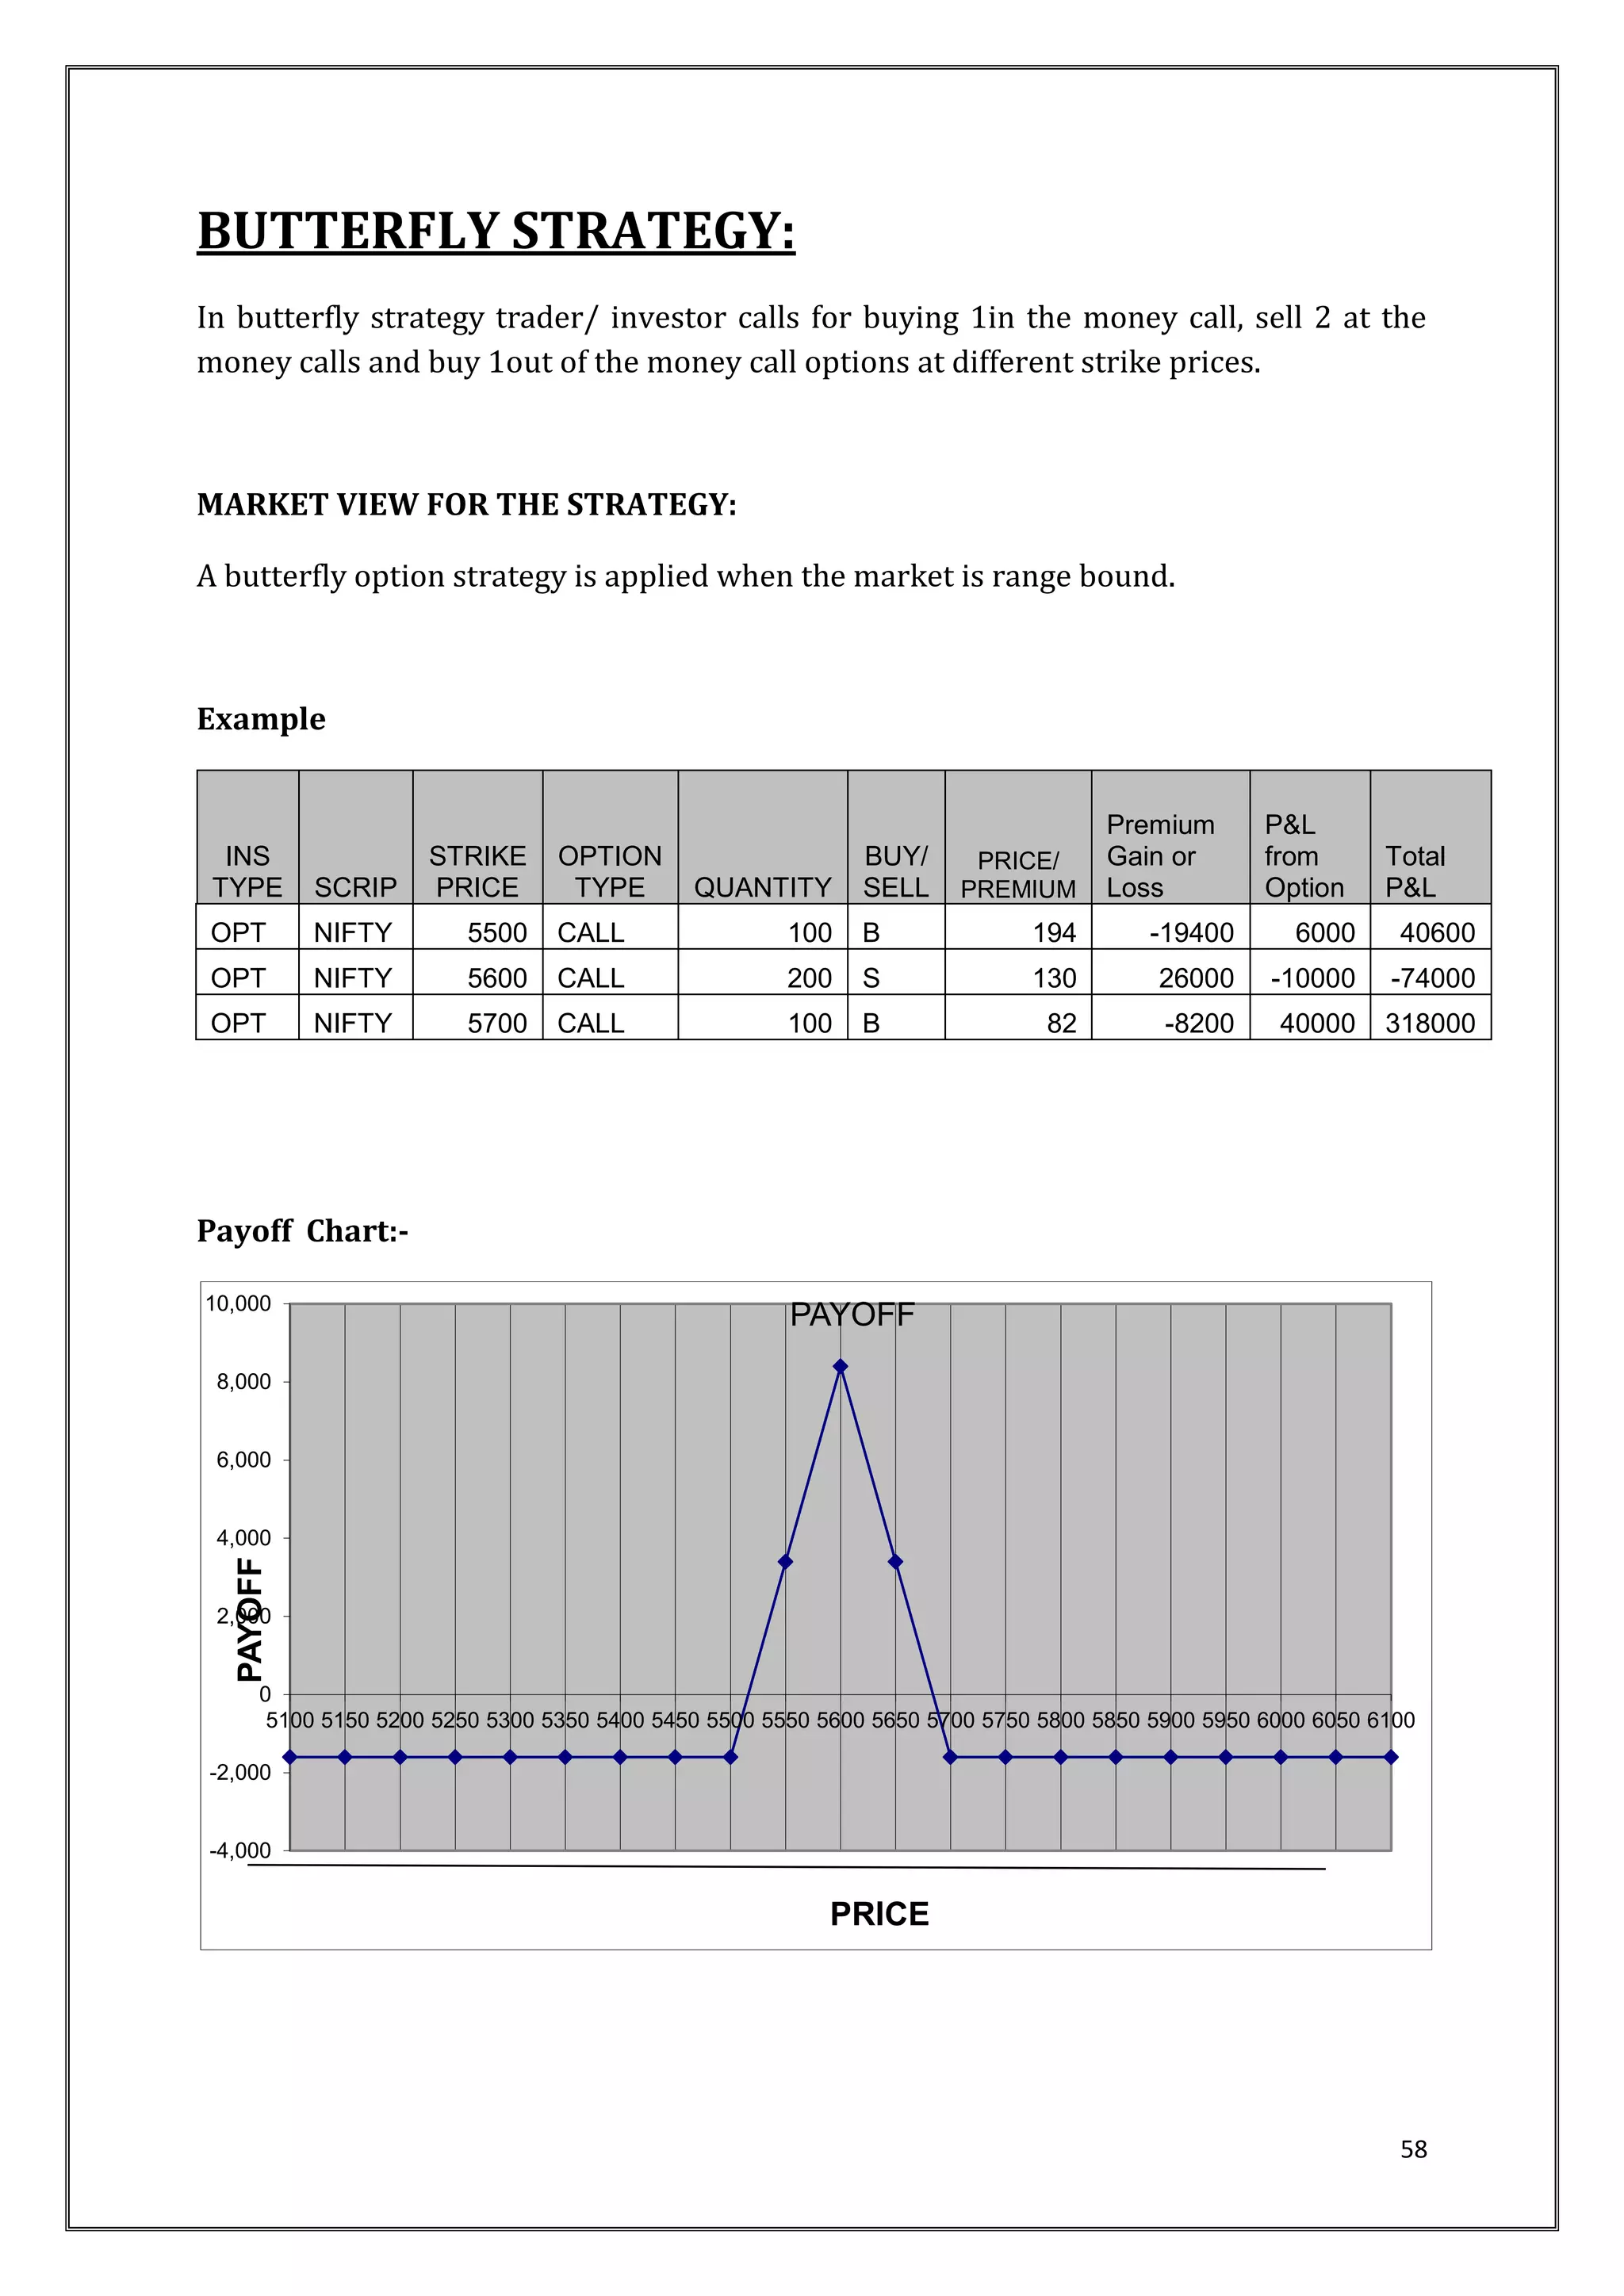
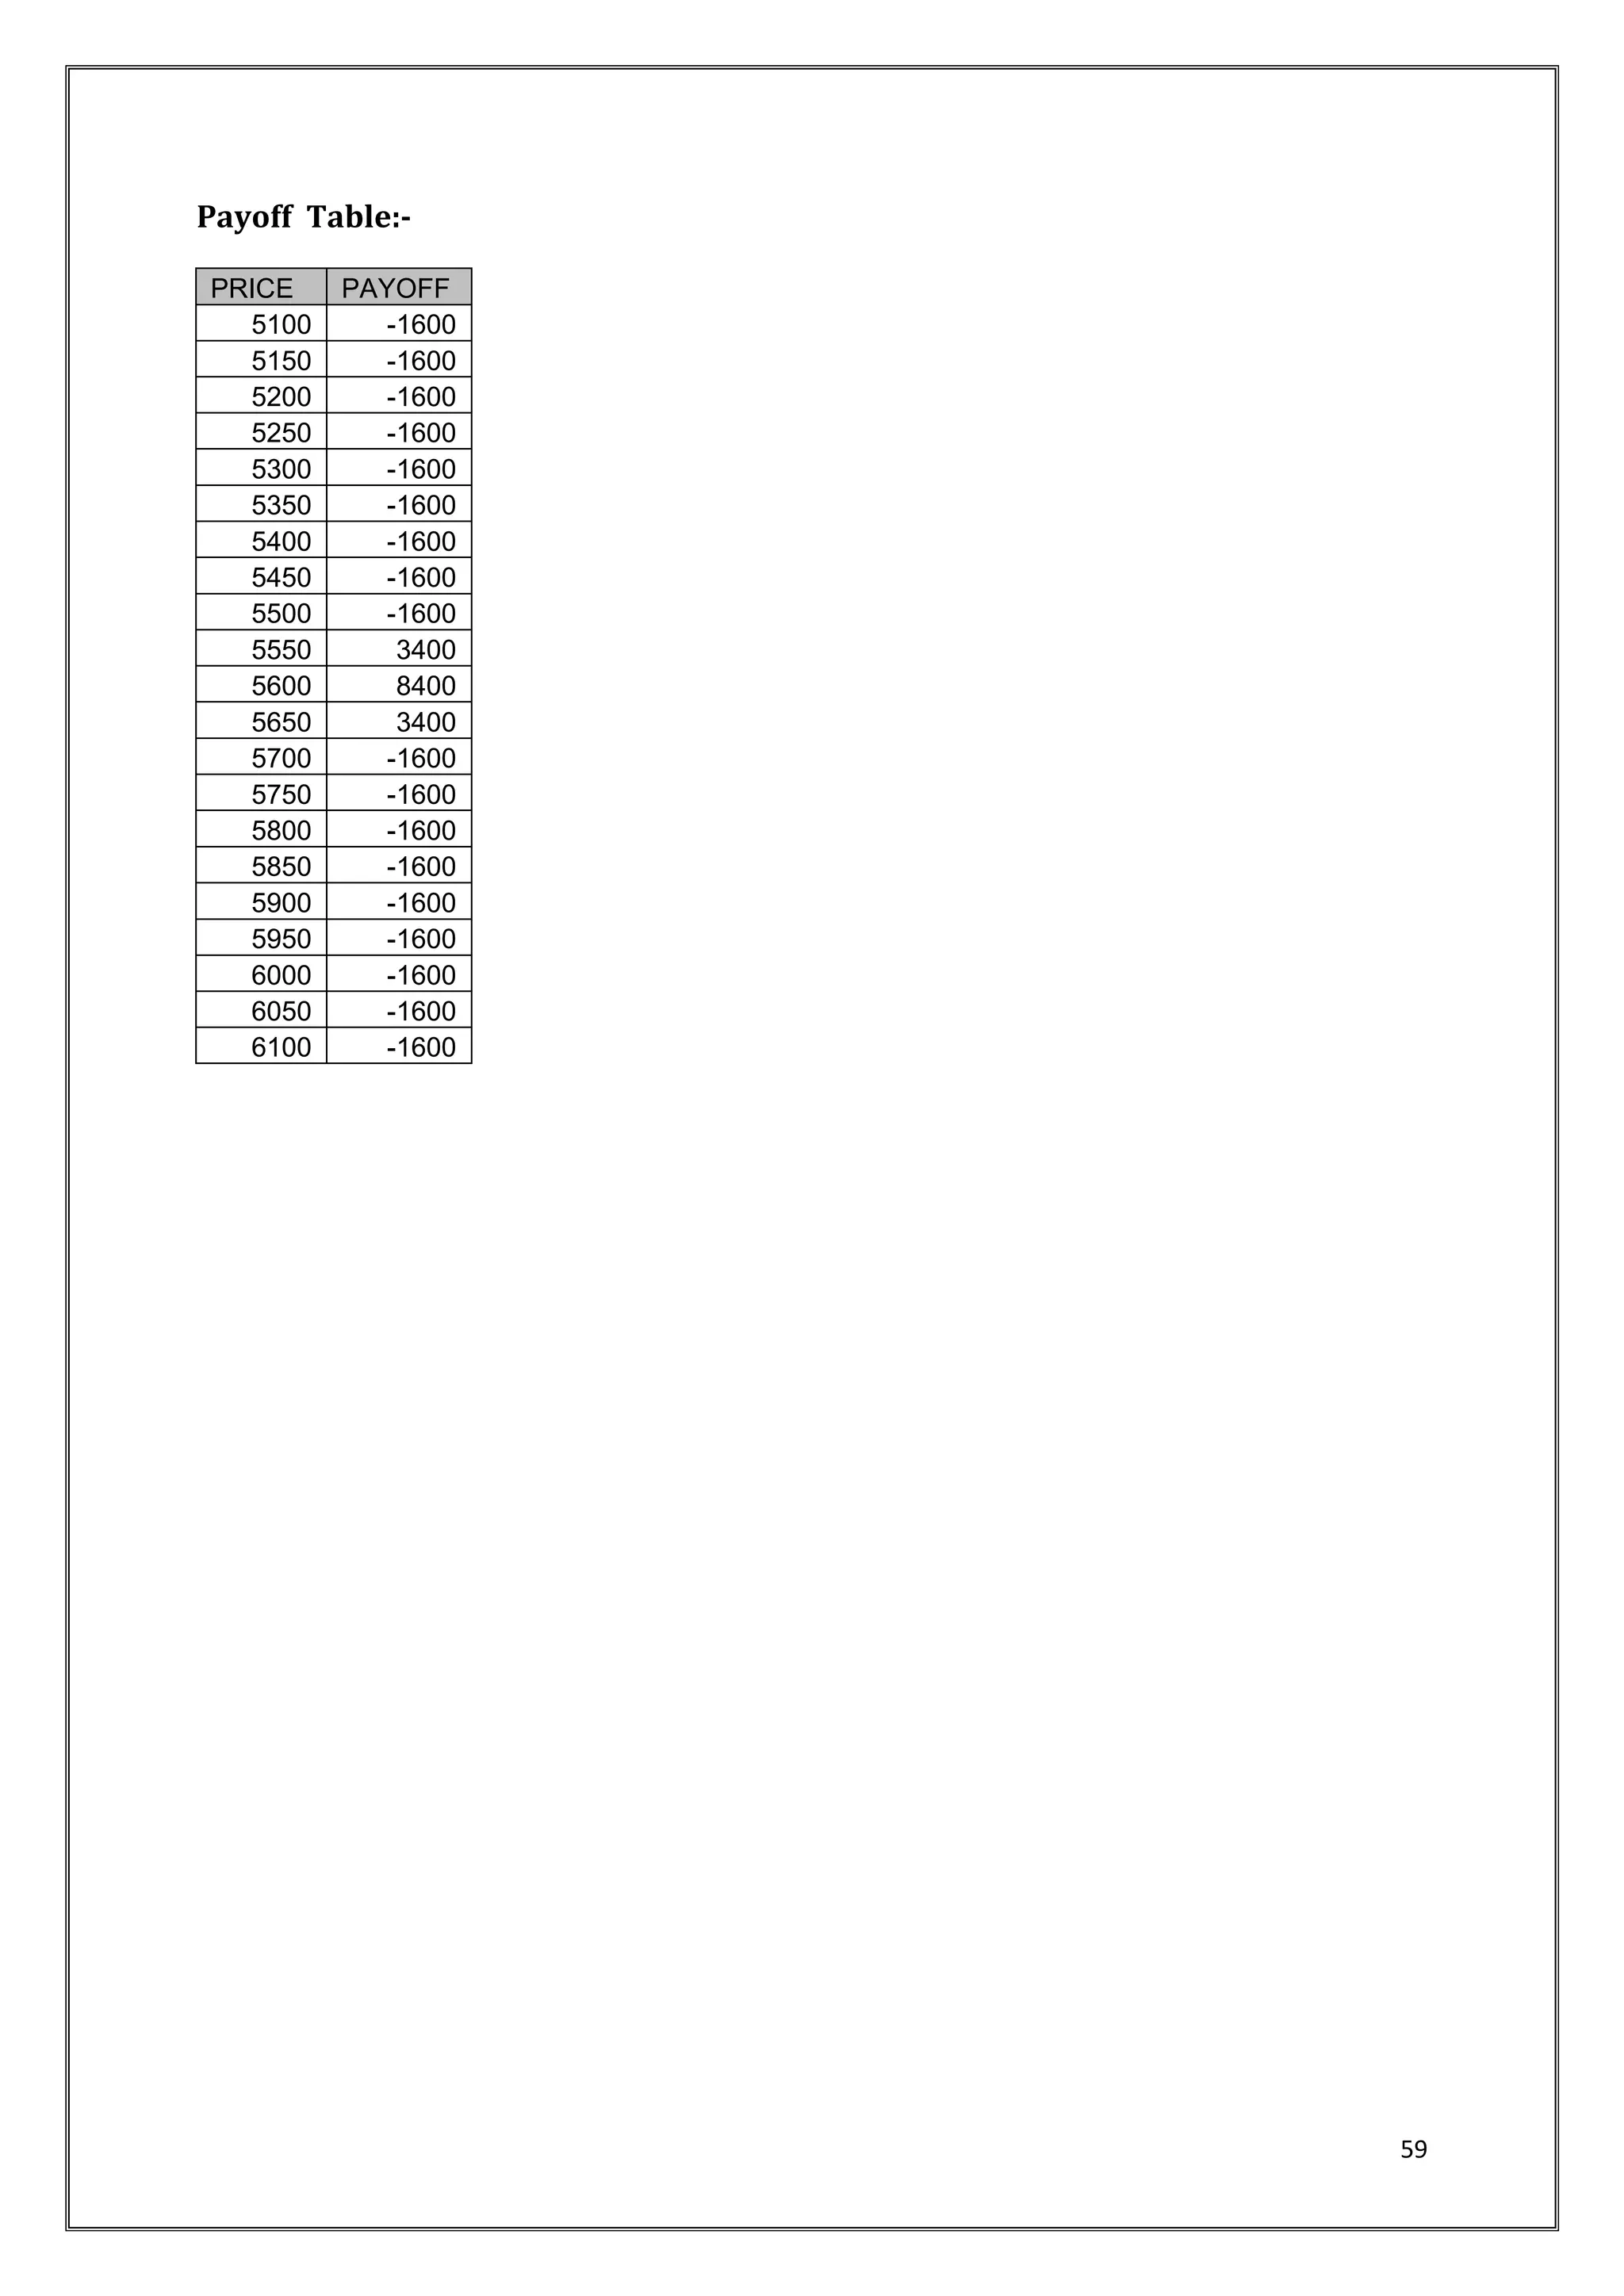
OPTIONS STRATEGY ---------------- ---------------------------- [57]
CHAPTER-IX
CONCLUSION------------------------------------------- [70]
FINDINGS
SUGGETIONS
LIMITATIONS
CONCLUTIONS
CHAPTER-X
BIBLIOGRAPHY-------------- ---------------------------- [74]
WEBOGRAPHY
ANNEXUTERS](https://image.slidesharecdn.com/prashangisip-141116233920-conversion-gate01/75/Prashangi-sip-7-2048.jpg)
![17
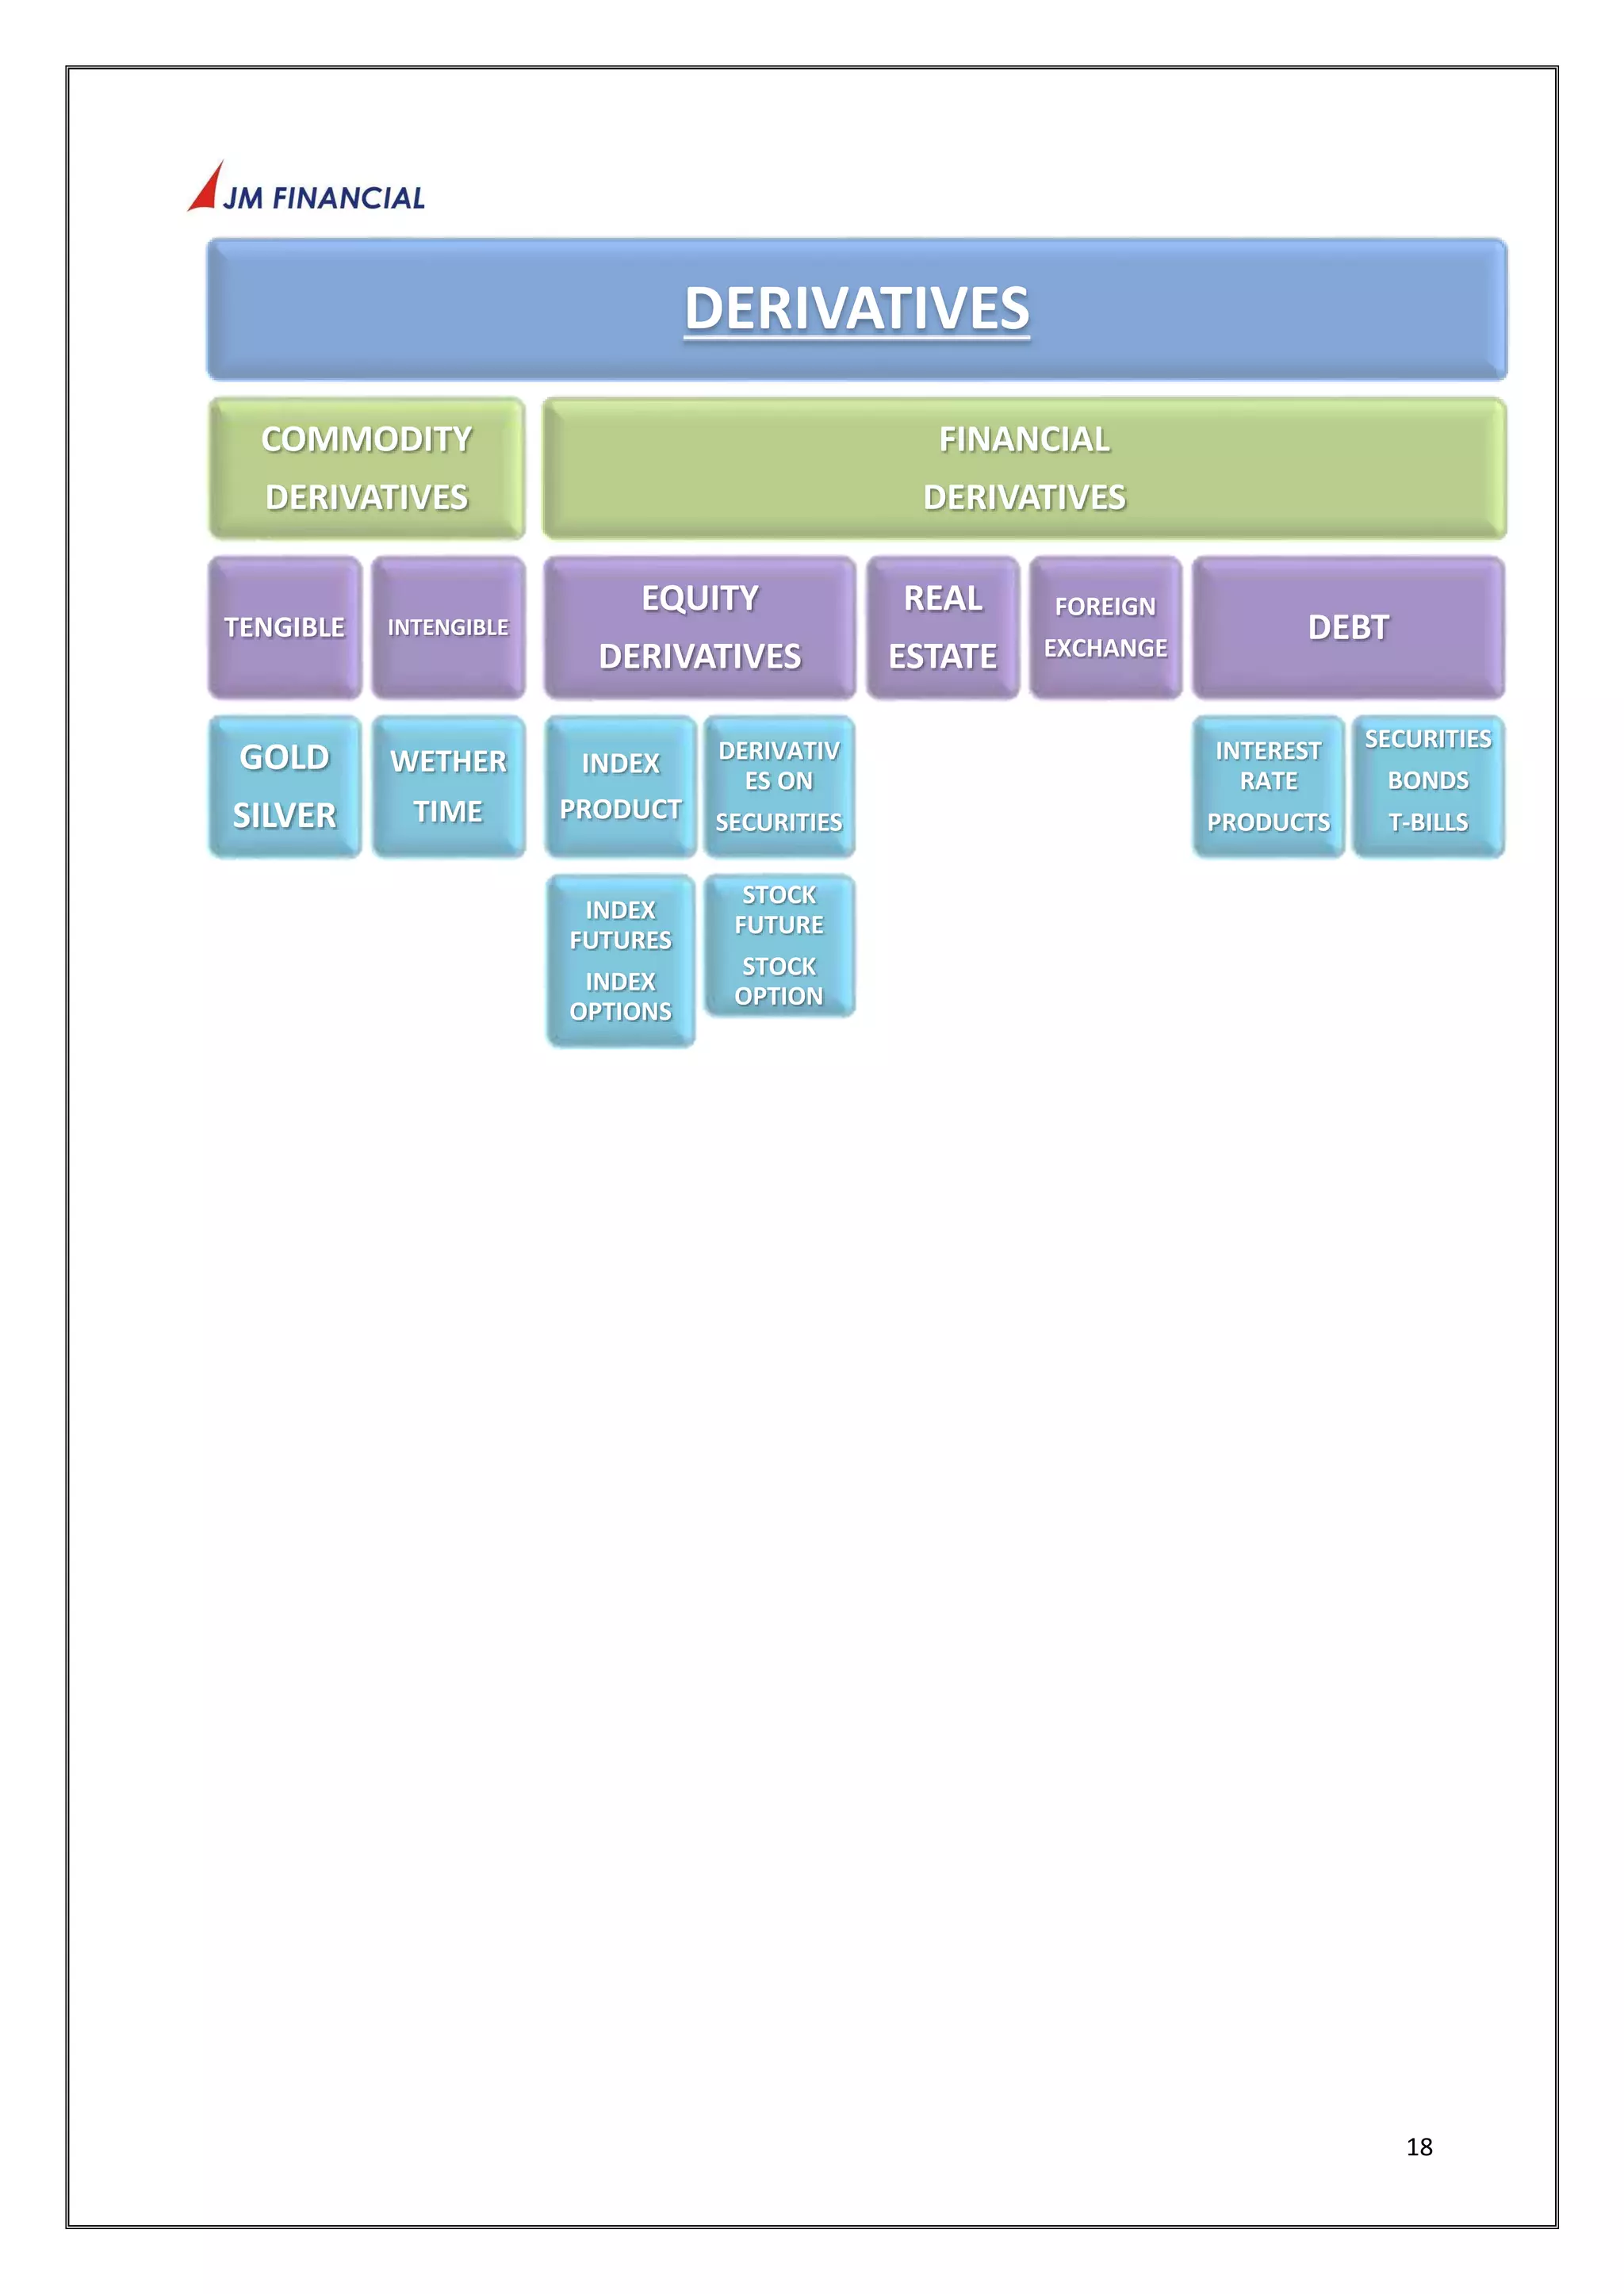
DERIVATIVES
The term derivatives are used to refer to financial instruments which derive
their value from some underlying assets.
The underlying assets could be:
Interest Rate derivative
Foreign Exchange derivative
Credit derivative
Equity derivative
Commodity derivative
Other examples of underlying exchangeables are:
Property (mortgage) derivatives
Economic derivatives that pay off according to economic reports[] as measured and
reported by national statistical agencies
Freight derivatives
Inflation derivatives
Weather derivatives
Insurance derivatives
Emissions derivatives](https://image.slidesharecdn.com/prashangisip-141116233920-conversion-gate01/75/Prashangi-sip-17-2048.jpg)
![23
TYPES OF TRADING:
OTC and Exchange-traded
In broad terms, there are two groups of derivative contracts, which are distinguished by
the way they are traded in the market:
Over-the-counter
(OTC) derivatives are contracts that are traded (and privately negotiated) directly
between two parties, without going through an exchange or other intermediary.
Products such as swaps, forward rate agreements, and exotic options are almost
always traded in this way. The OTC derivative market is the largest market for
derivatives, and is largely unregulated with respect to disclosure of information
between the parties, since the OTC market is made up of banks and other highly
sophisticated parties, such as hedge funds. Reporting of OTC amounts are difficult
because trades can occur in private, without activity being visible on any exchange.
According to the Bank for International Settlements, the total outstanding notional
amount is US$684 trillion (as of June 2008).[6] Of this total notional amount, 67% are
interest rate contracts, 8% are credit default swaps (CDS), 9% are foreign exchange
contracts, 2% are commodity contracts, 1% are equity contracts, and 12% are other.
Because OTC derivatives are not traded on an exchange, there is no central counter-party.
Therefore, they are subject to counter-party risk, like an ordinary contract, since
each counter-party relies on the other to perform.
Exchange-traded derivative contracts
(ETD) are those derivatives instruments that are traded via specialized derivatives
exchanges or other exchanges. A derivatives exchange is a market where individuals
trade standardized contracts that have been defined by the exchange.A derivatives
exchange acts as an intermediary to all related transactions, and takes Initial margin
from both sides of the trade to act as a guarantee.](https://image.slidesharecdn.com/prashangisip-141116233920-conversion-gate01/75/Prashangi-sip-23-2048.jpg)