Download to read offline
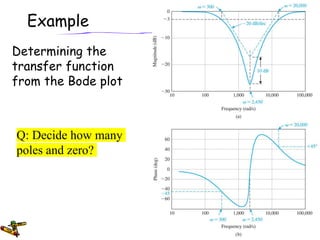
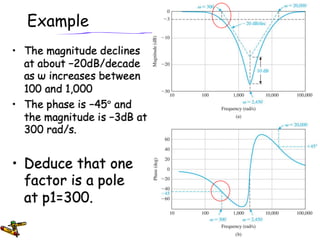
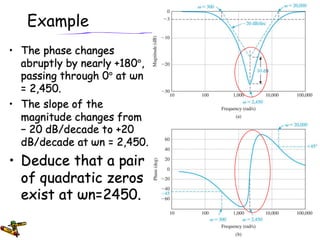
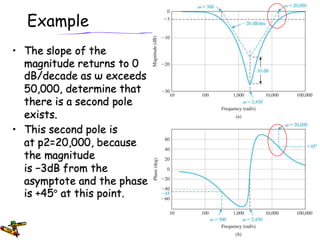
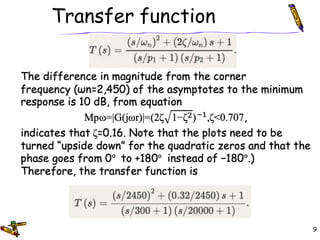
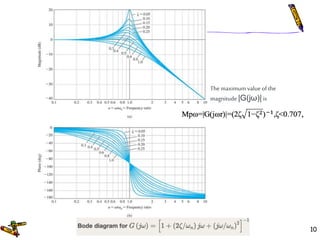
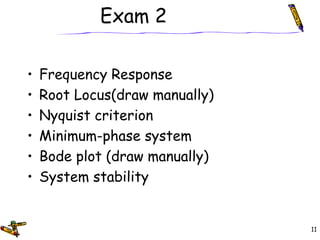
This document appears to be a class review for control systems analysis. It covers topics like frequency response measurements, determining transfer functions from Bode plots, examples, and an exam review covering frequency response, root locus, Nyquist criterion, minimum-phase systems, manually drawing Bode plots, and system stability. The document provides an overview of key concepts and methods in time domain analysis of control systems.


