Download as PDF, PPTX

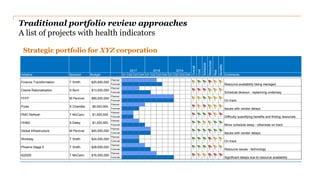
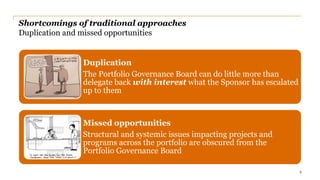
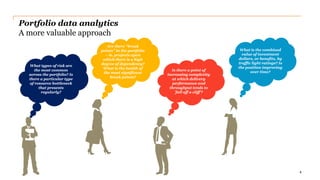
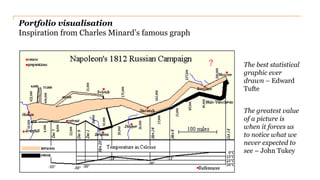


The document discusses the challenges of traditional portfolio review methods and emphasizes the need for improved portfolio analytics and visualization for better governance. It highlights the shortcomings of existing approaches, including project duplication and missed opportunities, while proposing recommendations for enhancing resource management and decision-making through data-driven insights. Overall, it advocates for a new paradigm in portfolio management that leverages analytics to identify risks, dependencies, and performance issues.


