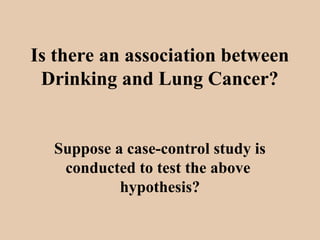
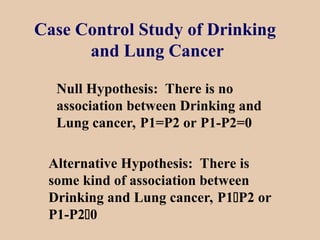
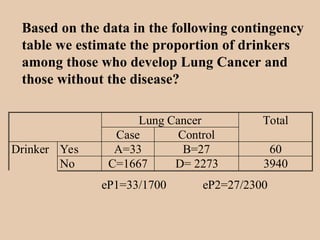
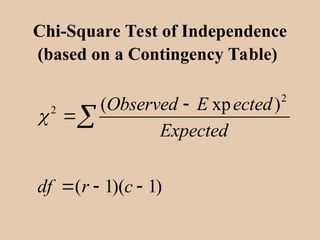
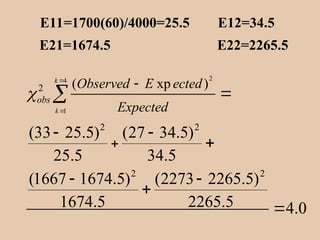
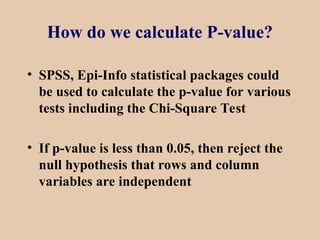
Comparing Population Parameters
(Z-test, t-tests and Chi-Square test)
Is there an association between
Drinking and Lung Cancer?
Suppose a case-control study is
conducted to test the above
hypothesis?
QUESTION: Is there a difference
between the proportion of drinkers among
cases and controls?
G roup 1
Disease
P 1= proportion of drinkers
G roup 2
No Disease
P 2= proportion of drinkrs
Elements of Testing hypothesis
• Null Hypothesis
• Alternative hypothesis
• Level of significance
• Test statistics
• P-value
• Conclusion
Case Control Study of Drinking
and Lung Cancer
Null Hypothesis: There is no
association between Drinking and
Lung cancer, P1=P2 or P1-P2=0
Alternative Hypothesis: There is
some kind of association between
Drinking and Lung cancer, P1P2 or
P1-P20
Based on the data in the following contingency
table we estimate the proportion of drinkers
among those who develop Lung Cancer and
those without the disease?
Lung Cancer Total
Case Control
Drinker Yes A=33 B=27 60
No C=1667 D= 2273 3940
eP1=33/1700 eP2=27/2300
Test Statistic
How many standard deviations has our
estimate deviated from the hypothesized
value if the null hypothesis was true?
( 1 2 0)/[(1/ 1 1/ 2)( (1 ))]
(33 27)/(1700 2300) 60/ 4000 3/ 200 0.015
[(33/1700) (27/ 2300) 0)]/( (1/1700 1/ 2300)(0.015)(0.985)
2.003
Z eP eP n n p p
where
p
Z
Z
    
     
   

P-value for a two tailed test
P-value= 2 P[Z > 2.003] = 2(.024)=0.048
How does this p-value compared with =0.05?
Since p-value=0.048 < =0.05, reject the null
hypothesis H0 in favor of the alternative
hypothesis Ha.
Conclusion:
There is an association between drinking and
lung cancer.
Is this relationship causal?
Chi-Square Test of Independence
(based on a Contingency Table)
2
2 ( xp )
( 1)( 1)
Observed E ected
Expected
df r c



  

In the following contingency table estimate the
proportion of drinkers among those who develop
Lung Cancer and those without the disease?
Lung Cancer Total
Case Control
Drinker Yes O11=33 O12=27 R1=60
No O21=1667 O22= 2273 R2=3940
Total C1 = 1700 C2 = 2300 n = 4000
E11=1700(60)/4000=25.5 E12=34.5
E21=1674.5 E22=2265.5
E11=1700(60)/4000=25.5 E12=34.5
E21=1674.5 E22=2265.5
2
4
1
2
2 2
2 2
( xp )
(33 25.5) (27 34.5)
25.5 34.5
(1667 1674.5) (2273 2265.5)
1674.5 2265.5 4.0
k
k
obs
Observed E ected
Expected






 

 



How do we calculate P-value?
• SPSS, Epi-Info statistical packages could
be used to calculate the p-value for various
tests including the Chi-Square Test
• If p-value is less than 0.05, then reject the
null hypothesis that rows and column
variables are independent
Testing Hypothesis When Two
Population Means are Compared
H0: 1= 2
Ha: 1 2
QUESTION: Is there an association
between age and Lung Cancer?
G roup 1
Disease
M ean age of the cases
G roup 2
No Disease
M ean age of the controls
Use Two-sample t-test when both
samples are independent
• H0: 1 = 2 vs Ha: 1  2
• H0: 1 - 2 = 0 vs Ha: 1 - 2  0
• t= difference in sample means – hypothesized diff.
SE of the Difference in Means
• Statistical packages provide p-values and
degrees of freedom
• Conclusion: If p-value is less than 0.05, then
reject the equality of the means
Paired t-test for
Matched case control study
• H0: 1 = 2 vs Ha: 1  2
• H0: 1 - 2 = 0 vs Ha: 1 - 2  0
• Paired t-test= Mean of the differences –0
SE of the Differences in Means
• Statistical packages provide p-values for
paired t-test
• Conclusion: If p-value is less than 0.05,
then reject the equality of the means

popualtion comparing tests of statistics

  • 1.
    Comparing Population Parameters (Z-test,t-tests and Chi-Square test)
  • 2.
    Is there anassociation between Drinking and Lung Cancer? Suppose a case-control study is conducted to test the above hypothesis?
  • 3.
    QUESTION: Is therea difference between the proportion of drinkers among cases and controls? G roup 1 Disease P 1= proportion of drinkers G roup 2 No Disease P 2= proportion of drinkrs
  • 4.
    Elements of Testinghypothesis • Null Hypothesis • Alternative hypothesis • Level of significance • Test statistics • P-value • Conclusion
  • 5.
    Case Control Studyof Drinking and Lung Cancer Null Hypothesis: There is no association between Drinking and Lung cancer, P1=P2 or P1-P2=0 Alternative Hypothesis: There is some kind of association between Drinking and Lung cancer, P1P2 or P1-P20
  • 6.
    Based on thedata in the following contingency table we estimate the proportion of drinkers among those who develop Lung Cancer and those without the disease? Lung Cancer Total Case Control Drinker Yes A=33 B=27 60 No C=1667 D= 2273 3940 eP1=33/1700 eP2=27/2300
  • 7.
    Test Statistic How manystandard deviations has our estimate deviated from the hypothesized value if the null hypothesis was true? ( 1 2 0)/[(1/ 1 1/ 2)( (1 ))] (33 27)/(1700 2300) 60/ 4000 3/ 200 0.015 [(33/1700) (27/ 2300) 0)]/( (1/1700 1/ 2300)(0.015)(0.985) 2.003 Z eP eP n n p p where p Z Z                
  • 8.
    P-value for atwo tailed test P-value= 2 P[Z > 2.003] = 2(.024)=0.048 How does this p-value compared with =0.05? Since p-value=0.048 < =0.05, reject the null hypothesis H0 in favor of the alternative hypothesis Ha. Conclusion: There is an association between drinking and lung cancer. Is this relationship causal?
  • 9.
    Chi-Square Test ofIndependence (based on a Contingency Table) 2 2 ( xp ) ( 1)( 1) Observed E ected Expected df r c       
  • 10.
    In the followingcontingency table estimate the proportion of drinkers among those who develop Lung Cancer and those without the disease? Lung Cancer Total Case Control Drinker Yes O11=33 O12=27 R1=60 No O21=1667 O22= 2273 R2=3940 Total C1 = 1700 C2 = 2300 n = 4000 E11=1700(60)/4000=25.5 E12=34.5 E21=1674.5 E22=2265.5
  • 11.
    E11=1700(60)/4000=25.5 E12=34.5 E21=1674.5 E22=2265.5 2 4 1 2 22 2 2 ( xp ) (33 25.5) (27 34.5) 25.5 34.5 (1667 1674.5) (2273 2265.5) 1674.5 2265.5 4.0 k k obs Observed E ected Expected              
  • 12.
    How do wecalculate P-value? • SPSS, Epi-Info statistical packages could be used to calculate the p-value for various tests including the Chi-Square Test • If p-value is less than 0.05, then reject the null hypothesis that rows and column variables are independent
  • 13.
    Testing Hypothesis WhenTwo Population Means are Compared H0: 1= 2 Ha: 1 2
  • 14.
    QUESTION: Is therean association between age and Lung Cancer? G roup 1 Disease M ean age of the cases G roup 2 No Disease M ean age of the controls
  • 15.
    Use Two-sample t-testwhen both samples are independent • H0: 1 = 2 vs Ha: 1  2 • H0: 1 - 2 = 0 vs Ha: 1 - 2  0 • t= difference in sample means – hypothesized diff. SE of the Difference in Means • Statistical packages provide p-values and degrees of freedom • Conclusion: If p-value is less than 0.05, then reject the equality of the means
  • 16.
    Paired t-test for Matchedcase control study • H0: 1 = 2 vs Ha: 1  2 • H0: 1 - 2 = 0 vs Ha: 1 - 2  0 • Paired t-test= Mean of the differences –0 SE of the Differences in Means • Statistical packages provide p-values for paired t-test • Conclusion: If p-value is less than 0.05, then reject the equality of the means