Download as PDF, PPTX
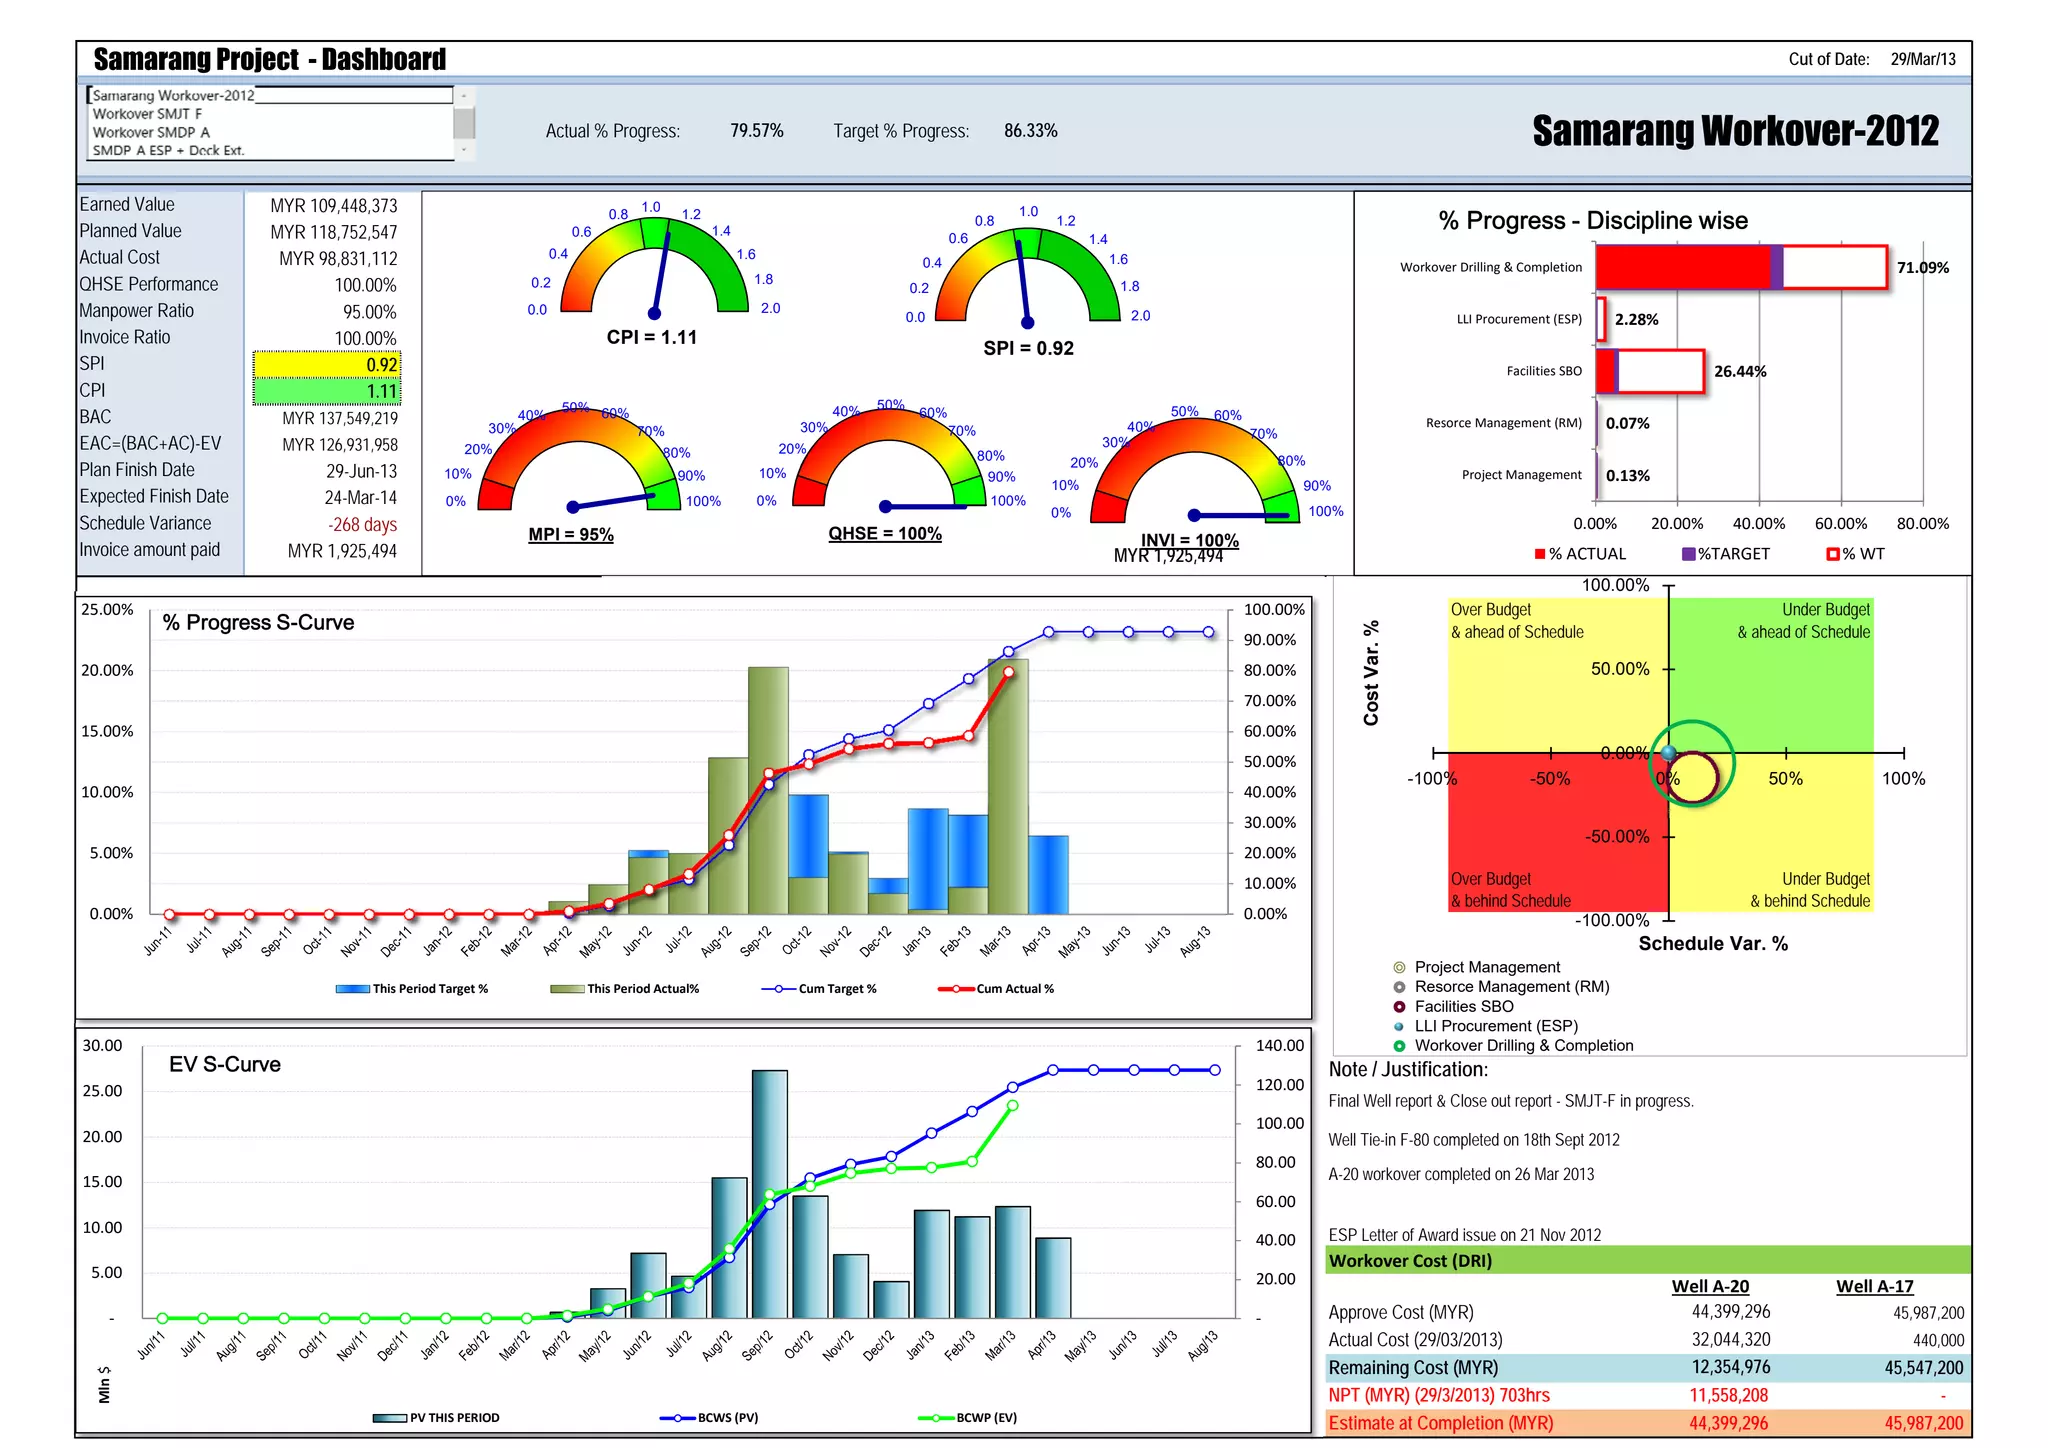

This document provides a progress report on the Samarang Project as of 29 March 2013. The actual progress is 79.57% compared to the target progress of 86.33%. Key metrics like earned value, planned value, actual cost, safety performance, manpower usage, and invoice payments are reported. Two wells (Wells A-20 and F-80) have been completed while another (Well A-17) is over budget. The expected finish date for the project is 24 March 2014, representing a schedule variance of 268 days later than planned.


