Download as PDF, PPTX


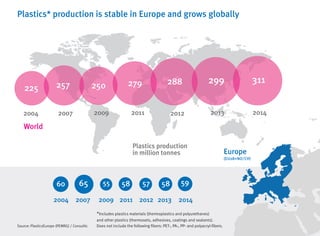
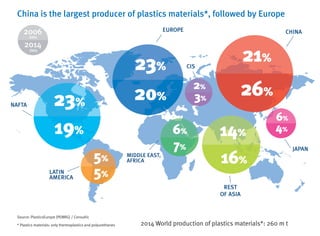
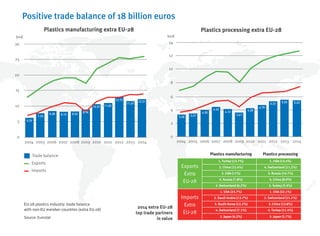
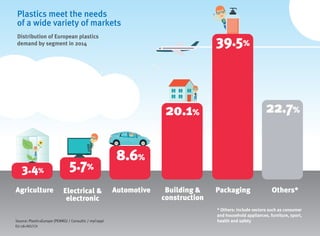
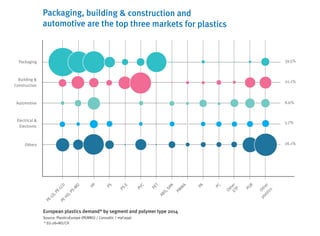
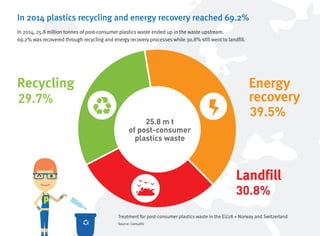
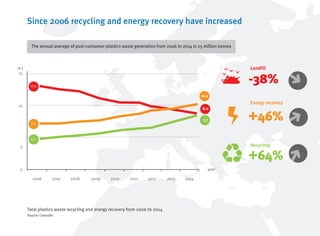
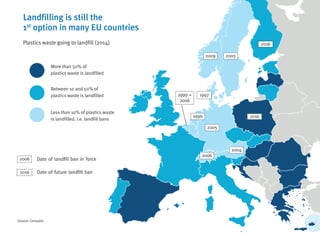
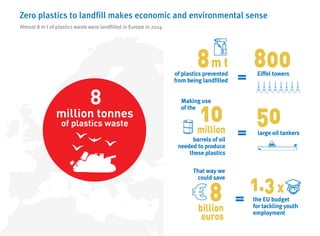
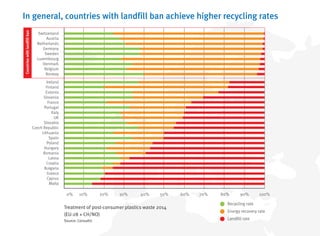
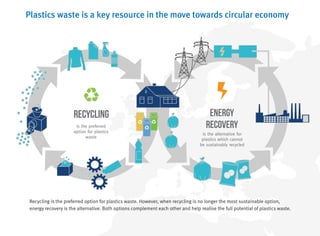
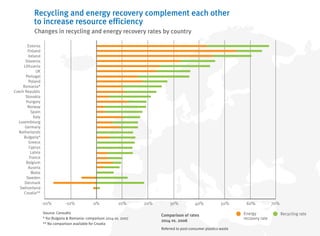
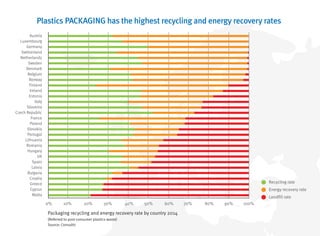

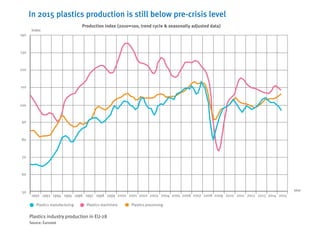


This document provides an analysis of plastics production, demand, waste management and recycling data for Europe. Some key points: - Plastics production in Europe is stable while global production is growing, with China being the largest producer. - Packaging, building/construction and automotive are the top markets for plastics in Europe. - Recycling and energy recovery of plastics waste in Europe has increased in recent years but 30% still goes to landfill. - Further increasing recycling and limiting landfilling can provide economic and environmental benefits for Europe.


